Original article
Use of text-mining methods to improve
efficiency in the calculation of drug exposure
to support pharmacoepidemiology studies
Stuart McTaggart,
1Clifford Nangle,
1,4Jacqueline Caldwell,
1,4Samantha Alvarez-Madrazo,
2,4Helen Colhoun
3,4and
Marion Bennie
1,2,4*
1
Public Health and Intelligence Strategic Business Unit, NHS National Services Scotland, Edinburgh,
UK,
2Strathclyde Institute of Pharmacy and Biomedical Sciences, University of Strathclyde, Glasgow,
UK,
3Institute of Genetics and Molecular Medicine, University of Edinburgh, Edinburgh, UK and
4Farr
Institute of Health Informatics Research, Edinburgh, UK
*Corresponding author. Strathclyde Institute of Pharmacy and Biomedical Sciences, University of Strathclyde, 161 Cathedral Street, Glasgow G4 0RE, UK. E-mail: [email protected]
Editorial decision 22 November 2017; Accepted 11 December 2017
Abstract
Background
: Efficient generation of structured dose instructions that enable researchers
to calculate drug exposure is central to pharmacoepidemiology studies. Our aim was to
design and test an algorithm to codify dose instructions, applied to the NHS Scotland
Prescribing Information System (PIS) that records about 100 million prescriptions per
annum.
Methods
: A natural language processing (NLP) algorithm was developed that enabled
free-text dose instructions to be represented by three attributes – quantity, frequency and
qualifier – specified by three, three and two variables, respectively. A sample of 15 593
distinct dose instructions was used to test, validate and refine the algorithm. The final
algorithm used a zero-assumption approach and was then applied to the full dataset.
Results
: The initial algorithm generated structured output for 13 152 (84.34%) of
the 15 593 sample dose instructions, and reviewers identified 767 (5.83%) incorrect
translations, giving an accuracy of 94.17%. Following subsequent refinement of the
algorithm rules, application to the full dataset of 458 227 687 prescriptions (99.67% had
dose instructions represented by 4 964 083 distinct instructions) generated a structured
output for 92.3% of dose instruction texts. This varied by therapeutic area (from 86.7%
for the central nervous system to 96.8% for the cardiovascular system).
Conclusions
: We created an NLP algorithm, operational at scale, to produce structured
output that gives data users maximum flexibility to formulate, test and apply their own
assumptions according to the medicines under investigation. Text mining approaches
can provide a solution to the safe and efficient management and provisioning of large
volumes of data generated through our health systems.
VCThe Author(s) 2018. Published by Oxford University Press on behalf of the International Epidemiological Association. 1
Key words:Text mining, natural language processing, dose information, prescriptions
Introduction
As health systems become more digitized, the volume and complexity of information grow rapidly and place demands on data providers to adopt new approaches to manage and provision these data in a form that promotes safe, effective and efficient use by stakeholders. Medicines are the most frequently used health technology, accounting for a rising proportion of health care budgets, and their impact is of interest to patients, clinicians, manufacturers and payers.1 The consequence is an ever-increasing demand to examine how medicines are being used in routine clinical practice, against a reducing evidence base as the medicines regulation landscape responds to growing public pressure for acceler-ated access through the concept of ‘adaptive licensing’.2
Drug utilization and pharmacoepidemiology studies seek to address this by better understanding how we use medicines in routine care and their effects, intended and unintended.3–5Critical to this endeavour is a requirement for access to quality data on individual drug exposure across populations.6The challenge is that most electronic prescribing systems permit prescribers to record dose in-structions as free text, not structured data. The conse-quence is an extensive use of researchers’ time deployed to transform these data into a usable format by variable methods, often poorly documented, to calculate drug ex-posure.7One solution is the application of rule-based nat-ural language processing (NLP) methods to rapidly generate valid structured variables from free text, enabling drug exposure periods to be constructed consistently and reproducibly. NLP methods offer the ability to extract structured or standardized information from free texts in large volumes by defining sets of rules and lexicons in an iterative process.8
This approach is not new, with early applications often seeking to identify the presence of medicine prescribing
attributes within clinical notes9–11but not permitting calcula-tion of drug exposure time periods. Shahet al.12reported the application of a simple algorithm to a research database to codify free-text dose instructions to generate a derived daily dose. Karystianiset al.7highlighted that the adoption of the Shah approach limited the ability of researchers to under-stand potential important variability in dosage information (e.g. two tablets up to three times daily would generate a sin-gle average-value daily dose of three tablets). They designed and tested a model to represent the variability and flexibility in drug directions, including the concept of minimum and maximum values for drug dosage, frequency and interval.7 Our study builds on this evidence and reports the design, testing and routine adoption at scale of a zero-assumption approach to the codification of free-text dosage information applied to the National Health Service (NHS) Scotland Prescribing Information System (PIS).13
Methods
Data source
The PIS is an administrative database recording all NHS prescriptions prescribed, dispensed and reimbursed in the community in Scotland.13The PIS records information for about 100 million prescriptions per annum, around 98% of which include a unique person identifier. General practi-tioner (GP) prescribing accounts for about 95% of records, and these include an electronic prescription message containing free-text dose instructions. Other health care professionals’ prescriptions are largely paper-based, from which dose instructions are not captured. As the NHS is the universally used health care system in Scotland, the PIS provides a comprehensive record of primary care prescrib-ing for a population of 5.3 million.
Key Messages
• A natural language processing (NLP) algorithm was developed to enable free-text dose instructions from 458 227 687 prescriptions of the NHS Scotland Prescribing Information System (2009–15) to be represented as quantity, frequency and qualifier.
• The final algorithm after clinical validation generated an overall structured output of 92.3%, which varied by thera-peutic area (from 86.7% for the central nervous system to 96.8% for the cardiovascular system).
The study dataset included all electronic prescription messages for systemic therapies from April 2009 to May 2015 (inclusive). Each preparation prescribed is identifiable by a unique code based on the therapeutic groupings of the British National Formulary (BNF).14 These were used to identify systemic therapies and exclude topical treatments, which generally do not include information about the quan-tity to be administered within the dose instructions. The free-text dose instructions were initially cleansed to remove potentially confidential or disclosive information. The dose instruction free texts were then stratified according to the frequency with which they occurred (i.e.1000, 100–999, 10–99, 2–9 times or once only within the dataset).
Phase 1: Definition of attributes and algorithm development
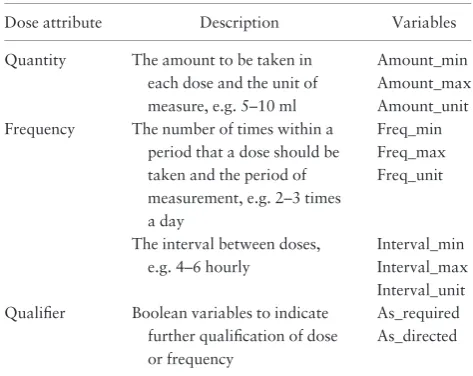
In common with others,7,12 we recognized that free-text dose instructions could be represented by three attributes– quantity, frequency and qualifier–each of which is then speci-fied by a set of variables. An initial review of the 1000 most frequently occurring dose instructions identified that quan-tity and frequency attributes could each be represented by three variables to define minimum and maximum values and unit or period of measure, whereas qualifier was represented by two Boolean variables indicating ‘as directed’ or ‘as required’ (Table 1). We applied NLP methods to extract structured output defined by those variables using the Ciao implementation of the Prolog general purpose programming language [http://ciao-lang.org]. This was chosen because of the ease with which it is possible to include grammar syntax within the executable program.8Words not associated with quantity or frequency information were ignored using rules. These rules checked for defined phrases and tested whether there existed a variable-length phrase that failed to satisfy any rule used to identify quantity or frequency information (e.g. ‘dispense by instalment’, ‘dissolve sachet’).
The 1000 dose instructions were then processed using the algorithm, and the structured outputs were inspected manu-ally for completeness and correctness. The rules and lexicons were modified and extended with the aim of achieving struc-tured output for at least 85% of the distinct dose instruction and an error rate <1%. The process was repeated for sequential aliquots of the next 1000 most frequent instruc-tions, until all with a frequency1000 had been processed. Finally, a random sample of 500 dose instructions from each of the lower-frequency strata was introduced and the process repeated. Retrospective checking was performed to ensure that algorithm changes did not have a negative impact on the output compared with previous versions.
Phase 2: Clinical validation and refinement
All free-text dose instructions with a frequency 1000, and a new random sample of 500 from each of the other
strata, were processed by the algorithm. The dose instruc-tions, their structured outputs and any untranslated instructions were split into files. Each file was manually assessed by at least two reviewers from the Farr Institute@Scotland Pharmacoepidemiology Group, which included pharmacists, medical clinicians and researchers. Reviewers were asked to identify any errors and propose expected structured output for untranslated instructions. This feedback was used to refine the algorithm further, with retrospective checking to ensure no impact on the previously correct structured outputs.
Phase 3: Application of the final algorithm
The finalized algorithm was used to process the free-text dose instructions for all prescriptions in the dataset by therapeutic grouping. Output measures were the number of prescriptions with a structured output produced plus the number in which an element of discretion was exhibited (i.e. a range in quantity or frequency, or the presence of a qualifier, e.g. ‘one or two to be taken 4-6 hourly as required’).
Results
For the period April 2009 to May 2015, there were 544 783 687 prescriptions with an electronic prescription message record, of which 458 227 687 related to systemic therapies. Of these, 456 684 974 (99.67%) had free-text dose instructions within the message. These dose instruc-tions were represented by 4 964 083 distinct free-text dose instructions. A total of 13 593 (0.27%) distinct free-text dose instructions occurred 1000 times, accounting for 405 743 493 (88.85%) of all prescriptions with a free-text dose instruction. A further 75 081 (1.5%) distinct dose instructions occurred between 100 and 999 times within the dataset and accounted for an additional 20 293 362 (4.44%) prescription items (Table 2).
Phase 1
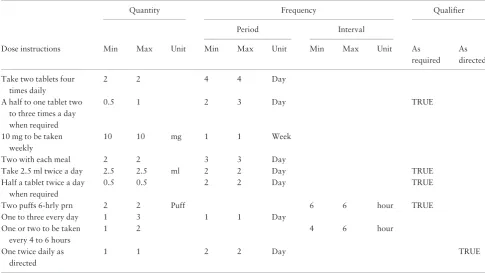
a quantity unit was only specified within the structured output when it would impart additional meaning (e.g. ‘mg’ or ‘ml’). Table 3 presents a selection of dose instruction texts and how these are represented within the structured model.
Phase 2
A total of 15 593 free-text dose instructions that comprised all 13 593 distinct instructions occurring 1000 times plus 500 from each of the other strata (Table 2) were reviewed. The algorithm produced structured output for 13 152 (84.34%) instructions, and reviewers identified 767 (5.83%) incorrect translations, giving an algorithm accu-racy of 94.2%. Additionally, reviewers were able to pro-vide interpretations for 48% of untranslated dose instructions that were used to refine the algorithm further. The most significant change was to differentiate between dose frequency within a period and specification of an interval between doses. Reviewers felt that a literal
interpretation of, for example, ‘every 4 hours’ to mean six times per day, was likely to lead to overestimation of consumption. Additionally, ‘unit tests’ that automate the detection of errors introduced by algorithm changes were implemented.
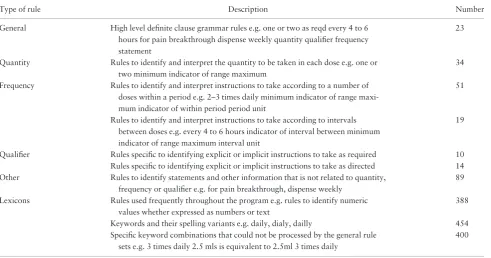
The final algorithm comprised 23 high-level grammar rules to identify the three main dose attributes, with a further 217 rules that identified the values to populate the specific variable and information within dose instructions that could be ignored. These were supported by lexicons containing 1242 words and phrases, including spelling variants (Table 4).
Phase 3
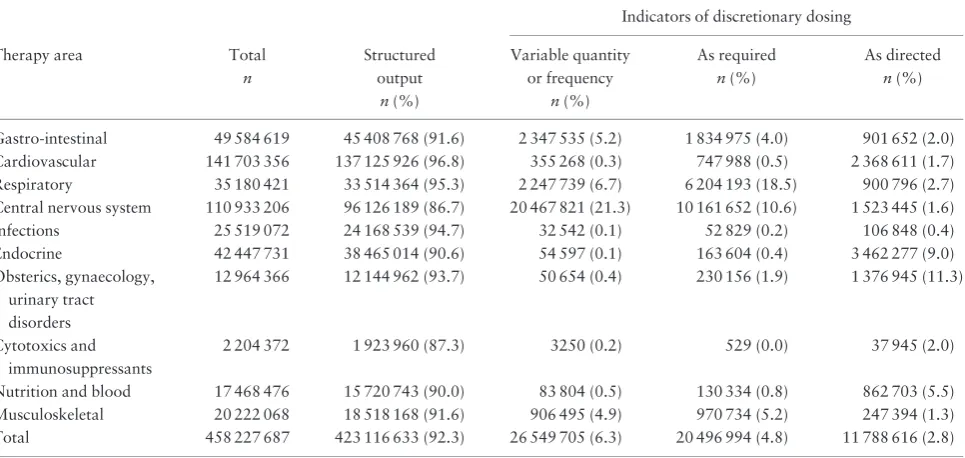
Table 5 presents, by therapeutic area, the output of the final algorithm applied to all 458 227 687 prescriptions in the dataset. Overall, the algorithm generated structured output for 92.3% of prescriptions, but this ranged from 86.7% for central nervous system (CNS) drugs to 96.8% for cardiovascular system (CVS) drugs. The proportion of dose instructions that allowed a degree of discretion (i.e. a range in quantity or frequency, or the presence of a quali-fier) was <1% for most therapy areas, but was much higher for those where drugs are often used to provide symptomatic relief: musculoskeletal (4.9%); gastrointesti-nal (5.2%); respiratory (6.7%); and CNS drugs (21.3%), which encompass pain management.
Discussion
Interpreting and understanding medication dose instruc-tions relies upon knowing how much and how often a medicine is to be taken. These are elementary concepts, so we adopted a pragmatic approach in which we aimed to transform free-text dose instructions into regular struc-tured information that could be readily used by research teams. This study, one of only a small number of published studies, reports our experience with the application of NLP approaches at scale to the NHS Scotland national prescrib-ing dataset. Our study dataset comprised 458 227 687 prescriptions, of which 99.67% had dose instructions represented by 4 964 083 distinct texts; 13 593 (0.27%) of these occurred 1000 times, accounting for 405 743 493 (88.85%) of all the prescriptions with a free-text dose instruction. We developed an NLP algorithm which, on application to the study dataset, generated an overall struc-tured output of 92.3% (ranging from 86.7% for CNS drugs to 96.8% for CVS drugs).
[image:4.612.61.298.73.261.2]The application of NLP methods to support the inter-pretation of unstructured dose instructions, still common-place in electronic prescribing systems, has the potential to significantly improve the efficiency of conducting drug
Table 1.Structured Dose Instruction Model
Dose attribute Description Variables
Quantity The amount to be taken in each dose and the unit of measure, e.g. 5–10 ml
Amount_min Amount_max Amount_unit Frequency The number of times within a
period that a dose should be taken and the period of measurement, e.g. 2–3 times a day
Freq_min Freq_max Freq_unit
The interval between doses, e.g. 4–6 hourly
Interval_min Interval_max Interval_unit Qualifier Boolean variables to indicate
further qualification of dose or frequency
[image:4.612.64.299.339.456.2]As_required As_directed
Table 2.Number of prescriptions by dose instruction frequency (2009–15) in the NHS Scotland Prescribing Information system (PIS) dataset
Frequency of dose instruction free-text
No. of distinct dose instructions
Total no. of prescriptions
1000 13 593 405 743 493
100 to 999 75 081 20 293 362
10 to 99 839 322 21 959 830
2 to 9 1 175 767 5 827 969
1 2 860 320 2 860 320
utilization and pharmacoepidemiology studies; free-text dose instructions are cumbersome and can be difficult to interpret and analyse in large volumes. Transformation into structured dose attributes can enable calculations to be more easily performed to derive the intended daily dose, and to estimate the expected duration for which a prescrip-tion will provide treatment. This is the foundaprescrip-tion on which further work can be performed to roll up prescribing events for different medicinal products containing the same active ingredient and combine records that overlap in time, subject to a persistence window, to generate measures to estimate adherence and drug eras to explore clinical outcome and safety.15,16
Our data model shares similarities with the approach used by Shahet al.12and built upon by Karystianiset al.7 However, Shahet al. outputted a single numerical value for the amount to be consumed daily, with a flag to indi-cate whether this was a calculated average and if consump-tion was ‘as needed’, whereas Karystianiset al. outputted more granular information but converted the dose intervals to the number of times per day and set the minimum frequency to zero for ‘as required’ prescriptions. Both methods allow identification of variability within a dose instruction but lose elements of detail. In contrast, we have separated dose frequency information according to whether the instructions are based on a number of doses to be taken within a period (e.g. twice per day) or with an interval between each dose (e.g. every 4 hours), and
separately present the variables ‘as required’ and ‘as directed’ as a qualifier attribute. This is consistent with our intention of developing a zero-assumption approach to our data provisioning.
The performance of our algorithm was validated through manual inspection by a multidisciplinary group, producing an accuracy of 94.2% (n¼13 152). This com-pares favourably to an accuracy of 98.8% (n¼1000) from Shahet al.12and 90.9% (n¼220) from Karystianiset al.7 Unsurprisingly, our free-text dose instruction data include many of the issues previously identified by others, includ-ing misspellinclud-ings, the use of acronyms and abbreviations and structural ambiguity.7 Some of these we have addressed by extending the lexicons used by the NLP algo-rithm, and others are resolved by the rule-set that looks for sequences or proximity of words to deduce meaning. However, our model remains challenged by complex dose instructions such as those that call for one dose to be taken for a period of time followed by a different dose (e.g. ‘one daily for 5 days and then one twice daily thereafter’). Our final algorithm is a balance between the drive towards dedicated rules to characterize individual distinct free-text dose instructions, and maintaining a manageable number of generic rules.
[image:5.612.62.548.74.347.2]Our study reports, for the first time, analysis of the level of translation by individual therapeutic area, identified by Shah et al.as a limitation.12 The results reflect the com-plexity and flexibility in treatment regimens adopted in the
Table 3.Examples of dose instructions and their structured output
Quantity Frequency Qualifier
Period Interval
Dose instructions Min Max Unit Min Max Unit Min Max Unit As As required directed
Take two tablets four times daily
2 2 4 4 Day
A half to one tablet two to three times a day when required
0.5 1 2 3 Day TRUE
10 mg to be taken weekly
10 10 mg 1 1 Week
Two with each meal 2 2 3 3 Day
Take 2.5 ml twice a day 2.5 2.5 ml 2 2 Day TRUE
Half a tablet twice a day when required
0.5 0.5 2 2 Day TRUE
Two puffs 6-hrly prn 2 2 Puff 6 6 hour TRUE
One to three every day 1 3 1 1 Day
One or two to be taken every 4 to 6 hours
1 2 4 6 hour
One twice daily as directed
management of acute and chronic disease. For example, cardiovascular disease had the highest translation rate (96.8%) and one of the lower rates for dosage flexibility (0.3%), affirming a level of dosage standardization in treatment. In contrast, CNS drugs, which include pain management therapy, illustrated the lowest translation rate (86.7%) and the highest dosage flexibility (21.3%), a con-sequence of individual dosage titration often over time in this therapeutic area. Furthermore, although the extent of use of qualifiers was relatively low, this also varied by ther-apeutic area. These data provide useful and important intelligence for researchers choosing to use real-world administrative datasets in their studies.
Limitations
This study has a number of limitations. First, the model is dependent on the prescriber recording a dose instruction (99.67% in our sample) and including dose and frequency attributes (92.3%), to enable the algorithm to generate a structured output. Nevertheless, the present level of trans-lation supports researchers to readily derive daily dose exposure for the majority of prescriptions, relying on man-ual interpretation and/or development of specific rules for any untranslated instructions. Second, we have built the NLP algorithm based on only systemic therapies covering BNF chapters 1–10. This largely omits topical and other non-oral therapies that account for 15% of prescriptions within the PIS dataset. However, it is likely that the algo-rithm would produce some structured output for these; but
elements may be incomplete as prescribers often omit the quantity and frequency of each dose, using ‘as required’ and ‘as directed’ qualifiers. In these situations, researchers need to revert to quantity and frequency of supply to examine drug use. Finally, the design and validity of the algorithm are based predominantly on a sample of 15 539 distinct dose instructions which focused on the most fre-quently occurring instructions, and this is likely to explain the variation by therapeutic area (Table 5). However, clini-cal validation did include a second random sample from each frequency stratum inTable 2. Nevertheless, research-ers should remain vigilant in undertaking quality checks throughout data transformation and analysis.
Future direction
The algorithm is now (April 2017) in operation and researchers can request a free-text dose instruction trans-lated output as part of their PIS data extract through eDRIS, NHS National Services Scotland [www.isdscot land.org/Products-and-Services/eDRIS/], the body that pro-visions national datasets on behalf of NHS Scotland. A 12-month review of the performance of the algorithm will be undertaken, including feedback from users of the output, and this will inform future algorithm versions. Preliminary feedback from two early studies examining methadone17 and direct oral anticoagulant therapy16has been positive.
[image:6.612.64.556.75.333.2]Furthermore, our algorithm was applied to dose instruc-tions as recorded by GPs, so it should be applicable to and equally effective with data from other English language
Table 4.Types of rules in final algorithm
Type of rule Description Number
General High level definite clause grammar rules e.g. one or two as reqd every 4 to 6 hours for pain breakthrough dispense weekly quantity qualifier frequency statement
23
Quantity Rules to identify and interpret the quantity to be taken in each dose e.g. one or two minimum indicator of range maximum
34
Frequency Rules to identify and interpret instructions to take according to a number of doses within a period e.g. 2–3 times daily minimum indicator of range maxi-mum indicator of within period period unit
51
Rules to identify and interpret instructions to take according to intervals between doses e.g. every 4 to 6 hours indicator of interval between minimum indicator of range maximum interval unit
19
Qualifier Rules specific to identifying explicit or implicit instructions to take as required 10 Rules specific to identifying explicit or implicit instructions to take as directed 14 Other Rules to identify statements and other information that is not related to quantity,
frequency or qualifier e.g. for pain breakthrough, dispense weekly
89
Lexicons Rules used frequently throughout the program e.g. rules to identify numeric values whether expressed as numbers or text
388
Keywords and their spelling variants e.g. daily, dialy, dailly 454 Specific keyword combinations that could not be processed by the general rule
sets e.g. 3 times daily 2.5 mls is equivalent to 2.5ml 3 times daily
GP-based prescription datasets, such as the Clinical Practice Research database (CPRD)18 or The Health Improvement Network (THIN) database.19
Conclusion
We have presented the successful adoption of a text-mining approach, through design and application of an NLP algorithm, as a route to the provisioning of large volumes of free-text dose instructions, generated through capturing all electronic prescriptions (about 100 million per annum) in primary care in Scotland. We have taken a zero-assumption approach to the codification and produc-tion of general rules to create the algorithm, ensuring that users of the data have maximum flexibility to formulate, test and apply their own assumptions according to the medicines, population and research questions under inves-tigation. Data science expertise will become ever more important to assist the effective and safe management of ‘big data’, to enable rapid creation of new clinical knowledge for innovation in health services.
Acknowledgements
We thank the Farr Institute @ Scotland Pharmacoepidemiology Group for their oversight and critical review of the work-stream activities, and Professor David Robertson, Dean of Special Projects in Science and Engineering, the University of Edinburgh, for assis-tance with relevant concepts of Natural Language Programming.
Conflict of interest:HC received research support and an
honora-rium and is also a member of the advisory panels and speakers’ bureaus for Sanofi Aventis, Regeneron and Eli Lilly. She has been a member of the Data Safety Monitoring Board of the advisory panel
for the CANTOS Trial (Novartis Pharmaceuticals). She also receives or has recently received non-binding research support from Roche Pharmaceuticals, Pfizer Inc., Boehringer Ingelheim and AstraZeneca LP. She is a shareholder of Roche Pharmaceuticals and Bayer.
Funding
This study was supported by the Farr Institute [Medical Research Council (MRC) grant no. MR/K007017/1]. The Farr Institute @ Scotland is supported by a 10-funder consortium: Arthritis Research UK, the British Heart Foundation, Cancer Research UK, the Economic and Social Research Council, the Engineering and Physical Sciences Research Council, the Medical Research Council, the National Institute of Health Research, the National Institute for Social Care and Health Research (Welsh Assembly Government), the Chief Scientist Office (Scottish Government Health Directorates) and the Wellcome Trust (MRC grant no: MR/K007017/1).
References
1. Organisation for Economic Co-operation and Development (OECD).Health at a Glance 2015: OECD Indicators. Paris: OECD Publishing, 2015.
2. European Medicines Agency. Final Report on the Adaptive Pathways Pilot. London: European Medicines Agency, 2016. 3. Wettermark B. The intriguing future of pharmacoepidemiology.
Eur J Pharmacol2013;69(Suppl 1):43–51.
4. Elseviers M, Wettermark B, Almarsdottir ABet al. Introduction to drug utilization research. In: Elseviers M, Wettermark B, Almarsdottir ABet al. (eds).Drug Utilization Research: Methods and Applications. Chichester, UK: Wiley Blackwell, 2016. 5. Strom BL. Overview of automated databases. In: Strom BL,
Kimmel SE, Hennessy S (eds).Pharmacoepidemiology. Chichester, UK: Wiley Blackwell, 2012.
[image:7.612.67.550.76.305.2]6. European Network of Centres for Pharmacoepidemiology and Pharmacovigilance (ENCePP). Guidelines on Methodological
Table 5.Conversion of free-text dose instructions to structure output by therapeutic area
Indicators of discretionary dosing
Therapy area Total n
Structured output
n(%)
Variable quantity or frequency
n(%)
As required n(%)
As directed n(%)
Gastro-intestinal 49 584 619 45 408 768 (91.6) 2 347 535 (5.2) 1 834 975 (4.0) 901 652 (2.0) Cardiovascular 141 703 356 137 125 926 (96.8) 355 268 (0.3) 747 988 (0.5) 2 368 611 (1.7) Respiratory 35 180 421 33 514 364 (95.3) 2 247 739 (6.7) 6 204 193 (18.5) 900 796 (2.7) Central nervous system 110 933 206 96 126 189 (86.7) 20 467 821 (21.3) 10 161 652 (10.6) 1 523 445 (1.6) Infections 25 519 072 24 168 539 (94.7) 32 542 (0.1) 52 829 (0.2) 106 848 (0.4) Endocrine 42 447 731 38 465 014 (90.6) 54 597 (0.1) 163 604 (0.4) 3 462 277 (9.0) Obsterics, gynaecology,
urinary tract disorders
12 964 366 12 144 962 (93.7) 50 654 (0.4) 230 156 (1.9) 1 376 945 (11.3)
Cytotoxics and immunosuppressants
2 204 372 1 923 960 (87.3) 3250 (0.2) 529 (0.0) 37 945 (2.0)
Standards in Pharmacoepidemiology. Revision 6. London: European Medicines Agency, 2017.
7. Karystianis G, Sheppard T, Dixon WG, Nenadic G. Modelling and extraction of variability in free-text medication prescriptions from an anonymised primary care electronic medical record re-search database.BMC Med Inform Decis Mak2016;16:18. 8. Bratko I. Language Processing with Grammar Rules. In:Prolog
Programming for Artificial Intelligence. 4th edn. Boston, MA: Addison Wesley, 2012.
9. Spasic I, Sarafraz F, Keane JA, Nenadic G. Medication informa-tion extracinforma-tion with linguistic pattern matching and semantic rules. J Am Med Inform Assoc2010;17:532–35.
10. Yang H. Automatic extraction of medication information from med-ical discharge summaries.J Am Med Inform Assoc2010;17:545–48. 11. Xu H, Stenner SP, Doan S, Johnson KB, Waitman LR, Denny JC. MedEx: a medication information extraction system for clinical narratives.J Am Med Inform Assoc2010;17:19–24.
12. Shah AD, Martinez C. An algorithm to derive a numerical daily dose from unstructured test dosage instructions.Phamacoepidemiol Drug Saf2006;15:161–66.
13. Alvarez-Madrazo S, McTaggart S, Nangle C, Nicholson E, Bennie M. Data Resource Profile: The Scottish National Prescrfibing Information System (PIS).Int J Epidemiol2016;45:714–15.
14. Prescription Pricing Division, NHS Business Services Authority. Glossary of Terms. http://www.ppa.org.uk/systems/glossary/gloss ary.html# (20 October 2017, date last accessed).
15. Foundation for the National Institutes of Health (FNIH), Observational Medicines Outcomes Group. Observational Medical Outcomes Partnership Common Data Model Specifications Version 4.0. 2012. http://omop.org/CDM (March 2017, date last accessed).
16. Mueller T, Alvarez-Madrazo S, Robertson C, Bennie M. Use of direct oral anticoagulants in patients with atrial fibrillation in Scotland: Applying a coherent framework to drug util-isation studies. Pharmacoepidemiol Drug Saf 2017;26:
1378–86.
17. Gao L, Dimitropoulou P, Robertson JR, McTaggart S, Bennie M, Bird SM. Risk-factors for methadone-specific deaths in Scotland’s methadone-prescription clients between 2009 and 2013.Drug Alcohol Depend2016;167:214–23.
18. Medicines and Health Care Products Regulatory Authority (MHRA). The Clinical Practice Research Datalink. https:// www.cprd.com/home/ (20 October 2017, date last accessed). 19. The Health Improvement Network (THIN) Research Team.