PREDICTION OF SHIP-LOCK INTERACTION BY USING A MODIFIED POTENTIAL
FLOW SOLVER
Z.-M Yuan, Department of Naval Architecture, Ocean and Marine Engineering, University of Strathclyde
SUMMARY
Ship-lock interactions are very difficult to predict. The hydrodynamics of ships entering (or leaving) a lock is always accompanied with shallow water and bank effects. When a ship enters or leaves a lock with a closed end, a so-called piston effect will be provoked due to the translation waves trapped in the gap between the ship and the lock door. Meanwhile, as the water is accumulating or evacuating in a lock with closed end, a return flow will be generated. The nature of the complex hydrodynamics involved in ship-lock interactions have not been fully understood so far and it is very challenging to develop a mathematical model to predict ship hydrodynamics in a lock. In the 4th MASHCON, the author presented his original simulation results of the hydrodynamic forces on a ship when it entered a lock based on a potential flow solver MHydro. A very large discrepancy was found between the numerical results and experimental measurements. It was con-cluded that the potential flow theory failed to predict the hydrodynamic forces on a ship when it entered a lock. Over the past two years, the author has continuously worked on ship-to-lock problem and proposed a modified potential flow method by adding a proper return flow velocity to the boundary value problem. The results showed the modified method could predict the resistance and lateral forces very well. However, it failed to predict the yaw moment due to the flow separation at the lock entrance.
1 NOMENCLATURE
Φ Velocity potential
As Cross sectional area of a ship (m2)
CB Block coefficient of the ship
d Water depth (m) F1 Longitudinal force (N)
F2 Transverse force (N)
F6 Yaw moment (N·m)
Fr Froude number
g Gravitational acceleration (m/s2) L Length of the ship (m)
l Length of the lock (m) p Pressure (Pa)
t Time (s)
T Draft of the ship (m)
tc The time when the ship is completely in the lock (s)
te The time when the ship bow reaches the lock en-trance (s)
U Forward speed of the ship (m/s) v Velocity of the return flow (m/s) XG Longitudinal centre of gravity (m)
ZG Vertical centre of gravity (m)
δ Block coefficient of the lock ζ Free-surface wave elevation (m) κ Acceleration coefficient λ Wave length (m)
ρ Density of the fluid (kg/m3) φs Steady velocity potential
φu Unsteady velocity potential
Ω Computational fluid domain Δy Eccentricity (m)
2 INTRODUCTION
Prediction of the hydrodynamic forces of a ship while en-tering or leaving a lock is very challenging. The main chal-lenges include:
1) The hydrodynamics of ships entering (or leaving) a lock are always accompanied with shallow wa-ter and bank effects. By comparing with the hy-drodynamic problems in restricted channels, the gaps between ship and bank, and the under-keel clearance are even smaller in the locks. As a re-sult, a very strong ship-bank and ship-bottom in-teraction occurs, which makes the hydrodynamic behaviour be totally different from that in unre-stricted waterways.
nonlinear free surface condition must be pro-posed. The complicated wave systems in the gap between the ship and the door are not yet fully understood.
To address the above mentioned issues, the 3rd
Interna-tional Conference on Ship Manoeuvring in Shallow and Confined Water (3rd MASHCON) focused on ship behav-iour in locks non-exclusively (Vantorre et al., 2012). The benchmark model test data obtained at Flanders Hydrau-lics Research were made publicly accessible, which ena-bles validations for different numerical methods and tools. Henn (2013) used the benchmark data to validate his nu-merical method, which could be potentially implemented into ship handling simulators for lock manoeuvres. Lind-berg et al. (2013) proposed a numerical model based on potential flow theory that uses a linear or non-linear free surface boundary condition and high-order accurate nu-merical approximations. The benchmark tests were used to evaluate the free surface elevation. They found the pres-sure distribution model could not represent the body sur-face boundary condition.
The benchmark data have also been widely used to vali-date the numerical results obtained by CFD (computa-tional fluid dynamics) tools. De Loor et al. (2013) used the benchmark data to validate the lateral and longitudinal forces on a vessel by using OpenFOAM. It was concluded the application of CFD was not yet able to predict absolute design values with sufficient accuracy. Wang and Zou (2014) performed numerical simulations to solve the un-steady RANS equations with a RNG k - ε turbulence model by using ANSYS FLUENT. Dynamic mesh method and sliding interface technique were used to deal with the rel-ative motion between the passing ship and the lock. By comparing with the benchmark test data, it was found the lateral force and yaw moment were well predicted, while the longitudinal force was underestimated, due to the ne-glect of the free surface elevation. Similar numerical sim-ulations studies were also conducted by Toxopeus and Bhawsinka (Toxopeus and Bhawsinka, 2016). They used a viscous-flow solver ReFRESCO to predict the ship-lock interaction effects. The results of the hydrodynamic forces were validated against the benchmark data. Very good agreement was achieved in Case G. But in Case H, the pre-dictions showed a large discrepancy. They also included the results obtained by using potential flow solver ROPES in the comparison and concluded that the ship-lock inter-action could not be captured by potential flow solver, in which the viscous effects were not accounted. It coincides with Yuan and Incecik’s (2016) conclusion that the poten-tial flow solver failed to predict the ship-lock interaction problem.
None of the above mentioned studies address the unsteady wave problems associated with ship-lock interaction. In most of the CFD simulations (De Loor et al., 2013; Toxopeus and Bhawsinka, 2016; Wang and Zou, 2014), the free surface was replaced by a rigid wall condition. As a result, the water elevation in the lock area cannot be cap-tured. Toxopeus and Bhawsinka (Toxopeus and
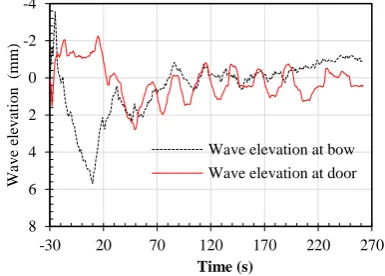
[image:2.595.332.525.298.436.2]Bhawsinka, 2016) concluded that the interaction forces ex-perienced in the lock were not primarily determined by the translation waves travelling in the lock. However, the wave phenomenon was physically measured in the bench-mark tests, especially in lock exit tests (Test C, D and E) (Vantorre et al., 2012). As shown in Figure 1, when the ship model enters the lock, a harmonic wave with period of 25s was measured at the door. To the author’ knowledge, such piston-like free surface elevation are not yet fully understood. No published numerical works are able to capture these waves, including those CFD works that take the free surface condition into account (Meng and Wan, 2016). Although some primary works proposed some mathematical model to represent the waves in the lock, the estimations were not validated against the bench-mark data (Vergote et al., 2013; Vrijburcht, 1988). There-fore, more sophisticated mathematical models are required to help us to understand the fundamental aspect of the waves in the lock.
Figure 1. Measurement of wave elevation of Test D (Vantorre et al., 2012).
The limitation of potential flow method on ship-lock inter-action problem is fully recognized by the author when he presented his original prediction in the 4th MASHCON. However, the high efficiency of potential flow solver is highly demanded in manoeuvring simulator. Since then, the author has been continuously working on proposing on a modified potential flow solver that could provide reason-able prediction of ship-lock interaction. The only pub-lished results based on a potential flow solver (Toxopeus and Bhawsinka, 2016) are shown in Figure 2. The poten-tial flow method only captures the inipoten-tial interaction ef-fects before the bow reaches lock entrance (X = 20.5 m) and it completely fails to predict the full physics of the flow when the ship is partly or fully in the lock. The au-thors attribute the discrepancies to the viscosity, which dominates the interaction effects inside the lock. However, it cannot explain the discrepancies in lateral forces which are not dominated by viscosity, as shown in Figure 2 (b). Therefore, the discrepancies between the measured and calculated forces may be mostly due to the boundary value problem, more specifically, the body surface boundary condition.
-4
-2
0
2
4
6
8
-30 20 70 120 170 220 270
W
av
e
el
ev
at
io
n
(mm
)
Time (s)
Figure 2. Resistance of a ship entering a lock. The poten-tial flow results are provided by Toxopeus and Bhawsinka (2016) by using their in-house potential flow solver ROPES. EFD results are provided by Vantorre et al. (2012).
In the present study, a modified potential flow method will be proposed to deal with the ship-lock interaction problem. No attempts will be made to address the unsteady waves in the lock. The present work will mainly focus on propos-ing a body boundary condition, which could reasonably account for the return flow effects.
3 MATHEMATICAL FORMULATION
3.1 THE ORIGINAL BOUNDARY VALUE PROB-LEM
A right-handed Cartesian coordinate system 𝐱 = (𝑥, 𝑦, 𝑧) is fixed to a ship with its positive x-direction pointing to-wards the bow, positive z-direction pointing upwards and z = 0 on the undisturbed free-surface. The ship is translat-ing at forward speed U(t) with respect to the space-fixed coordinate system. The fluid is assumed to be incompress-ible and inviscid with irrotational motion. The water wave motion is described by the velocity potential Φ (x, y, z, t) and the free-surface wave elevation ζ (x, y, t).
In the body-fixed reference frame, the velocity potential Φ (x, y, z, t) can be decomposed as
( , , , )x y z t s( , , )x y z u( , , , )x y z t (1) in which φs (x, y, z) is the time-independent part and φu (x,
y, z, t) is the unsteady part representing the flow motion induced by the external disturbance such as the presence of other vessels or changes in the waterway topography. In
the present study, considering the speed in the confined waterways is always restricted, the uniform-flow approxi-mation is applied as the basic steady flow. This assumption leads to a relatively easy free-surface condition. Thus, EQ. (1) can be written as
( , , , )x y z t Uxu( , , , )x y z t (2)
The velocity potential φu (x, y, z, t) satisfies the Laplace equation
2 2 2
2 2 2 0
u u u
x y z
(3)
The dynamic and kinetic free-surface conditions are
1 0 2 u u u u p U g t x
, at z = ζ (4)
0
u u u
U
t x x x y y z
, at z = ζ (5)
where g is the gravitational acceleration, ρ is the fluid den-sity and p is the forcing pressure on the free-surface. By applying Taylor series expanded about z = 0 and only keeping the linear terms, the dynamic and kinetic free-sur-face conditions can be linearized as
0
u U u g
t x
, at z = 0 (6)
0 u U
t x z
, at z = 0 (7)
By performing the operation 𝜕/𝜕𝑡 − 𝑈𝜕/𝜕𝑥 on EQ. (6) and then substituting it into EQ. (7), the combined linear-ized free-surface condition is then
2 2 2
2
2 2 2 0
u u u u
U U g
x t z
t x
(8)
Theoretically, the boundary value problem should be solved at each time step by applying nonlinear dynamic and kinetic free-surface boundary conditions in EQ. (4) and (5). Only in this way the complex translation waves trapped in the narrow gap can be captured. In the present study, no attempt will be made to model the wave phenom-enon in the lock and its associated piston effect. Our main objective is to propose an effective methodology based on simplified empirical methods. Therefore, the time depend-ent term in EQ. (8) is neglected and a linearized steady free-surface condition can then be obtained
2 2 2 0 u u U g z x
(9)
The body surface boundary condition follows from the re-quirement that there be no flow through the hull surface. This means 1 u Un n
(10) -12 -10 -8 -6 -4 -2 0 2
12 14 16 18 20 22 24 26 28
F1
(
N
)
X (m) Potential flow solver EFD -8 -6 -4 -2 0 2 4
12 14 16 18 20 22 24 26 28
F2
(
N
)
X (m)
Potential flow solver EFD
(a)
Where ∂/∂n is the derivative along the normal vector 𝐧 = (𝑛1, 𝑛2, 𝑛3) to the hull surface. The normal vector is
de-fined to be positive into the fluid domain. The boundary condition on the sea bottom and side walls can be ex-pressed as 0 u n
(11)
A radiation condition is imposed on the control surface to ensure that waves vanish at upstream infinity
2 2
0, 0
u as x y
(12)
A Rankine source panel method is used to solve the bound-ary value problem in EQ. (3), (9), (10), (11) and (12). The details of the numerical implementation are demonstrated by Yuan et al. (2014). The same in-house developed pro-gramme MHydro is utilized in the present study as the framework to investigate ship hydrodynamics in restricted waterways. Special care should be taken to implement a suitable open boundary condition to satisfy EQ. (12). In numerical calculations, the computational domain is al-ways truncated at a distance away from the ship hull. In general, waves will be reflected from the truncated bound-aries and contaminate the flow in the computational do-main. In the present study, a 2nd order upwind difference scheme is applied on the free-surface to obtain the time and spatial derivatives
2 4 3
2 2 2 1 1 2 1 4 11 9 6 2 4
u i u i
u i
u i u i u i
x x x x x
x x x
(13)
According to Bunnik (1999) and Kim et al. (2005), EQ. (12) can be satisfied consequently by applying EQ. (13). Once the unknown potential φu is solved, the steady pres-sure distributed over the ship hull can be obtained from the linearized Bernoulli’s equation
u u p U t x
(14)
the integral of the pressure over the hull surface, the forces (or moments) can be obtained by
i i
S
F
pn ds, i = 1, 2, …, 6 (15)where
, 1, 2,3 , 4,5, 6
i i n i n
x n (16)
The wave elevation on the free-surface can be obtained from the dynamic free-surface boundary condition in EQ. (6) in the form
-u u
U
g x t
(17)
3.2 THE MODIFIED BOUNDARY VALUE LEM FOR SHIP-LOCK INTERACTION PROB-LEM
It has been concluded by Toxopeus and Bhawsinka (2016) that the ordinary BVP in Section 3.1 could not be used to predict the ship-lock interaction problem, as shown in Fig-ure 2. A modified BVP must be proposed to account for the complex flow around the ship while entering a lock.
When a ship enters or leaves a lock with a closed end, a so-called piston effect will be provoked due to the transla-tion waves trapped in the narrow lock between the ship and the lock door. Meanwhile, as the water is accumulating or evacuating in a lock with closed end, a return flow will be generated.
Assuming a ship enters a lock with a constant forward speed U, the water volume in the lock increases by
sV UA t t
(18)
where As is the cross sectional area of the ship at moment
t. This increased water volume will result in a return flow, which takes the same amount of water leakage through the narrow clearance. As the distance between the ship bow and the lock door decreases, the return flow velocity v(x, t) increases. Assuming the return flow in front of the vessel is uniform, the effect of return flow can be accounted into the body surface boundary condition in the form of an ad-ditional speed v(t). Then the modified body surface condi-tion can be rewritten as
( )
1u U v t n n
(19)
The simplified v(t) can be defined as
0, at ( )
( ), at e
e e c
t t v t
t t t t t
l
(20)
1
1
( ) ( ) , at
( ) ( )
n n c
n c
U t
v t v t t t
l v t v t U
(21)
The initial condition for (21) is v(t1) = v(tc), where v(tc) is calculated by EQ. (20).
By solving the boundary value problem in EQ. (3), (9), (19), (11) and (12) at each time step, the velocity potential φu can be obtained. A 2nd order upwind difference scheme is applied to obtain the time derivatives
1
21 3 1
2
2 2
u
n u n u n u n
t t t t
t t
(22)
The unsteady pressure distributed over the ship hull can then be determined by
u u
p U v
t x
(23)
The forces (or moments) can be calculated by EQ. (15). The wave elevation on the free-surface can be obtained from the dynamic free-surface boundary condition in EQ. (6) in the form
1
( ) u u
t U v
g t x
(24)
4 RESULTS AND DISCUSSIONS
4.1 SHIP MODEL AND TEST MATRIX
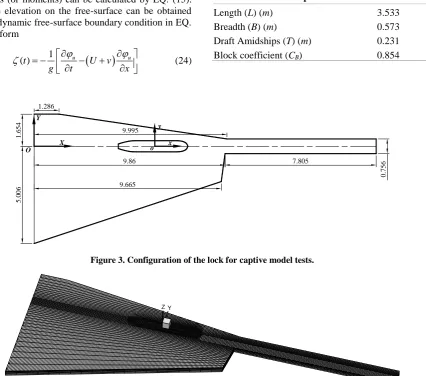
[image:5.595.102.529.300.676.2]Captive model tests were carried out by Vantorre et al. (2012) in FHR. The ship model used in the ship-lock prob-lem is a bulk carrier, with main particulars listed in Table 1 in model scale with a scale factor of 1/75. The lock con-figuration is shown in Figure 3 with a space-fixed coordi-nate system O-XY. To minimize the computational do-main, the long transition channel used for model test is truncated and only the part where X > 0 is retained for the numerical calculations. The initial position (t = 0) in the numerical simulation starts at X = 0. All the forces and mo-ments are calculated in the body-fixed frame, as shown in Figure 3. Test G is selected as the validation case, where water depth to draft ratio d/T = 1.2, speed U = 0.15 m/s, and the model is towed on the centerline of the lock (Y = 0).
Table 1. Main particulars of bulk carrier
Length (L) (m) 3.533
Breadth (B) (m) 0.573 Draft Amidships (T) (m) 0.231 Block coefficient (CB) 0.854
Figure 3. Configuration of the lock for captive model tests.
Figure 4. Panel distribution on the computational domain of Test G. There are 11,346 panels distributed on the entire computational domain: 960 on the wetted body surface, 9,874 on the free-surface, and 1,472 on the side walls.
4.2 RESULTS AND VALIDATIONS The computational domain and mesh distribution of the present study is shown in Figure 4. A dynamic meshing technique is used, which enables an automatic update of
O Y
X
1.6
54
5.0
06
1.286
9.665 9.86 9.995
0.7
56
7.805
o y
x
the computational domain and mesh distribution at each time step when the ship is approaching the lock. The mesh is uniform longitudinally. Non-uniform mesh is applied only in the transverse direction due to the changes of banks and the lock walls. The results of the forces in x-, y-, and
the moment in x-o-y directions are presented in Figure 5. It should be noted that all the positive directions are con-sistent with the body-fixed frame shown in Figure 3. The time step ∆t in the numerical calculations is 0.39s.
(a)
(b)
[image:6.595.144.460.135.562.2](c)
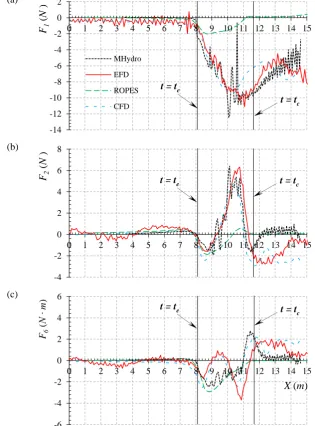
Figure 5. Validation of forces (or moments). (a) Resistance; (b) lateral force; (c) yaw moment. EFD results are provided by Vantorre et al. (2012). CFD results are published by Toxopeus and Bhawsinka (2016) by using viscous-flow code ReFRESCO. Free-surface effect is neglected in ReFRESCO. In the present MHydro program, the acceleration coefficient κ = 0.2.
Figure 5 (a) shows the resistance. Before the ship enters the lock (t < te), the resistance predicted by both ROPES and MHydro is very small (F1 ≈ 0). This is different from the CFD and EFD results. The discrepancies are due to the viscous contribution, which is more significant at model scale than at full scale. The negative values at t < te ob-tained by CFD and EFD represent the drag force contrib-uted by viscous effects. In the present case study, the ship’s speed is very low (Fr= 0.026). According to Schultz (2007), at low to moderate speeds (Fr < 0.25), the frictional resistance is the largest component of the total drag.
How-ever, when the ship starts entering the lock, the contribu-tion of different resistance components changes. The fric-tional resistance is no longer the largest component. The increased return flow velocity would cause an increase in the frictional resistance leading to higher total resistance. But this increase is not significant. As shown in Figure 5 (a), the resistance increases dramatically, which is mainly caused by pressure integration due to the wave-making contribution. According to EQ. (23), the velocity potential gradient (∂φu/∂t) plays a dominant role since the return flow speed and computational domain are changing at -14
-12 -10 -8 -6 -4 -2 0 2
0 1 2 3 4 5 6 7 8 9 10 11 12 13 14 15
F1
(
N
)
MHydro
EFD
ROPES
CFD t = tc
t = te
-4 -2 0 2 4 6 8
0 1 2 3 4 5 6 7 8 9 10 11 12 13 14 15
F2
(
N
)
t = tc
t = te
-6 -4 -2 0 2 4 6
0 1 2 3 4 5 6 7 8 9 10 11 12 13 14 15
F6
(
N
∙
m
)
X (m)
t = tc
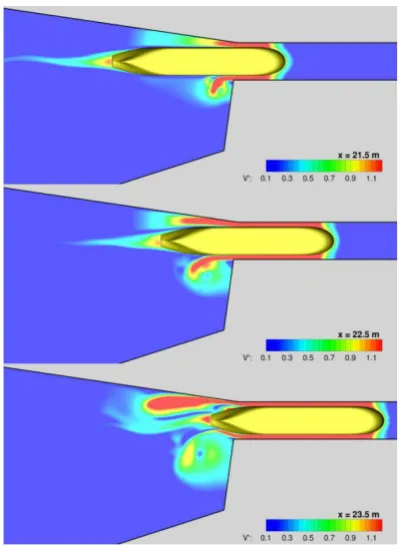
each time speed. Therefore, if a proper acceleration coef-ficient 𝜅 is specified in EQ. (20) to estimate the return flow velocity, the predictions by the present potential flow solver is still satisfactory (even better than CFD solutions). When the ship is completely in the lock (t > tc), the total water volume will not increase, and the return flow is not as pronounced as that at t < tc. As a result, the total re-sistance decreases. However, as the distance between the ship bow and the lock door becomes small, the water will accumulate in the gap and a complex wave phenomenon will occur. In the CFD modelling, the free-surface effect is neglected (Toxopeus and Bhawsinka, 2016) and its pre-dictions at t > tc are not reliable. The present potential flow solver MHydro only keeps the steady terms in the free-surface condition in EQ. (8). As the clearance between the ship bow and the lock door decreases, MHydro underesti-mates the resistance. As the ship gets closer to the door, the generated unsteady waves will be reflected by the door and thereafter interact with the ship, leading to an increase of resistance. Both CFD and MHydro fail to predict this piston effect by neglecting unsteady free-surface effect. A similar conclusion can also be drawn on the lateral force F2. As shown in Figure 5 (b), the modified potential flow solver can predict the lateral force very well at t < tc. After the ship is completely in the lock, the flow becomes sym-metrical very quickly if the unsteady terms are neglected on the free-surface. As a result, the lateral forces calcu-lated by the present potential flow solver reduce to zero shortly after the ship completely enters the lock. The re-sults in Figure 5 (c) indicate that the present potential flow method fails to predict the yaw moment when a ship is en-tering a lock. This is mainly due to the flow separation which occurs at the sharp corner of the lock entrance, as well as at the ship stern. The results by Toxopeus and Bhawsinka (2016) show the importance of eddies gener-ated at sharp corners due to flow separation, as shown in Figure 6. This violates the irrotational assumption adopted in the potential flow method. The sign of yaw moment is determined by the asymmetry of the lock configuration, while the amplitude is determined by the entering speed and blockage coefficient. As the yaw moment is critical for a ship’s maneuvering in the lock area, a symmetrical lock design could help to avoid the yaw moment, as well as the lateral force.
Figure 6. Visualization of the total velocity field on the free-surface by Toxopeus and Bhawsinka (2016). The x-coordinates presented in the figure can be transformed into the present space-fixed frame (as shown in Figure 3) by subtracting 12.335m.
As discussed above, the accuracy of the present calcula-tion is highly dependent on the estimacalcula-tion of the return flow velocity. Figure 7 shows the return flow velocity cal-culated by empirical formulae in EQ. (20) and (21) with different acceleration coefficient κ. It should be noted that the return flow is assumed to be uniform. But in reality, the flow field is more complex. Numerical tests indicate the acceleration coefficient κ should range from 0.1 to 0.3. The corresponding results are shown in Figure 8. The re-sistance is more sensitive to the coefficient κ.
Figure 7. Return flow velocity with different acceleration coefficient κ.
0 0.3 0.6 0.9
8 9 10 11 12 13 14 15
v
(
m
/s
)
X (m)
κ = 0
t = te
[image:7.595.335.525.536.656.2](a)
[image:8.595.148.452.69.360.2](b)
Figure 8. Comparison of forces with different acceleration coefficient κ.
4.3 DISCUSSIONS
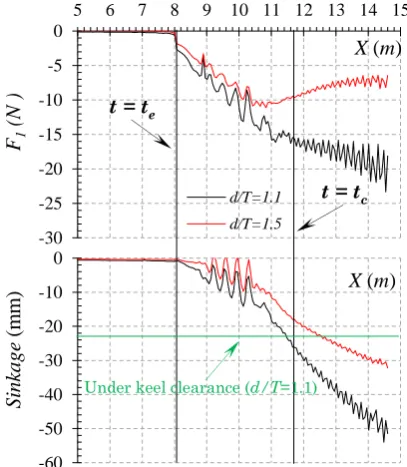
The operability of a ship when it enters a lock is affected by a number of factors, including the width and water depth of the lock, ship size, entering speed, drift angle, the distance between ship bow and the lock door, and the ec-centricity. In this section, we investigate the effect of water depth and eccentricity to see how these two factors influ-ence the ship’s manoeuvrability. The other parameters are remaining the same. By talking about the manoeuvrability of a ship when entering into a lock, the forces in all 6-DoFs should be analysed. The results in Figure 5 show that the forces (moments) in sway and yaw experience some fluc-tuations at te < t < tc. Considering the hydrodynamic deriv-atives in sway and yaw are very large, the interaction forces (moments) in sway and yaw are not likely to make the ship deviate from its original course. The surge force, however, has larger magnitude, while the surge hydrody-namic derivative is relatively small. As a results, in the field observation, it is usually found that the vessel’s speed decreases as it approach the lock door. In some cases, the vessel even stops due to the increase resistance. For this reason, it would be interesting to investigate the surge force induced by the ship-lock interaction. On the other hand, when the under keel clearance (UKC) is small, the risk of grounding should also be taken into account, and it will be interesting to investigate the vessel’s sinkage dur-ing lock-enterdur-ing manoeuver.
Figure 9. The resistance and sinkage of a bulk carrier when it enters a lock with different water depths. The sinkage is calculated by F3/ρgAw, where Aw is the water
plane area, which is taken as 1.9 m2. The entering speed is
0.15m/s, and the acceleration coefficient κ=0.2.
The results of the resistance and sinkage in different water depths are shown in Figure 9. It can be seen that both the resistance and sinkage increase when the ship gradually enters the lock. As the ship is completely in the lock (t > tc ), the resistance experiences a decrease at large UKC (d/T=1.5) when it approaches the door. It is confirmed by -24
-20 -16 -12 -8 -4 0 4
0 1 2 3 4 5 6 7 8 9 10 11 12 13 14 15
F1
(
N
) X (m)
κ = 0 κ = 0.1 κ = 0.2 κ = 0.3 EFD
t = tc t = te
-4 -2 0 2 4 6 8 10
0 1 2 3 4 5 6 7 8 9 10 11 12 13 14 15
F2
(
N
)
X (m)
t = tc t = te
-60 -50 -40 -30 -20 -10 0
Si
nka
ge
(m
m
) X (m)
-30 -25 -20 -15 -10 -5 0
5 6 7 8 9 10 11 12 13 14 15
F1
(N )
X (m)
d/T=1.1
d/T=1.5 t = te
t = tc
[image:8.595.326.530.398.632.2]the experimental measurement, as mentioned before. However, as the UKC becomes very small (d/T=1.1), the resistance keeps an increasing trend, which may stop the vessel if no additional propelling actions are taken. On the other hand, the sinkage also experiences a significant in-crease when the UKC is very small. In particularly, just before the ship is completely in the lock, the sinkage be-comes larger than the UKC (23.1 mm at d/T=1.1). The grounding occurs even without take the trim into account. To make normal progress, the entering speed should keep very low. Fortunately, the ship losses speed due to the in-creased resistance. Therefore, the speed lost (or inin-creased resistance) by nature will prevent the ship from grounding.
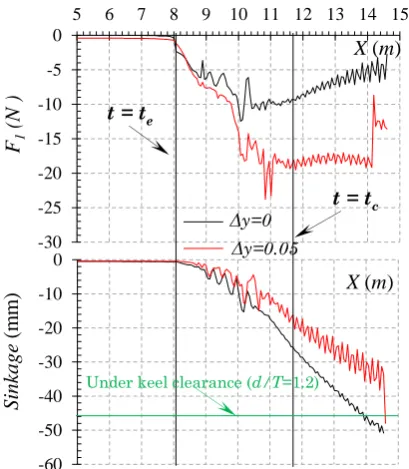
Figure 10. The resistance and sinkage of a bulk carrier when it enters a lock at different eccentricities. The sink-age is calculated by F3/ρgAw, where Aw is the water plane
area, which is taken as 1.9 m2. The entering speed is
0.15m/s, and the acceleration coefficient κ=0.2.
The results of the resistance and sinkage in different ec-centricities are shown in Figure 10. It is interesting to find
that the resistance increases, while the sinkage decreases when a ship approaches the lock with an eccentricity of 50 mm. The eccentricity here refers to the lateral position of the ship model with respect to the lock’s centre line. The difference in resistance and sinkage is induced by the dif-ferent flow characteristics surrounding the vessel. It indi-cates that for the same blockage coefficient, there is a big difference in operability when a ship enters the lock in dif-ferent courses. It can be concluded from Figure 9 and Fig-ure 10 that both the water depth of lock and the eccentricity of the course have a significant influence on ship’s ma-noeuvrability in lock entering process.
5 CONCLUSIONS
In the present study, a modified potential flow method is proposed to predict the hydrodynamic forces on a ships while entering a lock. The body surface boundary condi-tion was modified in order to account for the return flow, which could not be captured by the potential flow theory. An empirical formula is introduced in the present study to estimate the return flow velocity. Through the compari-sons to the benchmark data, as well as CFD calculations, it can be concluded that by complementing this return flow velocity with the boundary value problem, the modified potential flow solver could predict the resistance and lat-eral forces very well. However, it fails to predict the yaw moment due to the flow separation at the lock entrance and ship stern. It indicates the unsteady free-surface effects are very important in predicting the resistance and lateral force, while the viscous effect is less important. But the viscous effects are essential for the prediction of yaw mo-ment. Neglecting the unsteady free-surface effects, the re-turn flow and complex wave phenomenon cannot be cap-tured. It should be noted that the present method is based on a reasonable estimation of the acceleration coefficient κ. This empirical coefficient may vary with ship model. Therefore, more benchmark data for various ship models are demanded, in order to establish a database to estimate suitable values of κ.
6 REFERENCES
Bunnik, T., 1999. Seakeeping calculations for ships, taking into account the non-linear steady waves, PhD thesis. Delft University of Technology, The Netherlands.
De Loor, A., Van Der Hout, J., Weiler, O.M., Kortlever, W.C.D., 2013. The use and validation of OpenFOAM to determine the lateral and longitudinal forces exerted on a vessel in the lock and in the lock approach, 3rd International Conference on Ship Manoeuvring in Shallow and Confined Water, Ghent, Belgium.
Henn, R., 2013. Real-time simulation of ships manoeuvring in locks, 3rd International Conference on Ship Manoeuvring in Shallow and Confined Water, Ghent, Belgium.
Kim, Y., Yue, D.K.P., Connell, B.S.H., 2005. Numerical dispersion and damping on steady waves with forward speed. Applied Ocean Research 27 (2), 107-125.
Lindberg, O., Glimberg, S.L., Bingham, H.B., Engsig-Karup, A.P., Schjeldahl, P.J., 2013. Real-Time Simulation of Ship-Structure and Ship-Ship Interaction, 3rd International Conference on Ship Manoeuvring in Shallow and Confined Water, Ghent, Belgium.
Meng, Q., Wan, D., 2016. URANS simulations of complex flows around a ship entering a lock with different speeds. International Journal of Offshore and Polar Engineering 26 (2), 161-168.
-60 -50 -40 -30 -20 -10 0
Si
nkage
(m
m
) X (m)
-30 -25 -20 -15 -10 -5 0
5 6 7 8 9 10 11 12 13 14 15
F1
(N
)
X (m)
t = te
t = tc
Under keel clearance (d/T=1.2)
[image:9.595.74.279.227.462.2]Schultz, M.P., 2007. Effects of coating roughness and biofouling on ship resistance and powering. Biofouling 23 (5-6), 331-341.
Toxopeus, S., Bhawsinka, K., 2016. Calculation of Hydrodynamic Interaction Forces on A Ship Entering A Lock Using CFD 4th International Conference on Ship Manoeuvring in Shallow and Confined Water, Hamburg, Germany.
Vantorre, M., Delefortrie, G., Mostaert, F., 2012. Behaviour of ships approaching and leaving locks: Open model test data for validation purposes. Version 3_0. WL Rapporten, WL2012R815_08e. Flanders Hydraulics Research and Ghent University - Division of Maritime Technology: Antwerp, Belgium.
Vergote, T., Eloot, K., Vantorre, M., Verwillingen, J., 2013. Hydrodynamics of a ship while entering a lock, 3rd
International Conference on Ship Manoeuvring in Shallow and Confined Water, Ghent, Belgium.
Vrijburcht, A., 1988. Calculations of wave height and ship speed when entering a lock. Delft Hydraulics Publication
Wang, H.-Z., Zou, Z.-J., 2014. Numerical study on hydrodynamic interaction between a berthed ship and a ship passing through a lock. Ocean Engineering 88 (0), 409-425.
Yuan, Z.-M., Incecik, A., Jia, L., 2014. A new radiation condition for ships travelling with very low forward speed. Ocean Engineering 88, 298-309.
Yuan, Z.M., Incecik, A., 2016. Investigation of ship-bank, ship-bottom and ship-ship interactions by using potential flow method, 4th International Conference on Ship Manoeuvring in Shallow and Confined Water, Hamburg, Germany.
7 AUTHORS BIOGRAPHY