1
Sensitivity analysis of the dynamic response of an electronic fuel injector
regarding fuel properties and operating conditions
Nao Hu1, 2, *, Jianguo Yang1, 3, Peilin Zhou2
1. School of Energy and Power Engineering, Wuhan University of Technology, 430063, Wuhan, PRC;
2. Department of Naval Architecture, Ocean and Marine Engineering, University of Strathclyde, G4 0LZ, Glasgow, UK;
3. Key Laboratory of Marine Power Engineering &Technology, Ministry of Communications, 430063, Wuhan, PRC;
*. Corresponding author.
1
Abstract: The effects of fuel properties, such as its bulk modulus, density and viscosity, on the 2
injector dynamic response (needle valve opening/closing delay and needle valve 3
opening/closing time) were investigated individually. Firstly, an electronic fuel injector model 4
was built and validated by injection rate and injection mass at three different rail pressures and 5
three different activation times. Secondly, a DOE (design of experiment) model was built and 6
the Uniform Latin Hypercube (ULH) design method was applied to study the influences of the 7
fuel properties on the injector dynamic response from a statistical point of view. The effects of 8
the fuel properties were compared by using a SS-ANOVA (smoothing spline analysis of 9
variance) method at both a low and a high rail pressure. The bulk modulus was found to play 10
a dominant role in influencing the valve opening/closing delay at the low rail pressure. 11
However, at the high rail pressure, the effects of the viscosity are prominent, while the effects 12
2
of the bulk modulus and the density are negligible. Additionally, how these fuel properties 13
affect the dynamic response were reported by RSM (Response Surface Method) function charts, 14
and the details of the pressure differences and needle valve movements were also disclosed. 15
Key words: electronic fuel injector; fuel properties; dynamic response; DOE 16
Nomenclature
1D one dimensional ULH Uniform Latin Hypercube
AC accumulation chamber v pressure wave propagation
speed Ab_Visc absolute viscosity
B bulk modulus Greek symbols
Bulk_M bulk modulus µ absolute viscosity
CC control chamber density
Cf friction coefficient τ delay
D pipe diameter
Dens density Units
DOE design of experiments cP centipoise
HPCR high pressure common rail K Kelvin
L pipe length kg/mm3 kilograms per cubic
millimetre
n levels m metre
NN neural networks mg/st milligram per stroke
Re Reynolds number MPa mega Pascal
RSM response surface method ms millisecond
s field N Newton
SS-ANOVA smoothing spline analysis of variance
algorithm Pa·s Pascal second
T time constant
3
1. Introduction
18
Electronic fuel injectors play an indispensable role in HPCR fuel injection systems and interest 19
numerous researchers to improve their performance. A lot of work has been undertaken in the 20
nozzle area, such as the nozzle structure types [1-3], the hole numbers and arrangements [4-7] 21
and the internal cavitation [8-11] of orifices. They have been thoroughly studied because they 22
have a direct effect on the fuel injection and atomisation. The spray characteristics [12-14], the 23
penetration [15-17] and the lift-off length [18,19] have also been investigated by experiment 24
or simulation in many studies. With the continual focus on the emissions of diesel engines, the 25
use of different alternative fuels has come into the sight of researchers [20]. The differences in 26
fuels lie in their properties [21], such as the density, viscosity and bulk modulus. Fuel properties 27
significantly affect the spray characteristics of a fuel injector, as were studied by Dernotte et 28
al. [22] and Payri et al. [23]. In addition, fuel properties change in vast ranges of different 29
pressures and temperatures, as were revealed by Salvador et al. [24] and Desantes et al. [25]. 30
The multi-injection performance of a solenoid injector was evaluated by Salvador et al. [26] 31
by using a standard diesel fuel and a biodiesel fuel. The biodiesel fuel was identified as have a 32
larger valve opening delay and valve opening time due to it have a larger viscosity. This implies 33
that the fuel properties may have an effect on the dynamic response of a fuel injector. However, 34
to date, only a few studies have found considered the effects of fuel properties on the dynamic 35
response of electronic fuel injectors. Han et al. [27] experimentally investigated the injection 36
process of three fatty acid esters on an HPCR system. He pointed out that fatty acid esters have 37
larger injection delays and smoother rising slopes of the injection rate than diesel fuel. They 38
also indicated that a reduced injection delay, along with a prolonged injection duration, was 39
4
fuel temperature on the injection dynamics (stationary mass flow rate, injection delay, and 41
valve opening/closing slope of the mass flow rate) of a ballistic injector, with special attention 42
paid to the needle valve opening and closing stages. They indicated that the temperature had a 43
huge influence on the valve opening delay. In a further study to extend insights into the injector 44
dynamics, Payri et al. [29] developed a one-dimensional model and paid special attentions to 45
the pressure drop in the control chamber, the viscous friction and the needle lifts. These studies 46
investigated the injection dynamic with different fuels or different fuel temperatures and 47
pressures, yet the impact of each fuel property on the injector dynamic response is still not 48
clearly identified. Boudy et al. [30] investigated the influence of the properties of a biodiesel 49
fuel on the injection process; in this study, the fuel density, bulk modulus and absolute viscosity 50
were examined individually in both single- and triple-injection situations. He pointed out that 51
density is one of the most influential fuel properties on the injection process. Han et al. [31] 52
investigated the isolated effect of the fuel density, viscosity and bulk modulus on the injection 53
mass and pressure propagation waves under split injection strategy conditions. They indicated 54
that the fuel density and bulk modulus have a larger impact than the viscosity on the injection 55
mass and pressure propagation. However, in these studies, the fuel properties varied only 56
slightly, and the dynamic response, such as the needle valve opening/closing delay and 57
opening/closing time, was not in their interests. 58
One-dimensional (1D) models are efficient and practical for predicting the performance of 59
electronic fuel injectors, and have been adopted by many studies. For example, a 1D model of 60
a solenoid-driven common rail ballistic injector was built by Payri et al. [32] to study the 61
influences of the inlet fuel temperature on the injection rate. Ando et al. [33] investigated the 62
magnetic aftereffect on the dynamic response of a fuel injector by building a simple and high 63
5
maximum activation current, which generated a smaller magnetic force than a higher maximum 65
activation current. Another 1D model was built by Seykens et al. [34] to investigate the 66
elasticity and nonlinearities of the injector needle valve. Additionally, 1D hydraulic models 67
were also established by Han et al. [31] and Rahim et al. [35]. The detailed modelling of fuel 68
injectors was demonstrated by Bianchi et al. [36], Payri et al. [32, 37] and Salvador et al. [38]. 69
In this paper, the effects of three fuel properties (the fuel density, bulk modulus and absolute 70
viscosity) on the valve opening/closing delay and the valve opening/closing time were carefully 71
investigated. Firstly, an electronic fuel injector model was built according to Payri et al. [37] 72
and completely validated by the experimental data disclosed in that article. Then, this validated 73
injector model was included in a DOE model, where a Uniform Latin Hypercube method was 74
adopted. Then, the effects of these fuel properties on the injector dynamic response were 75
compared and shown by RSM function charts from a statistical point of view, in which an SS-76
ANOVA method was adopted. 77
DOE is a systematic method for building a relationship between the input factors and output 78
factors of a process. A great deal of information can be obtained through a reduced number of 79
DOE simulations; therefore, it is effective to investigate the influences of individual variables 80
on the response. In DOE, “factors” refer to design variables, and “level” refers to a specific 81
value assigned to a factor. A DOE method creates a number of design points, which is a 82
variation in the selected model’s parameters [39]. 83
The ULH is one of the most commonly used DOE methods. In it, the design space of each 84
factor or design parameter is divided into n uniform levels. On each level of every factor, only 85
one design point is placed. For each factor, n!permutations of the n levels are possible. The 86
6
randomly chosen permutation of the n levels. For a row of the design matrix, nk combinations 88
are possible and have an equal chance of occurring. As the matrix is generated randomly, a 89
correlation between the columns may exist [40]. 90
The RSM is frequently used as a tool for building an approximation model based on the data 91
generated through DOE [41]. Several methods can be adopted to build this model, such as 92
polynomials, SS-ANOVA, NN, k-nearest, etc. SS-ANOVA is a statistical modelling algorithm 93
based on a function decomposition similar to the classical analysis of variance (ANOVA) 94
decomposition and the associated notions of main effect and interaction. It belongs to the 95
family of nonparametric or semi-parametric models and shows some peculiarities such as the 96
interpretability of the results, which distinguishes from the classical set of standard parametric 97
models (polynomial models, etc.). It is suitable for both univariate and multivariate 98
modelling/regression problems [42]. The SS-ANOVA [43] was adopted here for data analysis. 99
2. The injector model and its validation
100
The injector model can be built either by a set of ordinary differential equations or some 101
advanced tools, i.e., Hydsim and AMESim software. Here, the fuel injector model was built in 102
AMEsim software, as shown in Fig. 1. The model consisted of three different parts: the injector 103
holder, the electro-valve and the nozzle. Each of its internal elements were geometrically 104
characterised by using a silicone moulding technique [44] together with Scanning Electron 105
Microscopy (SEM) images. The silicone moulding technique has been proven to be an accurate 106
and useful tool for obtaining the geometry of different components. In addition, the hydraulic 107
characteristic of some most important orifices, i.e. the control oil inlet/outlet orifices, and the 108
nozzle orifices, were tested in purpose-made test rigs [37, 38]. In this model, some assumptions 109
7
properties were assumed to be constant along the injector and equal to those at the injector inlet 111
[32]; (2) the pressure feeding the model is constant; therefore, it ignores the pressure 112
fluctuations caused by the cyclical oil supply from the high-pressure pumps. 113
[image:7.595.72.348.184.700.2]114
8
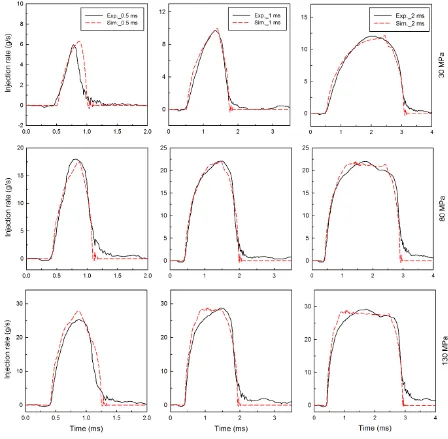
The model was validated by the experimental injection rate and injection quantities of 30 MPa, 116
80 MPa and 130 MPa rail pressures. Three different activation times, i.e., 0.5 ms, 1 ms and 2 117
ms, were applied. The comparisons of the injection rate and the injection quantity are shown 118
in Fig. 2 and Fig. 3 respectively. Detailed values of the injection quantity are shown in Table 119
1. From Fig. 2, the simulation injection rates show an identical tendency at the end of needle 120
valve closing are much lower than the experimental results. This can be attributed to the elastic 121
differences in the material between an injector model and an authentic fuel injector. The 122
authentic fuel injector has an elastic body. Thus, when the injector is deactivated, the needle 123
valve moves back to its original place and hits on the seat. The needle valve bounces back 124
several times before it closes completely, which results in a small fuel injection rate in the 125
experimental results. In Fig. 3,it can be seen that there is a small difference between the 126
simulation results and experimental results, which becomes larger with an increase in the rail 127
pressure. This is because a high rail pressure leads to a larger flow speed. When the cross-128
section area of the nozzle orifice is the same, a larger flow speed results in a larger injection 129
quantity. However, these tiny differences in the injection rate and injection quantity can hardly 130
have an impact on the injector dynamic response (opening/closing delay and opening/closing 131
time), which are mainly decided by the injection rate slopes. Fig. 2 indicates that the injection 132
rate slopes in all the sub-figures present a highly accurate reproduction of the experimental 133
injection rate. Therefore, the injector model is precise enough and can be used for further study. 134
For the detailed parameters of the injector model and the experimental data, refer to Payri et al. 135
9 137
10 139
Fig. 3 Comparisons of the injection quantity under varies activation times and rail pressures 140
Table 1 Experimental and simulation injection quantity 141
Pressure 30 MPa 80 MPa 130 MPa
Activate time Exp., mg/st Sim., mg/st Exp., mg/st Sim., mg/st Exp., mg/st Sim., mg/st
0.5 ms 1.5 2.0 8.1 8.0 14.1 16.5
1.0 ms 7.5 8.2 25.5 26.0 34.0 35.8
[image:10.595.74.478.502.608.2]11
3. Preparation
142
3.1. Definition of the injector dynamic response 143
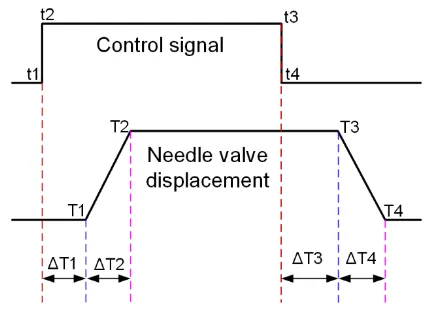
The injector dynamic response refers to the needle valve opening/closing delay and needle 144
valve opening/closing time, as shown in Fig. 4. The valve opening delay is defined asΔT1, 145
which is from the moment of t1 to the moment of T1; the valve opening time is defined as Δ 146
T2, which is from the moment of T1 to the moment of T2; the valve closing delay is defined 147
asΔT3, which is from the moment of t3 to the moment of T3; and the valve closing time is 148
defined asΔT4, which is from the moment of T3 to the moment of T4. 149
150
t1: the control signal initiates; t2: the control signal reaches its maximum amplitude; t3: the control signal begins 151
to de-activate; t4: the control signal has fully disappeared; T1: the needle valve starts to open; T2: the needle valve 152
[image:11.595.67.284.383.539.2]has reached its maximum displacement; T3: the needle valve begins to close; T4: the needle valve has fully closed. 153
Fig. 4 Schematic diagram of the definition of the dynamic response 154
The injector dynamic response will simply be represented by a limited delay integrator transfer 155
12
(1) 157
Where: T is the time constant; s is the field; τ is the delay. 158
3.2. DOE model 159
A DOE model was built within the modeFRONTIER software for investigating the effects of 160
fuel properties on the dynamic response, as shown in Fig. 5. Firstly, a uniform Latin hypercube 161
method was adopted in the DOE type for generating DOE designs, totally 1000 designs were 162
generated. Then, the fuel injector model was included in the AMESim node. The control signal 163
and the needle valve displacements generated by the fuel injector model were firstly written 164
into a text file, and to do this, appropriate writing and reading rules needed to be specified. The 165
text file is read by the MATLAB code, where the control signal opening/closing moments (t1, 166
t2, t3 and t4) and the needle valve opening/closing moments (T1, T2, T3 and T4) are calculated 167
[45]. Therefore, the valve opening/closing delay and the valve opening/closing time can be 168
obtained. The simulation takes about 3 hours on an 8-core Intel i7-4790 CPU @ 3.60 GHz 169
13 171
1: DOE designs generating; 2: DOE type selection; 3: Input parameters; 4: Fuel injector model; 5: Transfer the 172
control signal and needle valve displacement data synchronously; 6: Read the control signal and needle valve 173
displacement data from files respectively; 7: MATLAB codes; 8: Calculation of the valve opening/closing delay; 174
[image:13.595.74.523.71.312.2]9: calculation of the valve opening/closing time; 10: Outputs. 175
Fig. 5 DOE model 176
3.3. Boundaries and resolutions 177
The boundaries of the three fuel properties derive from the Figure 2 of the reference [24]. In 178
that figure, the fuel properties of a stand winter diesel fuel are shown for a range of 0.1-300 179
MPa in pressure and 300-400 K in temperature. In the paper, the boundaries of a specific 180
pressure are set according to the minimum and the maximum values when the temperature 181
changes. Totally two pressures, including a low rail pressure (40 MPa) and a high rail pressure 182
(200 MPa) were applied. The details of the boundaries are shown in Table 2. 183
14
Input parameter 40 MPa 200 MPa Step
Dens, kg/mm3 764-848 860-920 2
Bulk_M, MPa 1150-1950 2750-3550 20
Ab_Visc, cP 0.1-5.9 2-46 0.2 for 40 MPa,
0.5 for 200 MPa
4. Results and discussion
185
4.1. Sensitivity analysis 186
The sensitivity of the three fuel properties on the dynamic response were compared at both the 187
low rail pressure and at high rail pressure, as shown in the left part and right part of Fig. 6, 188
respectively. They were examined and obtained by using a first order SS-ANOVA algorithm. 189
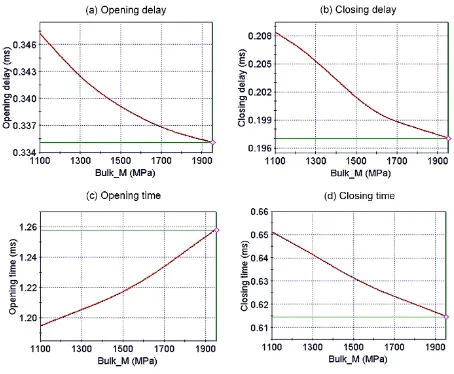
From Fig. 6 (a) and (b), it can be seen that the bulk modulus plays a dominant role in 190
influencing the valve opening/closing delay at the low rail pressure. Interestingly, both the 191
density and the bulk modulus have an dominant effect on the valve opening/closing time; the 192
effects of the former are slightly larger than the latter, as shown in Fig. 6 (c) and (d). The bulk 193
modulus affects the fluid’s incompressibility. A large bulk modulus indicates that a larger 194
pressure is needed to decrease the volume of a fluid. Therefore, a high incompressibility factor 195
is provided by a fuel with a large bulk modulus. The fuel’s incompressibility is one of the 196
factors that affects the pressure wave’s propagation speed and amplitude. Since the needle 197
valve and the solenoid valve are hydraulic connected. The effects of bulk modulus are 198
eventually reflected in the injector dynamic response. Density has an impact on the inertia 199
resistance and on the pressure wave propagation speed. Therefore, the density also profoundly 200
affects the dynamic response. The relationship of the bulk modulus and density with the speed 201
15
B v
(2) 203
Where, v is the speed of sound in the fluid; B is the bulk modulus of the fluid; and is the 204
density of the fluid. 205
The right part of Fig. 6 indicates that the effects of the absolute viscosity and the bulk modulus 206
are influential on the dynamic response of the injector at the high pressure, and the former plays 207
a dominant role in the valve opening/closing time. This is because viscosity drastically 208
increases at high pressures. Viscosity is related to the friction force, which impedes the 209
movements of the needle valve. Since the fuel oil in the control chamber flows in a laminar 210
form. The pressure loss is proportional to the friction coefficient, fluid density and fluid velocity, 211
as shown in equation (3) [30]: 212 2 2 f L u P C D
(3) 213
Where, Cfis the friction coefficient; is the fluid density, kg/m^3; uis the fluid velocity,
214
m/s;
L
is the pipe length, m; Dis the pipe diameter, m. 215The friction coefficient of a fluid flow in laminar conditions can be calculated as: 216 64 64 f e C R uD
(4) 217
Where, is the absolute viscosity, Pa·s; Reis the Reynolds number [46, 30].
16
From (4), it can be seen that the friction coefficient is proportional to the absolute viscosity. 219
Therefore, the absolute viscosity is also an influential factor and is significant to the injector 220
17 222
Fig. 6 Sensitivity of fuel properties on the injector dynamic response. (a) opening delay at 40 MPa rail pressure; 223
(b) closing delay at 40 MPa rail pressure; (c) opening time at 40 MPa rail pressure; (d) closing time at 40 MPa 224
(a) Opening delay
(b) Closing delay
(c) Opening time
(d) Closing time
(e) Opening delay
(f) Closing delay
(g) Opening time
(h) Closing time
18
rail pressure; (e) opening delay at 200 MPa rail pressure; (f) closing delay at 200 MPa rail pressure; (g) opening 225
time at 200 MPa rail pressure; (h) closing time at 200 MPa rail pressure. 226
The effects of the bulk modulus, density and absolute viscosity on the dynamic response are 227
shown in Fig. 8, Fig. 14 and Fig. 19 respectively. They were generated by the RSM function, 228
with only one factor changing at a time. 229
4.2. Effects of the bulk modulus 230
The trends of the effects of the bulk modulus are identical at both the low and the high rail 231
pressures, as are the effects of the fuel density. Since the bulk modulus and the density were 232
influential at the low pressure, only those effects are presented, as shown in Fig. 8, in which 233
the effects are shown as red lines. 234
It is well known that the valve opening time and the valve closing time depend on the pressure 235
difference between the control chamber and the accumulation chamber. Therefore, the 236
pressures in the control chamber and the accumulation chamber are shown in Fig. 9, and the 237
details of Section A and Section B are reported in Fig. 10 and Fig. 11, respectively. In these 238
figures, only three different values of the bulk modulus were reported in order to get a clear 239
view of the differences in the pressures. The pressures in the control chamber and the 240
accumulation chamber were drawn in thick lines and in thin lines respectively. The same colour 241
in a figure indicates the same value of factors. The above rules also apply to Fig. 14, Fig. 15, 242
Fig. 16, Fig. 19, Fig. 20 and Fig. 21. 243
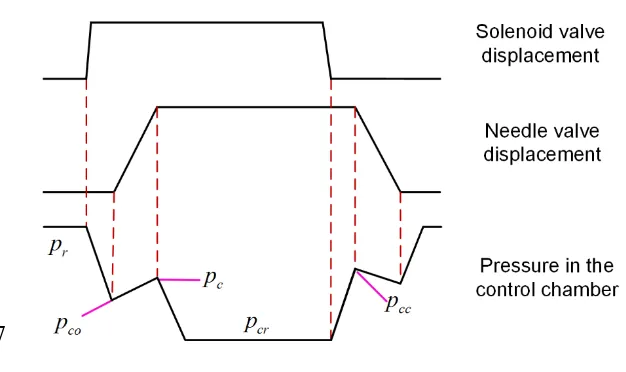
In order to obtain a better understanding of the pressure fluctuation in the control chamber. A 244
19
was investigated. This is presented along with the displacements of the solenoid valve and the 246
needle valve opening/closing, as shown in Fig. 7. The pressure in the control chamber is 247
identical to the rail pressure pr before the solenoid valve is activated; when it is activated, it 248
leads to a continual pressure drop in the control chamber. When the pressure decreases to the 249
critical pressure pco, it triggers the needle valve to open. During this process, the pressure in 250
the control chamber increases slightly. However, the pressure drops again to a lower and steady 251
pressure when the needle valve and the solenoid valve are both fully opened. When the solenoid 252
valve is deactivated and fully closed, the pressure in the control chamber is regaining the rail 253
pressure to push the needle valve to close. During this period of time, the pressure in the control 254
chamber decreases slightly and then rockets up to the level of the rail pressure once the needle 255
valve is completely closed. 256
[image:19.595.51.364.392.578.2]257
Fig. 7 Pressure change in the control chamber 258
From Fig. 8 (a) and (b), it can be seen that both the valve opening delay and the valve closing 259
delay decrease with an increase in the bulk modulus. From equation(2), it can be deduced that 260
the speed of sound through the fluid increases with an increase in the bulk modulus. A large 261
20
fluctuation. Therefore, the pressure in the control chamber drops faster when the solenoid valve 263
is activated than in a fluid with a small bulk modulus, as shown in Fig. 10; the fast pressure 264
wave propagation also results in a faster pressure rise when the solenoid is deactivated, as 265
shown in Fig. 11. In these conditions, a small valve opening delay and valve closing delay were 266
seen in the large bulk modulus case. In addition, Fig. 10 also indicates that the advanced 267
pressure fluctuation leads to a lower critical opening pressure pco, which would result in a larger 268
pressure difference at the early stage of the needle valve opening. As is stated above, a large 269
pressure difference is beneficial for a small valve opening delay; however, the large pressure 270
difference changed to a small one at the later stage of the needle valve opening, as shown in 271
the middle part of Fig. 9. A small pressure difference indicates a small force difference, which 272
provides a small net force to push the needle valve upwards when the solenoid is activated; this 273
leads to a slow needle movement, and thus a large valve opening time. In general, a large valve 274
opening time is due to a large bulk modulus, as shown in Fig. 8 (c). However, the small pressure 275
difference provides less resistance to the needle valve movements when the solenoid is 276
deactivated. Thus, a small valve closing time is seen, as shown in Fig. 8 (d). The needle valve 277
displacements under different bulk moduli are shown in Fig. 12. The needle valve opens earlier 278
but reaches its maximum position later in cases with a larger bulk modulus, as opposed to those 279
with a small bulk modulus. However, the needle valve closes and moves back to its original 280
21 282
22 284
Fig. 9 Pressure in the control chamber and in the accumulation chamber at the low rail pressure 285
286
[image:22.595.66.475.449.701.2]23 288
Fig. 11 Details of Section B of Fig. 9 289
[image:23.595.63.489.434.710.2]290
24 4.3. Effects of the fuel density
292
A high fuel density contributes to increasing the valve opening/closing delay and the valve 293
opening/closing time, as shown in Fig. 13. A high density indicates a large inertia; therefore, it 294
retards the pressure wave propagation (as shown in Fig. 15 and Fig. 16) and results in a large 295
resistance to the movements of the needle valve at both the valve opening and valve closing 296
stages (as shown in Fig. 17). The retarded pressure wave propagation leads to large hydraulic 297
delays (valve opening/closing delay), and the large inertia resistance is the main reason for the 298
increased valve opening/closing time in high-density conditions. 299
[image:24.595.69.524.341.715.2]300
25 302
Fig. 14 Pressure in the control chamber and in the accumulation chamber at the low rail pressure 303
304
[image:25.595.62.486.453.714.2]26 306
Fig. 16 Details of Section D in Fig. 14 307
308
[image:26.595.65.490.433.712.2]27 4.4. Effects of the viscosity
310
At the high rail pressure, the viscosity varies over a much bigger range with a change in 311
temperature, than at the low rail pressure. A high viscosity suppresses the amplitude of the 312
pressure wave and leads to a quick dampening rate [30]. In addition, from equations (3) and 313
(4), it can be inferred that a high viscosity results in a large pressure loss in the control chamber. 314
A quicker pressure wave dampening rate means the pressure in the control chamber reaches 315
the critical valve opening pressure in a shorter time when the solenoid is activated, as shown 316
in Fig. 20. Therefore, a high fuel viscosity results in a small valve opening delay, as shown in 317
Fig. 18 (a). A large pressure loss in the control chamber leads to a slightly lower steady pressure 318
when the needle valve is fully opened, as shown in Fig. 19. This lower steady pressure also 319
means that a larger pressure difference exists between the control chamber and the 320
accumulation chamber. As stated previously, the pressure difference plays a dominant role in 321
the valve opening and valve closing times. Although the friction force increases with the 322
increase in viscosity, the friction force is still not comparable to the force generated by the 323
pressure difference, as shown in Fig. 22. Therefore, a high viscosity generates a large pressure 324
difference, which accelerates the needle movement to achieve a short valve opening time at the 325
needle valve opening stage, and slows down the needle action when it is returning to its seat, 326
which results in a large valve closing time, as shown in Fig. 18 (c) and (d). Additionally, the 327
slightly lower steady pressure indicates that it takes a longer time to restore the critical valve 328
closing pressure. Therefore, a larger valve closing delay is seen, as shown in Fig. 18 (b). 329
28 331
29 333
Fig. 19 Pressure in the control chamber and in the accumulation chamber at the high rail pressure 334
335
[image:29.595.68.490.420.690.2]30 337
Fig. 21 Details of Section F in Fig. 19 338
[image:30.595.71.491.434.699.2]339
31 341
Fig. 23 Needle valve displacements under different absolute viscosity conditions 342
5. Conclusions
343
The effects of fuel properties (bulk modulus, density and absolute viscosity) on the injector 344
valve opening/closing delay and valve opening/closing time were investigated individually. A 345
fuel injector model was built and validated by injection rate and injection mass at three different 346
rail pressures. Then, a DOE model was built in modeFRONTIER software to study the effects 347
of the fuel properties on the injector dynamic response from a statistical point of view. The 348
effects of these properties were compared using an SS-ANOVA at both the low and high rail 349
pressures. And then reported by RSM function charts based on the DOE data. In addition, the 350
details of the pressure differences and needle valve movements were also presented. The main 351
32
(1) The bulk modulus plays a dominant role in influencing the valve opening/closing delay at 353
the low rail pressure. 354
(2) At the high pressure, however, the effects of the absolute viscosity are dominant, while the 355
effects of the bulk modulus and the density are negligible. 356
(3) Both the valve opening delay and the valve closing delay decrease with an increase in the 357
bulk modulus. A large valve opening time and a small valve closing time are the result of a 358
large bulk modulus. 359
(4) A high fuel density results in an increase in the valve opening/closing delay and the valve 360
opening/closing time, and vice versa. 361
(5) A high fuel viscosity results in a small valve opening delay and a large valve closing delay. 362
In addition, it generates a large pressure difference, which accelerates the needle movement to 363
achieve a short valve opening time, and slows down the needle valve movement when it is 364
returning to its seat, to get a large valve closing time. 365
Acknowledgements
366
The authors are grateful to the Department of Naval Architecture, Ocean and Marine 367
Engineering of the University of Strathclyde for its calculation support during the project. 368
Funding: This work was supported by the project ‘Engineering Development of a Medium-369
33
2)’ from China and the project ‘An Investigation into the Characteristics of High-pressure 371
Common Rail Injection System’ from Lloyds Register of Shipping in the UK. 372
References
373
[1] Benajes J, Pastor JV, Payri R, Plazas AH. Analysis of the influence of diesel nozzle geometry in the injection rate characteristics. J Fluids Eng. 2004; 126: 63-71.
[2] Han JS, Lu PH, Xie XB, Lai MC, Henein NA. Investigation of diesel spray primary breakup and development for different nozzle geometries. SAE Paper 2002; 2002-01-2775.
[3] Payri R, Garcia JM, Salvador FJ, Gimeno J. Using spray momentum flux measurements to understand the influence of diesel nozzle geometry on spray characteristics. Fuel 2005; 84: 551-561.
[4] Lahane S, Subramanian KA. Impact of nozzle holes configuration on fuel spray, wall impingement and NOx emission of a diesel engine for biodiesel-diesel blend (B20). Applied Thermal Engineering 2014; 64: 307-314.
34
[6] Moon S, Gao Y, Park S, Wang J, Kurimoto N, Nishijima Y. Effect of the number and position of nozzle holes on in- and near-nozzle dynamic characteristics of diesel injection. Fuel 2015; 150: 112-122.
[7] He Z, Zhong W, Wang Q, Jiang Z, Fu Y. An investigation of transient nature of the cavitating flow in injector nozzles. Applied Thermal Engineering 2013; 54: 56-64.
[8] Payri F, Payri R, Salvador FJ, Martínez-López J. A contribution to the understanding of cavitation effects in Diesel injector nozzles through a combined experimental and computational investigation. Computers & Fluids 2012; 58: 88-101.
[9] Qiu T, Song X, Lei Y, Liu X, An X, Lai M. Influence of inlet pressure on cavitation flow in diesel nozzle. Applied Thermal Engineering 2016; 109: 364-372.
[10] He Z, Zhong W, Wang Q, Jiang Z, Fu Y. An investigation of transient nature of the cavitating flow in injector Nozzles. Applied Thermal Engineering 2013; 54: 46-64.
[11] Molina S, Salvador FJ, Carreres M, Jaramillo. A computational investigation on the influence of the use of elliptical orifices on the inner nozzle flow and cavitation development in diesel injector nozzles. Energy Conversion and Management 2014; 79: 114-127.
[12] Payri R, Salvador SJ. Gimeno J, Zapata LD. Diesel nozzle geometry influence on spray liquid-phase fuel penetration in evaporative conditions. Fuel 2008; 87: 1165-1176.
35
[14] Wang B, Badawy T, Jiang Y, Xu H, Ghafourian A, Zhang X. Investigation of deposit effect on multi-hole injector spray characteristics and air/fuel mixing process. Fuel 2017; 191: 10-24.
[15] Payri R, Gimeno J, Bardi M, Plazas AH. Study liquid length penetration results obtained with a direct acting piezo electric injector. Applied Energy 2013; 106: 152-162.
[16] Payri R, Gimeno J, Viera JP, Plazas AH. Needle lift profile influence on the vapor phase penetration for a prototype diesel direct acting piezoelectric injector. Fuel 2013; 113: 257-265.
[17] Payri R, García-Oliver JM, Xuan T, Bardi M. A study on diesel spray tip penetration and radial expansion under reacting conditions. Applied Thermal Engineering 2015; 90: 619-629.
[18] Payri R, Viera JP, Pei YJ, Som S. Experimental and numerical study of lift-off length and ignition delay of a two-component diesel surrogate. Fuel 2015; 158: 957-967.
[19] Payri R, Salvador FJ, Manin J, Viera A. Diesel ignition delay and lift-off length through different methodologies using a multi-hole injector. Applied Energy 2016; 162: 541-550.
[20] Crookes RJ, Bob-Manuel KDH. RME or DME: A preferred alternative fuel option for future diesel engine operation. Energy Conversion and Management 2007, 48(11): 2971-2977.
36
[22] Dernotte J, Hespel C, Houillé S, Foucher F, Rousselle CM. Influence of fuel properties on the diesel injection process in nonvaporizing conditions. Atomization Sprays 2012; 22(6): 461-492.
[23] Payri R, Salvador FJ, Gimeno J, Bracho G. Effect of fuel properties on diesel spray development in extreme cold conditions. Proc Inst Mech Eng, Part D: J Automobile Eng 2008; 222: 1743-1753.
[ 24 ] Salvador FJ, De la Morena J, Martínez-López J, Jaramillo D. Assessment of compressibility effects on internal nozzle flow in diesel injectors at very high injection pressures. Energy Conversion and Management 2017, 132: 221-230.
[25] Desantes JM, Salvador FJ, Carreres M, Jaramillo D. Experimental characterization of the thermodynamic properties of diesel fuels over a wide range of pressures and temperatures. SAE Int J Fuels Lubricants 2015; 8(1): 190-199.
[26] Salvador FJ, Gimeno J, De la Morena J, Carreres M. Using one-dimensional modeling to analyze the influence of the use of biodiesels on the dynamic behavior of solenoid-operated injectors in common rail systems: Results of the simulations and discussion. Energy Conversion and Management 2012; 54: 122-132.
[27 ] Han D, Duan Y, Wang C, Lin H, Huang Z. Experimental study on injection characteristics of fatty acid esters on a diesel engine common rail system. Fuel 2014; 123: 19-25.
37
mass flow rate measurements and discussion. Energy Conversion and Management 2016; 114: 364-375.
[29] Payri R, Salvador FJ, Carreres M, De la Morena J. Fuel temperature influence on the performance of a last generation common-rail diesel ballistic injector. Part II: 1D model development, validation and analysis. Energy Conversion and Management 2016; 114: 376-391.
[30] Boudy F, Seers P. Impact of physical properties of biodiesel on the injection process in a common-rail direct injection system. Energy Conversion and Management 2009; 50: 2905-2912.
[31] Han D, Li K, Duan Y, Lin H, Huang Z. Numerical study on fuel physical effects on the split injection processeson a common rail injection system. Energy Conversion and Management 2017; 134: 47-58.
[32] Payri R, Salvador FJ, Carreres M, DelaMorena J. Fuel temperature influence on the performance of a last generation common-rail diesel ballistic injector. Part II: 1D model development, validation and analysis. Energy Conversion and Management 2016; 114: 376-391.
[33] Ando R, Koizumi M, Ishikawa T. Development of a simulation method for dynamic
characteristics of fuel injector. IEEE TRANSACTIONS ON MAGNETICS 2001; 37 (5):
38
[34] Seykens XLJ, Somers LMT, Baert RSG. Detailed modelling of common rail fuel injection process. J Middle Eur Construct Des Cars (MECCA) 2005; 3: 30-39.
[35] Rahim R, Mamat R, Taib MY, Abdullah AA. Influence of fuel temperature on diesel engine performance operating with biodiesel blend. J Mech Eng Sci. 2012; 2: 226-236.
[36] Bianchi GM, Falfari S, Pelloni P, Kong SC, Reitz RD. Numerical analysis of high-pressure
fast-response common rail injector dynamics. SAE TECHNICAL PAPER SERIES 2002;
2002-01-0213.
[ 37 ] Payri R, Salvador FJ, Martí-Aldaraví P, Martínez-López J. Using one-dimensional modelling to analyse the influence of the use of biodiesels on the dynamic behaviour of solenoid-operated injectors in common rail systems: Detailed injection system model. Energy Conversion and Management 2012, 54: 90-99.
[38] Salvador FJ, Plazas AH, Gimeno J, Carreres M. Complete modelling of a piezo actuator last-generation injector for diesel injection systems. International J of Engine Research 2014; 15 (1): 3-19.
[39] Taghavifar H, Jafarmadar S, Taghavifar H, Navid A. Application of DoE evaluation to introduce the optimum injection strategy-chamber geometry of diesel engine using surrogate epsilon-SVR. Applied Thermal Engineering 2016, 106: 56-66.
39
[41] Box GEP and Wilson KB. On the experimental attainment of optimum conditions (with discussion). Journal of the Royal Statistical Society Series B 1951; 13(1): 1-45.
[42] Rigoni E, Ricco L. Smoothing spline ANOVA for variable screening. ESTECO Technical
Report 2011-007.
[43] Ali OM, Mamat R, Najafi G, Yusaf T, Ardebili SMS. Optimization of biodiesel-diesel blended fuel properties and engine performance with ether additive using statistical analysis and response surface methods. Energies 2015; 8(12): 14136-14150.
[44] Macián V, Bermúdez V, Payri R, Gimeno J. New technique for determination of internal
geometry of a diesel nozzle with the use of silicone methodology. Exp Tech 2003; 27: 39-43.
[45] Hu N, Yang JG, Zhou PL, Hu Y. Study of the impact of structural parameters on the dynamic response of an electronic fuel injector. Energy Conversion and Management 2017; 136: 202-219.