Int. J. Electrochem. Sci., 6 (2011) 561 - 572
International Journal of
ELECTROCHEMICAL
SCIENCE
www.electrochemsci.org
The Influence of Ethoxylated Nonionic Surfactants on the
Potentiometric Determination of Anionic Surfactants
Milan Sak-Bosnar*, Mirela Samardžić, Olivera Galović
Department of Chemistry, Josip Juraj Strossmayer University of Osijek, F. Kuhača 20, HR-31000 Osijek, Croatia
*
E-mail: msbosnar@kemija.unios.hr
Received: 14 January 2011 / Accepted: 20 January 2011 / Published: 1 March 2011
A PVC-plasticized liquid-type anionic surfactant (AS)-responsive sensor, using 1,3-didecyl-2-methylimidazolium-tetraphenylborate (DMI-TPB) as the sensing element, has been utilized for the investigation of the influence of three ethoxylated nonionic surfactants (EONS), containing 8, 11 and 15 ethoxy (EO) groups, on the potentiometric determination of dodecyl sulfate (DS). The results demonstrate that the sensor slope (S) slowly decreased with increasing concentrations of EONS. The changes in the slope for the corresponding concentration change (DS:EONS ratios varied from 1:1 to 1:4) were 1.62, 5.11 and 6.28 mV for EONS containing 8, 11 and 15 EO groups, respectively. The constant potential term changes for the same EONS concentration change were 18.8, 22.3 and 39.5 mV, respectively. The linear response range became more narrow as the concentration of EONS increased, and increasing numbers of EO groups were found within the EONS molecule. There was a strong correlation between E and log aDSfor all of the DS:EONS ratios in the linear region of the sensor response. The EONS molecules significantly influenced the potentiometric titration of DS. The titration curves were seriously disturbed for EONS:DS molar ratios greater than 5 for EONS containing 8 EO groups, for ratios greater than 3 for EONS containing 11 EO groups and for ratios greater than 2 for EONS containing 15 EO groups.
Keywords: ion sensitive sensor, anionic surfactant, ethoxylated nonionic surfactant, potentiometric titration
1. INTRODUCTION
process control in industrial samples and contamination control in food products, the use of AS requires fast, simple, accurate and reliable analytical methods for the determination of surfactant concentrations. The standard procedure for determining the concentrations of AS is a two-phase titration 3]. This technique suffers from numerous drawbacks, including the use of hazardous organic solvents, the limitation of its application to strongly colored and turbid samples, numerous matrix interferences, the lack of automation possibilities, the visual end-point determination and that it is a time consuming method. Potentiometric titrations with ion-selective electrodes (ISEs) sensitive to AS overcome almost all of these disadvantages.
Among the first electrodes used for AS concentration determination were electrodes prepared using liquid ion exchangers dissolved in organic solvents [4, 5]. Their use was followed by AS-selective electrodes with better selectivity and a longer life time that were wire coated and based on ion-association complexes of quaternary ammonium cations and surfactant anions [6-8].
The use of different types of electrodes for surfactant analysis is reviewed in several excellent articles [9-11]. The use of surfactant-sensitive electrodes for the potentiometric determination of low concentrations of AS has also been described in several papers [12-17].
Nonionic surfactants (NS) rank second in total surfactant consumption. Anionic and nonionic surfactants together account for 90% of the total production of surfactants in the EU [18]. Because of their specific physicochemical properties, NS are used in many fields of research and technology as well as in consumer products such as laundry detergents, cleaning and dishwashing agents, and personal care products [19].
Mixed surfactant systems have the ability to provide better performance when compared to single surfactant systems. For example, mixed surfactant systems have been shown to improve detergents’ cleaning efficiency [20]. Most commercial products based on AS are used in combination with NS because of the incompatibility of AS with cationic surfactants [21, 22]. However, the presence of NS influences the potentiometric titration of AS [17].
In this paper, a PVC-plasticized liquid-type AS-responsive sensor, using 1,3-didecyl-2-methylimidazolium-tetraphenylborate (DMI-TPB) as the sensing element and bis(2-ethylhexyl)phthalate (DOP) as the plasticizer, has been utilized for the study of how ethoxylated nonionic surfactants (EONS) influence the potentiometric determination of anionic surfactants.
2. EXPERIMENTAL 2.1. Reagents and Materials
The sensor response characteristics were investigated using sodium dodecylsulfate (DS). A standard solution of 4 mM 1,3-didecyl-2-methylimidazolium chloride (DMIC) was used as the titrant. Both chemicals were purchased from Fluka (Switzerland).
Table 1. Overview of basic chemical information of the EONS investigated.
Surfactant investigated
Chemical name Mean Mr
declared
Mean number of EO groups
Genapol T 080 C16/C18-Fatty alcohol polyglycol ether 610 8
Genapol T 110 C16/C18-Fatty alcohol polyglycol ether 745 11
Genapol T 150 C16/C18-Fatty alcohol polyglycol ether 920 15
1,3-didecyl-2-methylimidazolium-tetraphenylborate (DMI-TPB), bis(2-ethylhexyl)phthalate (DOP) and high molecular weight poly(vinyl chloride) (PVC) were purchased from Fluka (Switzerland) and were used for the preparation of the sensor membrane.
2.2. Apparatus and Measurements
The all-purpose titrator 808 Titrando (Metrohm, Switzerland) combined with the Metrohm 806 Exchange unit (Metrohm, Switzerland) and controlled by Tiamo software was used as the dosing element to perform potentiometric titrations. During titrations and measurements, the solutions were magnetically stirred using an 801 Titration stand (Metrohm, Switzerland).
A Metrohm 780 pH meter, a 728 Stirrer, a Metrohm 765 Dosimat (all from Metrohm, Switzerland), in-house software and the DMI-TPB sensor were all used for the response measurements. A silver/silver (I) chloride electrode (Metrohm, Switzerland) was used as a reference.
2.3. Sensor
The DMI-TPB sensor contained a 1,3-didecyl-2-methyl-imidazolium-tetraphenylborate ion-exchange complex, which was used for the preparation of the PVC- based membrane plasticized with bis (2-ethylhexyl)phthalate (DOP). A detailed explanation for the preparation of the DMI-TPB ion-exchange complex has been described previously [16]. Sodium chloride at a concentration of 3 M was employed as the internal filling solution. A silver/silver (I) chloride reference electrode (Metrohm, Switzerland) with a 2 M sodium chloride electrolyte solution was used as a reference. The lifetime of the sensor was more than three months when used daily.
2.4. Procedure
The PVC-plasticized liquid membrane electrode and the external reference electrode were used for all potentiometric measurements.
distilled water. A calibration curve was constructed by plotting the potential E versus the logarithm of the DS activity. Activity coefficients were calculated according to the Debye-Hückel approximation.
The volume of solution used for titrations was 25 mL. The titrator was programmed to work in DET (Dynamic Equivalent point Titration) Mode with signal drift of 5 mV/min and an equilibrium time of 30 s. The wait time before the start of the titration was 90 s. All measurements and titrations were performed at room temperature using a magnetic stirrer and without ionic strength or pH adjustment.
3. RESULTS AND DISCUSSION 3.1. Response Characteristics
The influence of the three most frequently used EONS in detergent formulations (Table 1) on the response of the DMI-TPB sensor toward DS has been investigated. The electrode potential of the DMI-TPB sensor dipped in the solution of DS is given by the Nernst equation:
0
log DS
EE S a (1)
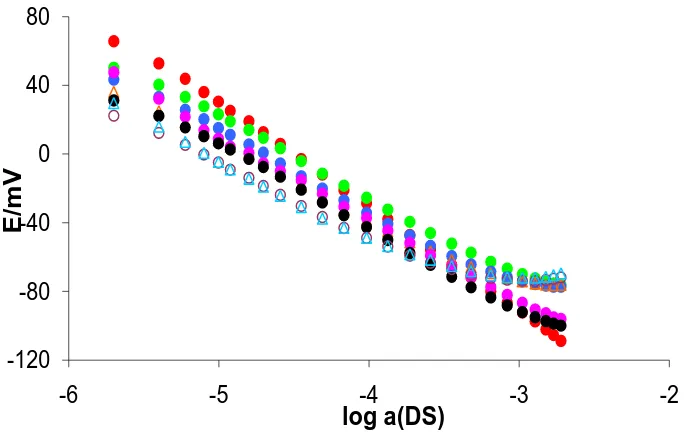
where Eo is the constant potential term, S is the sensor slope and aDSis the activity of DS. The response characteristics of a DMI-TPB surfactant sensor in solutions of DS alone and in a mixture with EONS of defined DS:EONS molar ratios are shown in Figures 1 - 3.
-120
-80 -40
0 40 80
-6 -5 -4 -3 -2
E
/m
V
log a(DS)
[image:4.596.128.477.473.695.2]
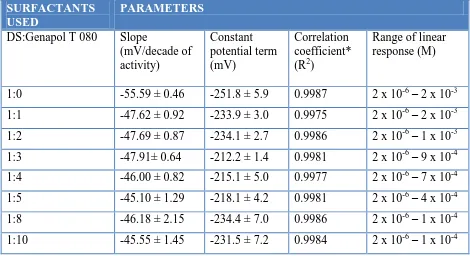
A statistical evaluation of the linear region of the sensor response in solutions of DS alone and in a mixture with Genapol T 080 with defined DS:Genapol T 080 molar ratios is given in Table 2.
Table 2. Statistics of the response characteristics of the DMI-TPB surfactant sensor in solutions of DS alone and in a mixture with Genapol T 080 with defined DS:Genapol T 080 molar ratios given together with 95% confidence limits.
SURFACTANTS USED
PARAMETERS
DS:Genapol T 080 Slope
(mV/decade of activity)
Constant potential term (mV)
Correlation coefficient* (R2)
Range of linear response (M)
1:0 -55.59 ± 0.46 -251.8 ± 5.9 0.9987 2 x 10⁻⁶ – 2 x 10⁻³ 1:1 -47.62 ± 0.92 -233.9 ± 3.0 0.9975 2 x 10⁻⁶ – 2 x 10⁻³ 1:2 -47.69 ± 0.87 -234.1 ± 2.7 0.9986 2 x 10⁻⁶ – 1 x 10⁻³ 1:3 -47.91± 0.64 -212.2 ± 1.4 0.9981 2 x 10⁻⁶ – 9 x 10⁻⁴ 1:4 -46.00 ± 0.82 -215.1 ± 5.0 0.9977 2 x 10⁻⁶ – 7 x 10⁻⁴ 1:5 -45.10 ± 1.29 -218.1 ± 4.2 0.9981 2 x 10⁻⁶ – 4 x 10⁻⁴ 1:8 -46.18 ± 2.15 -234.4 ± 7.0 0.9986 2 x 10⁻⁶ – 1 x 10⁻⁴ 1:10 -45.55 ± 1.45 -231.5 ± 7.2 0.9984 2 x 10⁻⁶ – 1 x 10⁻⁴ * average of 5 determinations
As shown in Fig.1 and Table 2, the slope (S) gradually decreased with increasing concentrations of Genapol T 080. In contrast, the constant potential term (Eo) gradually increased with increasing concentrations of Genapol T 080. The linear response range became narrower with increasing concentrations of Genapol T 080, which can be attributed to the increased micellization of DS and is clearly seen in Figure 1. The correlation coefficients for all the DS:Genapol T 080 ratios in the linear region of the sensor response were satisfactory.
[image:5.596.63.533.188.444.2]
Figure 2. Response characteristics of the DMI - TPB sensor toward DS in the presence of Genapol T 110 ( DS alone; DS:Genapol T 110 molar ratios of 1:1; 1:2; 1:3; 1:4; ∆ 1:5; 1:8; ∆ 1:10).
Table 3. Statistics of the response characteristics of the DMI-TPB surfactant sensor in solutions of DS alone and in a mixture with Genapol T 110 with defined DS:Genapol T 110 molar ratios given together with 95% confidence limits.
SURFACTANTS USED
PARAMETERS
DS:Genapol T 110 Slope /
(mV/decade of activity)
Constant potential term (mV)
Correlation coefficient* (R2)
Range of linear response (M)
[image:6.596.87.509.98.344.2] [image:6.596.61.539.488.744.2]
Figure 3. Response characteristics of the DMI - TPB sensor toward DS in the presence of Genapol T 150 ( DS alone; DS:Genapol T 150 molar ratios of 1:1; 1:2; 1:3; 1:4).
Table 4. Statistics of the response characteristics of the DMI-TPB surfactant sensor in solutions of DS alone and in a mixture with Genapol T 150 with defined DS:Genapol T 150 molar ratios given together with 95% confidence limits.
SURFACTANTS USED
PARAMETERS
DS:Genapol T 150 Slope / (mV/decade of activity)
Constant potential term (mV)
Correlation coefficient* (R2)
Range of linear response (M)
1:0 -55.59 ± 0.46 -251.8 ± 5.9 0.9987 2 x 10⁻⁶ – 2 x 10⁻³ 1:1 -47.73 ± 1.54 -248.5 ± 6.2 0.9985 2 x 10⁻⁶ – 7 x 10⁻⁴ 1:2 -44.82 ± 0.68 -230.7 ± 2.8 0.9982 2 x 10⁻⁶ – 4 x 10⁻⁴ 1:3 -43.13 ± 0.74 -220.2 ± 2.3 0.9981 2 x 10⁻⁶ – 2 x 10⁻⁴ 1:4 -41.45 ± 3.25 -209.0 ± 13.1 0.9976 2 x 10⁻⁶ – 1 x 10⁻⁴ * average of 5 determinations
[image:7.596.76.524.75.293.2] [image:7.596.60.534.424.619.2]
was observed. The linear response range was more narrow than that of either Genapol T 080 and Genapol T 110. The strong correlation between E and log aDS was again evidenced in the entire linear response region. The investigations of DS and Genapol T 150 mixtures were limited to their ratio of 1:4 because of the substantial decrease of the critical micelle concentration (CMC) of DS in the presence of nonionic surfactants. Strong micellization results with analytically useless titration curves were obtained in the mixtures with a higher content of Genapol T 150 (see below).
The activity coefficients were calculated according to the Davies equation. The slope values and correlation coefficients were calculated from the linear region of the calibration graph on the five series of measurements using linear regression analysis.
3.2. Potentiometric titration of DS in the presence of variable concentrations of different EONS
The EONS are often used in combination with anionic surfactants in liquid and powdered detergent formulations.
-260 -160 -60 40
0 2 4 Vt/mL 6 8 10
E
/m
V
-280 -240 -200 -160 -120
dE
/dV
[image:8.596.89.500.355.635.2]
The ethoxylated alcohols used in these investigations belong to a widely-used class of nonionic surfactants and may exhibit slightly anionic characteristics under certain circumstances. Therefore, their influence on the potentiometric titration of anionic surfactants was investigated.
Three EONS containing 8, 11 and 15 EO groups were added separately in different molar proportions to the titrated DS solution. The resulting titration curves for surfactants containing 8 EO groups (Genapol T 080) are shown in Figure 4. It can be seen that the presence of EONS influences the shape of the titration curves. As the concentration of the EONS increased, the inflection decreased, which disturbed the end-point detection. The titration curves were significantly disturbed for EONS:DS molar ratios greater than 5.
Figure 5. Titration curves and their first derivatives of the 2.0 mM DS mixture with various concentrations of Genapol T 110 using 4.0 mM DMIC as a titrant and a DMI-TPB sensor as the end-point detector ( DS alone; DS:Genapol T 110 molar ratios of 1:1; 1:2; 1:3; 1:4; 1:5;— DS; —1:1; —1:2; —1:3; —1:4; —1:5).
[image:9.596.82.506.248.634.2]
titration curves considerably more than the presence of Genapol T 080. The titration curves were significantly disturbed for EONS:DS molar ratios greater than 3.
Figure 6. Titration curves and their first derivatives of the 2.0 mM DS mixture with various concentrations of Genapol T 150 using 4.0 mM DMIC as a titrant and a DMI-TPB sensor as the end-point detector ( DS alone; DS:Genapol T 150 molar ratios of 1:1; 1:2; 1:3; 1:4; — DS; —1:1; —1:2; —1:3; —1:4).
Figure 5 shows the titration curves for surfactants containing 15 EO groups (Genapol T 150). The presence of Genapol T 150 influenced the shape of the titration curves considerably more than either the presence of Genapol T 080 or Genapol T 110. The titration curves were notably disturbed for EONS:DS molar ratios greater than 2.
[image:10.596.78.515.128.516.2]
significantly influences the shape of the titration curves much more than EONS with a lower EO content.
4. CONCLUSIONS
The influence of three EONS frequently used in detergent formulations on the response of a DMI-TPB sensor toward DS and to its potentiometric titration has been investigated. It can be concluded that the sensor slope (S) decreased with the increasing concentration of EONS while the constant potential term (Eo) increased. The linear response range became more narrow with increased concentrations of EONS, which can be attributed to the substantial decrease of the critical micelle concentration (CMC) of DS in the presence of nonionic surfactants. The correlation coefficients for all of the DS:EONS ratios in the linear region of the sensor response were satisfactory. The changes were more pronounced with increasing numbers of EO groups in the EONS molecule and with increasing concentrations of particular EONS. Additionally, the presence of EONS in solutions containing DS influences its potentiometric titration. The magnitude of this influence strongly depended on the number of EO groups in the EONS molecule and the concentration of the EONS in the system investigated. Strong micellization results with analytically useless titration curves were obtained in the mixtures with a higher content of EONS.
ACKNOWLEDGEMENTS
This work was financed by the Croatian Science Foundation and Saponia Chemical, Pharmaceutical and Foodstuff Industry, Osijek.
References
1. J. Sanchez, A. Beltran, J. Alonso, C. Jimenez and M. Del Valle, Anal. Chim. Acta, 382 (1999) 157.
2. G. O. Reznik, P. Vishwanath, M. A. Pynn, J. M. Sitnik, J. J. Todd, J. Wu, Y. Jiang, B. G. Keenan, A. B. Castle, R. F. Haskell, T. F. Smith, P. Somasundaran and K. A. Jarrell, App. Microbiol. Biotechnol., 86 (2010) 1387.
3. V. W. Reid, G. F. Longman and E. Heinerth, Tenside, 4 (1967) 292. 4. C. Gavach and P. Seta, Anal. Chim. Acta, 50 (1970) 407.
5. C. Gavach and C. Bertrand, Anal. Chim. Acta, 55 (1971) 385. 6. R. W. Cattral and H. Freiser, Anal. Chem., 43 (1971) 1905.
7. H. James, G. Carmack and H. Freiser, Anal. Chem., 44 (1972) 856. 8. T. Fujinaga, S. Okazaki and H. Freiser, Anal. Chem., 46 (1974) 1842. 9. B. J. Birch and R. N. Cockcroft, Ion sel. Electrode Rev., 4 (1981) 1.
10. M. Gerlache, J. M. Kauffmann, G. Quarin, J. C. Vire, G. A. Bryant and J. M. Talbot, Talanta, 43 (1996) 507.
11. J. Sanchez and M. Del Valle, Crit. Rev. Anal. Chem., 35 (2005) 15.
12. Lj. Zelenka, M. Sak-Bosnar, N. Marek and B. Kovacs, Anal. Lett., 22 (1989) 2791.
14. R. Matešić-Puač, M. Sak-Bosnar, M. Bilić and B. S. Grabarić, Sensors Actuators B, 106 (2005) 221.
15. M. Sak-Bosnar, R. Matešić-Puač, D. Madunić-Čačić and Z. Grabarić, Tenside Surf. Det., 43 (2006) 82.
16. D. Madunić-Čačić, M. Sak-Bosnar, R. Matešić-Puač and Z. Grabarić, Sensor Lett., 6 (2008) 339. 17. D. Madunić-Čačić, M. Sak-Bosnar, M. Samardžić and Z. Grabarić, Sensor Lett., 7 (2009) 50. 18. P. A. Lara-Martin, A. Gomez-Parra and E. Gonzalez-Mazo, J. Chromatogr. A, 1137 (2006) 188. 19. M. J. Schick, Nonionic surfactants: Physical chemistry, Marcel Dekker Inc., New York, 1987. 20. R. M. Hill, in: K. Ogino, M. Abe (Ed.), Mixed Surfactant Systems, Marcel Dekker Inc., New
York, 1993.
21. M. Samardžić, M. Sak-Bosnar and D. Madunić-Čačić, Talanta, 83 (2011) 789. 22. K. Kargosha, S. H. Ahmadi, M. Mansourian and J. Azad, Talanta, 75 (2008) 589.