This is a repository copy of
Local and Global Granular Mechanical Characteristics of
Grain–Structure Interactions
.
White Rose Research Online URL for this paper:
http://eprints.whiterose.ac.uk/126329/
Version: Accepted Version
Article:
Jahanger, ZK orcid.org/0000-0003-2869-9178, Sujatha, J and Antony, SJ
orcid.org/0000-0003-1761-6306 (2018) Local and Global Granular Mechanical
Characteristics of Grain–Structure Interactions. Indian Geotechnical Journal, 48 (4). pp.
753-767. ISSN 0971-9555
https://doi.org/10.1007/s40098-018-0295-5
© Indian Geotechnical Society 2018. This is an author produced version of a paper
published in Indian Geotechnical Journal. Uploaded in accordance with the publisher's
self-archiving policy. The final publication is available at Springer via
https://doi.org/10.1007/s40098-018-0295-5.
[email protected] https://eprints.whiterose.ac.uk/
Reuse
Items deposited in White Rose Research Online are protected by copyright, with all rights reserved unless indicated otherwise. They may be downloaded and/or printed for private study, or other acts as permitted by national copyright laws. The publisher or other rights holders may allow further reproduction and re-use of the full text version. This is indicated by the licence information on the White Rose Research Online record for the item.
Takedown
If you consider content in White Rose Research Online to be in breach of UK law, please notify us by
1
Local and global granular mechanical characteristics of grain-structure interactions
1
2
Abstract
40
The focus of this work is on systematically understanding the effects of packing density of the sand grains on both
41
the internal and bulk mechanical properties for strip footing interacting with granular soil. The studies are based
42
on particle image velocimetry (PIV) method, coupled with a high resolution imaging camera. This provides
43
valuable new insights on the evolution of slip planes at grain-scale under different fractions of the ultimate load.
44
Furthermore, the PIV based results are compared with Finite Element Method (FEM) simulations in which the
45
experimentally characterised parameters and constitutive behaviour are fed as an input, and a good level of
46
agreements are obtained. The reported results would serve to the practicing engineers, researchers and graduate
47
students in unravelling the mechanics of granular soil at both local and global levels when they interact with
48
structures. The outcomes would be beneficial not only to the geotechnical engineering community, but also to
49
related disciplines dealing with granular materials such as materials processing, minerals and space exploration.
50
51
KeywordsGranular mechanics, PIV, FEM, bearing capacity, grain-structure interaction
52
53
Introduction
54
55
Cohesionless sands comprise of discrete grains of varying size and packing density. Their mechanical behaviour
56
is different from that of conventional solid, liquid and gaseous state of matter [1]. Numerous researchers have
57
studied the micromechanical characteristics of granular materials using experiments, theoretical descriptions and
58
computer simulations [2]. From the micromechanical perspective [3], some studies have attributed the origin of
59
shear strength of granular media to the anisotropy of strong force chains [4-6]. Their dilation characteristics are
60
attributed to the displacement network of granular media [7].
61
In foundation engineering, ultimate bearing capacity (qult) and allowable settlement (S) are used as key design
62
parameters [8-9]. In sand, settlement controls the design criteria of footing [10-11] which is independent of the
63
loading rate [9]. Also, the settlement of footings could depend on their width for a given soil [11], but ultimate
64
bearing capacity of sand is less dependent on footing width (B) when less than 1m as reported by Terzaghi and
65
Peck [12]. In soil-structure interaction analysis [13], engineers use constant vertical displacement profiles for rigid
66
footings interacting with sand at the level of the footing. However, the settlement in sand could vary significantly
67
below the level of the footing-sand interface within the influence zone of depth (z) about 2-4 times the width of
68
3
along the footing central axis do not vary linearly with depth. However, detailed information on how the70
displacement field evolves within the sand bed under mechanical loading is still not well established. Historically,
71
bi-linear model (simple triangle approximation) is used to describe the variation of elastic displacement in sands
72
[14] and others use nonlinear variation [16]. At the micro scale, grain displacements are non-uniform [17].
73
However experimental results on the role of relative density of sand for all three major types, loose,
medium-74
dense and dense sand on their geomechanical characteristics using particle image velocimetry (PIV) is not yet
75
probed systematically. This is addressed here using two-dimensional particle image velocimetry (PIV). The
76
Dynamic Studio Software Platform (DSSP) helps to display the large amounts of PIV-based experimental data in
77
pictorial forms [18]. Recently PIV was applied to understand the flow properties of granular materials [19]. Here,
78
the authors focus on the local deformation and velocity fields and bulk strength for different relative densities of
79
sand when a strip shallow footing interacts with sand under quasi-static axial loading (P). Detailed experimental
80
characterisation of the sand material is made using a range of experiments. The aim is at first to compare the
81
variation of displacement fields measured in sand packing using PIV with FEM analysis. Thereafter, the variation
82
of fundamental mechanical features at both local and global scales are studied in detail using PIV for strip footing
83
interacting with sand packing of different relative densities in a systematic manner.
84
85
Digital Particle Image Velocimetry (DPIV) Analysis
86
87
DPIV pertains to the digital platform of Particle Image Velocimetry (PIV), is often used in the field of fluid
88
mechanics to track the motion of fluid flow using tracer particles [20]. It has been also used to study the
89
displacement and(/or) strain distribution in some cases of granular materials [21-22]. Recently, PIV has been
90
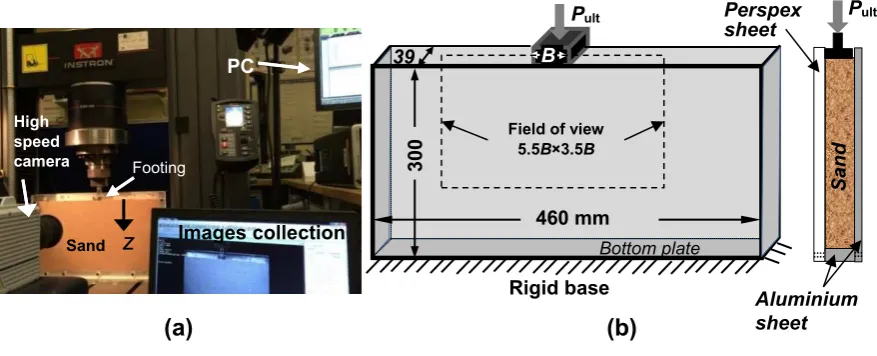
applied to get measurements of soil deformation in geotechnical engineering problems [21-25]. In this study,
91
DSSP is used to analyse the digital images acquired during test using PIV.The DSSP platform provides a range
92
of techniques for characterising particle motions, making it the most convenient for making advanced scientific
93
imaging-based measurements [18]. The algorithms provided within DSSP are used to analyse the PIV
94
measurements further. This functionality built in the DSSP was used to analyse the digital frames of the grains,
95
and to calculate two velocity components vectors of the grains and their evolution during load application within
96
the sand layer between two successive images. In this study, the area of interest or the target area (full image) was
97
specified before being divided into sub-sections called interrogation areas (IA) of 16×16 pixels each covering a
98
4
[18, 19, 26] to identify the movement of soil based on particle images (here 30 images per second) obtained from100
the front of the Perspex test rig. The interrogation areas from each successive images are cross-correlated with
101
each other, pixel by pixel [18].The correlation produces a peak signal detection, identifying the common grains
102
movement and thus also the velocity vector output is computed with sub-pixel interpolation. A velocity vector
103
plot over field of view (target area) is acquired by repeating the cross-correlation for each interrogation area over
104
the two images [18].
105
106
Materials and Experiments
107
108
The samples used here are disturbed dry silica sand samples obtained in UK. Sand properties were characterised
109
(Table 1) according to the American Society for Testing and Materials [27-28]. Their experimentally measured
110
material properties and size distribution showed the following properties: maximum dry density (d max.) =16.50
111
kN/m3 and minimum dry density (
d min.) =14.23 kN/m3. In addition, using the sieve analysis as shown in Online
112
Resource OR1, the following properties of sand were obtained from the grain size distribution curve: D10=0.25
113
mm; D30=0.31 mm; D60=0.40 mm (10%, 30% and 60% of the particles are finer than these particular particle sizes
114
respectively); D50= 0.37 (Mean grain size of soil particle); uniformity coefficient CU=1.55; and the coefficient of
115
curvature CC =0.93. These data revealed that the soil chosen is a poorly graded sand [17, 29]. The roundness of
116
the grain was mostly spherical to sub-prismoidal and the angularity of the grains are characterised as angular and
117
sub-angular [28]. For this, digital microscopy images of the grain samples were used as shown in the Online
118
Resource OR1.
119
Bearing capacity of the footing was tested using an aluminium box of 460 mm in length, 300 mm in height and
120
39 mm in thickness, filled with dry silica sand. The box had smooth and transparent Perspex walls of 15 mm
121
thickness also to eliminate any bending effects during the test (Fig. 1). The authors also verified during all tests
122
that under the ultimate loads (Pult) of the dense sand packing did not lead to any remarkable out of plane movement
123
of the container's face. This was checked using a dial gauge (0.01 mm resolution) mounted to the side walls from
124
a magnetic base (though the picture of this arrangement is not included here). The surface roughness of the footing
125
in contact with sand, and the Perspex walls of the experimental box was measured using 3D optical microscopy
126
based on white light interferometry [30] from which the mean roughness value Rawas obtained as 3.204 m and
127
0.λλ m respectively. The rigid foundation base was relatively rough (ratio between the angle of interfacial friction
128
5
considered in this study, i.e., smaller and larger footing width with dimensions 38 × 38 × 15 mm3 and 76 × 38 ×130
15 mm3 respectively (footing width B/D
50 = 102 and 204 respectively to avoid any grain size effect, and
131
height=15 mm) was used here. It is recognised that the scale effects of the footing model could affect the
132
estimations of their strength characteristics [31]. For example, a footing with relatively small width would require
133
a relatively low stress level in the laboratory experiments, as if it were on a denser “state” of soil than a larger
134
footing, even if they were tested on sand with the same void ratio [31]. To minimize the scaling effect, it is
135
suggested that the model testing for studying the effect of packing density should not be too close to the limits of
136
void ratio (emax and emin, [32]). Taking this into account in the present study, the packing densities are kept away
137
from these limits (Table 1). The value of B/D50 used here is within the permissible limit of testing strip footing in
138
the lab although footing sizes used in real practice could be higher [33]. Such model dimensions have been used
139
in previous experimental studies in this field [8, 34]. To minimise any frictional effects of the footing with the
140
wall, a small gap of 1 mm is allowed between the footing and the back wall, so that they do not affect the
141
deformation of the soil recorded by PIV at the front of the box. It is also worth noting that about 12.5% of particles
142
were in the size range of 0.5-0.9 mm as shown in the Online Resource OR1, which helped to avoid any noticeable
143
leakage of grains from behind the footing. These measures ensure that the observed movement from the images
144
is due to the inner movement in the grains under mechanical loading [30].
145
146
Fig. 1 (a) Experimental setup using PIV with a live image of footing in contact with sand (b) schematic diagram
147
of the experimental setup (dimensions are in mm)
148
149
The degree of compaction of granular soil is normally characterised according to the relative density Dr, defined
150
as [35]:
151
(1)
152
Pult
Pult
460 mm
3
0
0
(a) (b)
Rigid base 39
Bottom plate
S
a
n
d
Perspex sheet
z
High speed
camera Footing
Sand
PC
Images collection
B
Aluminium sheet
[image:6.595.73.512.452.630.2]6
Where emax and emin are void ratio of the soil in loosest and densest conditions respectively and e is in-place void153
ratio of the tested soil (Table 1). Three cases of relative densities (Dr) loose (L), medium-dense (M) and dense
154
(D) were used in this study. The loose granular packing (=14.7 kN/m3, D
r =24 ±2%, e= 0.76) was prepared by
155
pouring the grains mass uniformly across the width of the box in small layers using pluviation technique method
156
[36] so that any segregation of the grains was avoided during the construction process. The top surface of the sand
157
layer was gently levelled off using a hand scraper. This researchers also took care not to disturb the constructed
158
loose sample in any way before applying the axial loading in our experiments. The mass of sand grains laid in
159
the box to the required height pertains to the density of the loose sample. The medium-dense packing (=15.30
160
kN/m3, D
r =53 ±2%, e= 0.7) was hand compacted in three layers, using 50 blows per layer in 0.035 m lifts each
161
with a 16 cm2 compaction hammer of 0.92 kg weight designed for this purpose [31]. The dense sand (=15.80
162
kN/m3, D
r =72 ±2%, e= 0.64) was achieved in five layers, 60 blows per layer. The footing was placed
163
symmetrically on the top surface of the sand bed.
164
An axial compression loading (q) was applied slowly on the footing (0.05 mm/s penetration velocity) using an
165
Instron loading machine with 0.1N resolution (Fig. 1). The loading machine also had an inbuilt dial gauge (linear
166
variable differential transformer, LVDT) to record the vertical displacement of the indenting footing on the sand
167
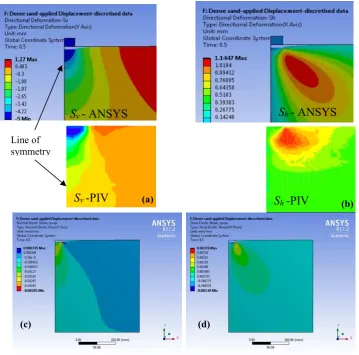
packing. The macroscopic load and vertical displacement of the footing were also measured from the tests. The
168
PIV camera with an allowable frame speed up to 100000 frames per second (fps) was fixed in front of the box
169
and two light sources were used to illuminate the rig. However, as the loading condition is quasi-static in this
170
study, the recording at 30 fps was found to be adequate until soil failure was reached, although higher frame
171
speeds were considered in the early stages of the experimental programme. We had verified that the recording at
172
greater than 30 fps did not affect the result noticeably. The resolution of the images was 1920 × 1080 pixels.
173
Initially, a number of trials were conducted to determine the suitable acquisition rate of the recorded PIV images
174
for the analysis. It was found that, for the current experiments, an acquisition of 1 frame/s of the recoded images
175
is adequate in which images were captured at displacement increments of 0.0017 mm. DSSP was used to analyse
176
the images using an adaptive PIV [18]. The adaptive PIV iteratively adjust the size of the individual interrogation
177
areas (IA) in order to adapt to local seeding densities and flow gradients [18]. This is suitable to study granular
178
systems even under different flow conditions [19] and bearing capacity of layered system [26]. Here, the
179
distribution of velocity vectors of the grains was examined in the image analysis using a minimum interrogation
180
area (IA) of size 16× 16 pixels and maximum IA size of 64 × 64 with a measurement resolution of sub- pixel [18].
181
7
horizontal and vertical directions. White et al. [24] have shown that the precision of the measurement (i.e., the183
random difference between multiple measurements of the same quantity) improves with larger PIV patches and it
184
is inversely proportional to the amount of the measurement resolution. This size of the mesh patch used here
185
reveals a standard error better than 0.01 pixel [18, 24]. In the experiments, two illumination lights were positioned
186
above the testing box to avoid reflection and glare on the measurement side of the Perspex wall. It was verified
187
that the variation in image scale in both horizontal and vertical direction were not significantly different. The PIV
188
camera lens was focused normal to plane the footing-soil interface region where the measurements are most
189
important to make. Therefore, the dimension of target area was ~ 5.5B× 3.5B (Fig.1). The displacement measures
190
i.e. resultant displacement(SR), vertical displacement (Sv)and horizontal displacement (Sh) were evaluated under
191
a given load in total (i.e., between the reference image at zero load (q=0) and the image at the required fractions
192
of the ultimate load level, such as 0.34qult and qult. A typical mean size of sand grain (D50 = 0.37 mm) was
193
represented by about 3×3 pixels. Hence the PIV experimental measurements made here are at the local-scale.
194
Following the footing tests, two standard cone penetration test (CPTs) tests were also conducted for each soil
195
density to characterise the samples using a 10 mm diameter model CPT [25, 29]. The CPT was inserted at a
196
penetration rate of 1 mm/s in the current experiments as shown in Online Resource OR2, but using the identical
197
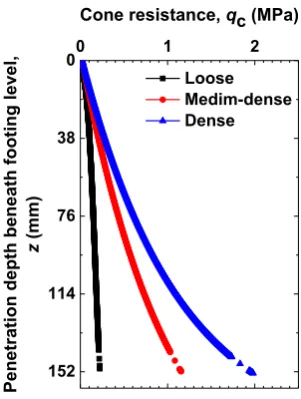
filling procedure of the grains used in the footing–sand indentation experiments presented earlier. Figure 2 shows
198
the CPT penetration profiles for the soil for all sand packings. The penetration resistance (Cone resistance =qc)
199
profiles are plotted against the penetration depth from the bottom level of the footing.
200
201
Fig. 2 CPT data for the sand packing
202
0 1 2
0
38
76
114
152
Loose Medim-dense Dense
Pe
n
e
tr
a
ti
o
n
d
e
p
th
b
e
n
e
a
th
fo
o
ti
n
g
l
e
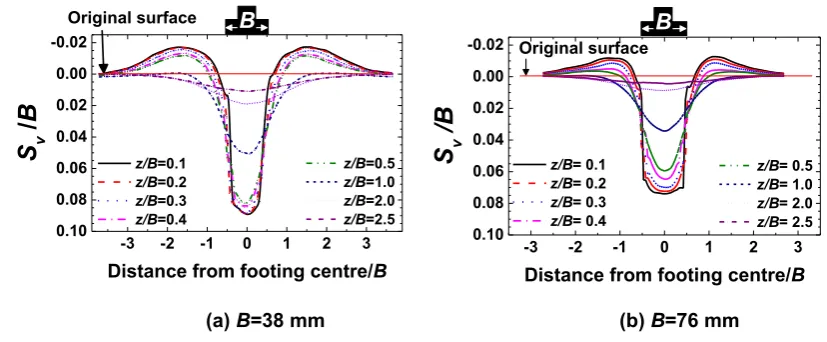
v
e
l,
z
(m
m
)
[image:8.595.222.373.507.707.2]8
As expected, the penetration resistance of dense sand is higher than medium-dense and loose sand. The penetration203
resistance of loose sand remains almost constant with depth after z/B =2.5, but penetration resistance for
medium-204
dense and dense sand increase with depth at an increasing rate. The rate of the penetration resistance of dense
205
sand is larger than that of the medium-dense. Again, the differences in the penetration resistance for different
206
relative densities are primarily accounted for the relatively larger volumetric compressibility in loose,
medium-207
dense sand than the dense sand. The CPTs results for all the densities show the average response of the two results
208
(error within 5%).
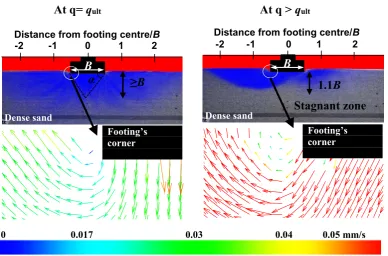
209
210
FEM Simulations
211
212
Non-linear elastic finite element simulations have been made for the cases of a single footing indenting on the
213
loose, medium-dense and dense sand packing using ANSYS workbench 17.2 version [37]. The ANSYS program
214
is a broad purpose finite element modelling (FEM) package for numerically solving a wide variety of mechanical
215
interactions [37].
216
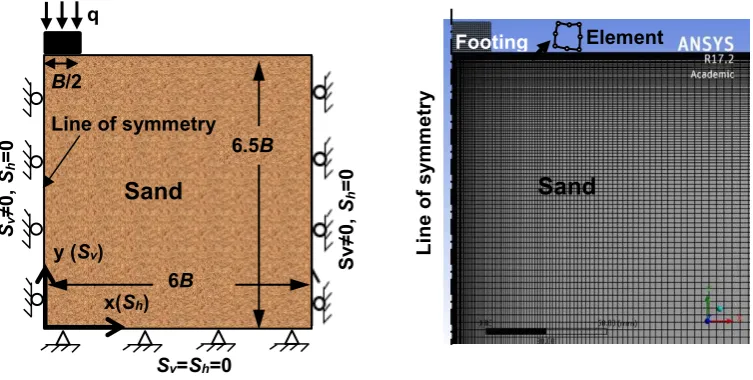
In the present study, ANSYS is used to create a two-dimensional solid geometry. The chosen domain along with
217
applied boundary conditions is shown in Fig. 3. The simulations were held under identical boundary conditions
218
for footing indenting with different types of sand packing as in the case of physical experiments. In the
219
simulations, the bottom most nodes were fully constrained in both the horizontal and vertical directions (Sv = Sh
220
= 0). A line of symmetry is used along the footing centre line (Sv ≠ 0, Sh= 0). The far side of the assembly was
221
fully constrained in the horizontal direction (Sh=0) and free to move in the vertical direction (Sv ≠ 0) [38-39]. The
222
contact regions between the rigid footing and the sand were modelled as a relatively rough surface (interface
223
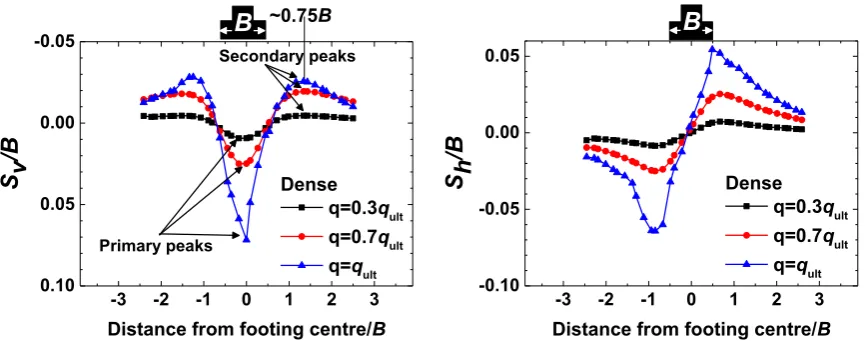
friction coefficient=0.25) corresponding to the experimental study [40]. An adaptive FE mesh was generated at
224
the footing-soil interface where the largest stresses and strains would be expected. It should be mentioned that
225
Skewness mesh metric (a measure of mesh quality) of 0.132 maximum value was obtained which is acceptable
226
[41]. The size of the elemental geometry is shown in Fig. 3. The nodes and element numbers in the soil body are
227
equal to 44000 and 14360 respectively.
228
Material model for soil describes the nonlinear plasticity behaviour which depends on the engineering soil
229
properties in the current ANSYS simulations. For this, the experimentally characterised bulk stress-strain
230
relationship corresponding to the load-displacement curves of different packing densities presented in Figure 4
231
9
233
234
Fig. 3 (left) Chosen domain and boundary conditions, half of domain analysis not to scale (right) finite element
235
mesh, and element enlarged. Sv is vertical displacement component and Sh is horizontal displacement component.
236
B is the footing width
237
238
Furthermore, the experimentally characterised material physical properties were used i.e. bulk density, initial
239
modulus of elasticity (E) and typical value of Poisson’s ratio ( ) for sand (E = 25 MPa, 35 MPa and 50 MPa
240
whereas =0.2, 0.25 and 0.35 for the loose, medium-dense and dense sands respectively [11]). In the present
241
analysis, ANSYS used the multilinear isotropic hardening of the stress-strain relation [41]. The width of the
242
loading area is 0.5B. The loading is applied vertically in increments of constant displacement of 0.15B, uniformly
243
across the width of the footing within the time step of 0.01 second (~300 cumulative iteration). The evolution of
244
different displacement components in the solid geometry (depicting the sand packing) is tracked for different
245
loading levels and compared with corresponding PIV measures later.
246
247
Results and Discussions
248
249
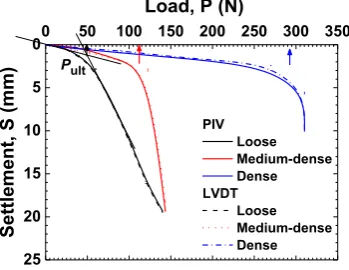
The load–settlement relationship for a typical footing (B=38mm) interacting with sand is presented in Fig. 4. It is
250
worth mentioning that these PIV curves loads are simultaneously measured using the corresponding load outputs
251
from the Instron. The settlements obtained using the PIV and LVDT gauge agree well. This justifies applying PIV
252
to examine the displacement measures in sand layer later. Using the load-settlement data, the tangent intersection
253
method [42] was applied to obtain the value of the ultimate bearing capacity (Fig. 4). The ratio of ultimate vertical
254
settlement under ultimate load (Su) to footing breadth (B), Su/B is ~ 5.0, 7.1 and 11.7 % for the loose,
medium-255
q
B/2
6.
y (Sv)
x(Sh)
Sv=Sh=0
Line of symmetry
Sv
≠0
,
S
h
=0
Sand
Sv
≠0
,
S
h
=0
Sand
Footing Element
L
in
e
o
f
s
y
m
m
e
tr
[image:10.595.115.492.81.271.2]10
dense and dense sand respectively. These measures and the nature of bulk load-settlement curves are consistent256
[11] with punching (without a well-defined peak), local shear failure (moderate peak) and general shear failure
257
(well-defined peak) for sand described by Liu and Iskander [17], Dijkstra et al. [29], Vesic [43].
258
[image:11.595.210.385.157.292.2]259
Fig. 4 Load-settlement curves of footing (B=38mm) interacting with loose, medium-dense and dense sand. The
260
guide arrows show the ultimate load level (Pult) of the sand packing
261
262
Though not presented here, we also obtained a good level of comparison with De Beer’s study [44] for the
263
variation of N (Bearing capacity factor) with B for different sand packing. Both the bearing pressure and the
264
failure strain increase with the packing density of sand. The authors wish to point out that, in the case of strip
265
footings used in practice, 3D condition could exist around the ends of the strip footings even if the footing is long.
266
However, for most parts of long strip footings, plane-strain condition could exist [8, 25, 30] as assumed in the
267
current 2D plane-strain experiments [34].
268
The peak angle of internal resistance ( peak) for all cases of the packing density was also determined from triaxial
269
compression test at different confining pressures 100, 200, and 300 kPa. For sands, the angle of internal friction
270
typically ranges from 26° to 45°, increasing with the relative density. Three cases of relative densities were used
271
as that in the experiment tests: loose, medium-dense and dense. The height of the sand samples was typically 76
272
mm, and the diameter was 38 mm. Subsequently, the plots of deviator stress ( d) against axial strain ( a) were
273
made. The peak angle of friction of the soil is obtained according to the stress state at peak strength. The measured
274
angles of internal friction are 32°, 39.5°, and 44.3° for loose, medium-dense and dense sand respectively. Using
275
these, the peak angle of shearing resistance of the samples was evaluated and plotted against the relative density.
276
This variation is described in (2) as:
277
(2)
278
0 50 100 150 200 250 300 350
25 20 15 10 5 0
Load, P (N)
Se
ttl
e
m
e
n
t,
S
(m
m
)
PIV Loose Medium-dense Dense LVDT
11
Also the ( peak) determined from the standard direct shear test (ASTM D3080) under three different normal stresses279
50, 100 and 200 kPa. The peak angle of shearing resistance of the samples was evaluated and plotted against the
280
relative density. This variation is described in a mathematical form in (3) as follows:
281
(3)
282
This macroscopic relations obtained from the above said characterisation experiments are in agreement with other
283
literature [8]. The authors wish to point out that, some literature suggest that the shear friction angle measured
284
using direct shear tests may not pertain to that of sand under the plane strain experiments [36]. Jewell [45]
285
suggested that symmetrical direct shear test could provide a more reliable measure of the plane strain angle of
286
friction and the angle of dilation for sand than conventional direct shear test. In some studies, the angle of internal
287
friction of sand obtained from the conventional direct shear test also correlated well with the experimental results
288
of plane–strain condition [46]. However, in analysing the footing-soil interactions using theoretical and
289
computational methods by idealising soil as an elastic media [47], friction angle does not form as a direct input in
290
the analysis.
291
292
Comparison of the PIV measurements with FEM analysis
293
294
Here the typical results are presented below for the case of footing interacting with the dense sand packing. Figure
295
5(a, b) shows the variation of PIV-based vertical displacement component and horizontal displacement component
296
profiles in the dense sand at ultimate load and compared with the FEM (ANSYS) analysis. It is evident that a
297
good level of agreement between the PIV and FEM approaches are obtained both qualitatively and quantitatively
298
up to 2.5B from the footing edges. Furthermore, quantitative comparison of variation of the normalised vertical
299
displacement component Sv and the normalised horizontal displacement component Sh along a horizontal section
300
at a depth of 0.5B below the level of footing under the ultimate load is provided for different packing conditions
301
of sand in the Online Resource OR3. A good level of agreement is obtained between them. Figure 5(c, d) shows
302
the variation of normal and shear elastic strain contours at ultimate load for the case of dense sand using FEM. It
303
can be seen from the normal and shear elastic strain map that there is a strain concentration around the corner of
304
the footing. It can be noticed from the contours of shear strain in the dense media that the soil is sheared in the
305
area below the edge of the footing. Though not presented here, similar observations were made for the loose and
306
12
308
309
Fig. 5 Comparison of PIV-based vertical displacement profile in dense sand at ultimate load below the footing
310
with FEM analysis (identical colour codes are used): (a) vertical displacement component (b) horizontal
311
displacement component below the footing. Taking advantage of FEM, the strain distributions are presented: (c)
312
normal and (d) shear elastic strain
313
314
PIV based analysis of footing-sand interactions
315
316
Figures 6-8 present typically the evolution of resultant velocity vectors in the sand packing under a typical load
317
of q=qult (B= 38mm). Also the corresponding evolution of vertical and horizontal strain rate ( and
318
respectively) in the sand packing are provided which help to identify the difference regions of granular flow in
319
the sand packing such as dead, active and passive zones as discussed below. The authors had also verified that
320
these generic observations were similar in the case of the larger footing width (B=76 mm). A detailed evolution
321
of this for three more stages of loading is provided in the Online Resource OR4-OR6. In this plot the contours of
322
the vertical velocity are also obtained from the DSSP and superimposed for information.
323
Sv
- ANSYS
Sv
-PIV
Line of symmetry
(a)
Sh
-PIV
(b)Sh
- ANSYS
[image:13.595.115.475.77.432.2]13
324
Fig. 6 (a) Resultant velocity vectors at a typical load of q=qult in loose sand and the scalar contours of the vertical
325
velocity using PIV (b) vertical strain rate (c) horizontal strain rate . Zones: 1- dead zone, 2-active zone, 3-
326
passive zone. B= 38 mm
327
328
329
330
Fig. 7 (a) Resultant velocity vectors at a typical load of q=qult in medium-dense sand and the scalar contours of
331
the vertical velocity using PIV (b) vertical strain rate (c) horizontal strain rate . Zones: 1- dead zone,
2-332
active zone, 3- passive zone. B= 38 mm
333
334
335
Fig. 8 (a) Resultant velocity vectors at a typical load of q=qult in dense sand and the scalar contours of the vertical
336
velocity using PIV (b) vertical strain rate (c) horizontal strain rate . Zones: 1- dead zone, 2-active zone, 3-
337
passive zone. B= 38 mm
338
-0.03 S-1 0 0.03 S-1
0 0.03 0.05mm/s -0.03 S-1 0 0.03 S-1
1 1
2 3
m max
(a) (b) (c)
Distance from footing centre/B
-2 -1 0 1 2
Distance from footing centre/B
-2 -1 0 1 2
Distance from footing centre/B
-2 -1 0 1 2
(a) (b) (c)
-0.03 S-1 0 0.03 S-1
0 0.03 0.05mm/s -0.03 S-1 0 0.03 S-1
1
2 3 1
Distance from footing centre/B
-2 -1 0 1 2
Distance from footing centre/B
-2 -1 0 1 2
Distance from footing centre/B
-2 -1 0 1 2
Distance from footing centre/B Distance from footing centre/B Distance from footing centre/B
-0.03 S-1 0 0.03 S-1
0 0.03 0.05mm/s -0.03 S-1 0 0.03 S-1
(a) (b) (c)
1 1
2 3
-2 -1 0 1 2 -2 -1 0 1 2
[image:14.595.73.530.81.264.2] [image:14.595.70.522.329.478.2] [image:14.595.79.534.568.722.2]14
At the early stages of the loading (c.a. q<0.5qult), approximately a triangular wedge of dead zone (region 1 in Figs.339
6-8 with a constant amount of resultant velocity of the grains but has the highest vertical velocity) is formed
340
beneath the footing in all cases of packing densities [48]. The authors point out that the dead zone does not mean
341
that the grains are not moving at all, but move as a block of grains with almost the same velocity. In granular
342
mechanics, the dead-zone is characterised by the block of materials beneath the indenting objects with the granular
343
materials, and moving as if they are continuous extension of the indenter, i.e., no slip at the indenter-granular
344
interface [22]. Noticeably, outside this zone the particles tended to move downward and sideward symmetrically
345
until the ultimate bearing capacity is reached in the sand packing. Similar trends were noticed in other studies, for
346
example in sand [22], different soil types [48] and soft metal [49].
347
The depth of this wedge at the ultimate bearing load is equal to about B, whose vertices (slip planes) intersect the
348
horizontal at an angle ( = Angle of dead zone wedge/active zone 1) of about 62 ±2 . These are consistent with
349
Prandtl’s assumption [48] for smooth footing ( = 45+ /2), which have not been confirmed using microscopic
350
experiments, but using PIV here. Furthermore, Kumar and Kouzer [38] have reported similar measures for smooth
351
footing using plasticity limit analysis with the help of finite element method (FEM). For a further increase in the
352
load, the grains in the dead zone tend to punch the neighbouring grains in zone 2 radially outwards (Figs.6-8). A
353
failure pattern consistent with Vesic [43] at the ultimate failure load is visualised (Figs. 6-8, and as in Online
354
Resource OR4-OR6) for all cases of sand considered here. By and large, the grains flow symmetrically with
355
respect to the central axis of the footing until reaching the ultimate load (q=qult) then, unsymmetrical flows occur
356
beyond the ultimate load. This is consistent with the classical literature, e.g. Vesic [43] for medium and dense
357
sand, but the current study observes that this could happen in the case of loose sand as well. At ultimate load, the
358
dense soil failed suddenly corresponding to the pronounced peak in the bulk strength curve presented in Fig.4,
359
and the unsymmetrically strong velocity distribution presented in Fig. 8 at the localised level. So, in the higher
360
relative density tests, the horizontal displacement (Fig. 8c) seems to be highly non-symmetric under ultimate load.
361
In reality local structural non-homogeneities could exist, and this triggers the non-symmetrical flow of grain
(post-362
failure) even under the symmetric loading conditions. At this stage, the grains flow like a fluid. The grains beneath
363
this flow region are solid-like and almost stagnant. The shear failure occurs progressively from the dead zone and
364
extending radially outwards.
365
The sand surface forms a heap spreading up to about 2.7B, 2.6B and 2.4B away from the footing centre ( =
366
Distance of sand heap from the centre of the footing, Fig. 6) for the loose, medium-dense and dense packing
367
15
loose, medium and dense sand respectively ( max= Location of sand heap attaining maximum height from the
369
centre of the footing). The slope of sand heap at the ultimate load is 31°, 33° and 38 ° for the loose, medium-dense
370
and dense sand respectively. The average value of the slop of the heap for the different sand packing is (34°)
371
identical to the angle of repose of the sand. These angles are close to the residual angle of internal friction of the
372
sand ( ) about 31°, 33°, 37° for the loose, medium-dense and dense sand samples respectively. These residual
373
angles are consistent with the previous literature [50].
374
The effect of sand packings at ultimate load on the failure mechanism are summarised both quantitatively and
375
systematically in Fig. 9 for a typical case of footing (B=38mm). This shows the resultant velocity vectors of soil
376
movement at ultimate bearing capacity and the schematic diagram of the failure mechanism underneath the footing
377
of different packing densities. It is evident that the footing load test in the loose packing corresponds to a punching
378
failure and local shear mechanism, consistent with the literature [29]. On the other hand, tests in the
medium-379
dense and dense packings exhibit a general failure mode with relatively larger horizontal displacement and soil
380
heap next to the footing, typical of a conventional rigid plastic bearing capacity, and Prandtl's wedge-shaped zone
381
mechanism [48]. Hence, the formations of velocity discontinuities are linked to the density of the sand packing.
382
[image:16.595.94.498.410.657.2]383
Fig. 9 (left) Resultant velocity vectors of soil movement under ultimate bearing capacity, B=38 mm (right) sketch
384
of general schematic failure mechanism underneath footing of different packing densities
385
386
Interestingly, the boundaries of the zone of plastic flow in sand at failure load sketched using PIV here (in terms
387
of the resultant velocity vector, and the components of strain rate presented in Figs.6-8) are remarkably similar to
388
Loose sand
Medium-dense sand
Dense sand
0 0.03 0.05 mm/s
Loose sand
Medium-dense sand
Dense sand
16
such intuitive diagrams suggested by Fröhlich in the 1λ30’s [48]. However, at or beyond the ultimate load, the
389
PIV experiments have shown non-symmetric flow of grains even under the symmetric loading conditions on the
390
footing. They could be attributed to the potential existence of (even minor level) non-symmetrical structural
391
arrangements of the grains at local scale in reality. These could amplify the non-symmetrical velocity patterns
392
under the above said condition.
393
Figure 10 shows the typical normalised vertical displacement component in dense sand at different horizontal
394
sections below the footing-soil interface under the ultimate load (qult). The plots of this for loose and
medium-395
dense sand are provided in the Online Resources OR7. It is evident that at a depth of z/B=2.5 the vertical
396
displacement is practically negligible in all cases of footing width and packing densities. Furthermore, for a given
397
packing density, the normalised vertical displacement in the soil at a given depth (e.g. z/B= 0.1) decreases for an
398
increase in the width of the footing under the ultimate load. However, here it is found that the absolute value of
399
the vertical displacement in the soil for a given depth increases for increase in the width of the footing as also
400
referred in other studies [51]. The heap close to the free surface (secondary peaks) increases with increasing
401
relative density but decreases with z/B (Fig. 10). Also, the heap height decreases with footing width as shown in
402
Online Resource OR7. This is related to potentially particles interlocking and rolling over of the grains. This has
403
a significant effect in the development of the vortex map adjoining the footing sides [22]. The discontinuities in
404
the velocity measures directly beneath the footing and the edges of the footing could result some error in the
405
measurement [25]. However, these measurements are taken at and beyond a depth z/B= 0.1 after the ultimate
406
loading is applied. Therefore, any such potential errors are expected to be minimal here.
407
[image:17.595.89.503.525.696.2]408
Fig. 10 PIV-based normalised vertical displacement component profiles in dense sand under the ultimate load
409
(q=qult) along different horizontal sections at different depths (z/B) from the footing-soil interface
410
411
412
-3 -2 -1 0 1 2 3
0.10 0.08 0.06 0.04 0.02 0.00 -0.02
z/B=0.5
z/B=1.0
z/B=2.0
z/B=2.5
z/B=0.1
z/B=0.2
z/B=0.3
z/B=0.4
S
v/
B
Distance from footing centre/B
B
Original surface
-3 -2 -1 0 1 2 3 0.10
0.08 0.06 0.04 0.02 0.00 -0.02
z/B= 0.5
z/B= 1.0
z/B= 2.0
z/B= 2.5
z/B= 0.1
z/B= 0.2
z/B= 0.3
z/B= 0.4
S
v/
B
Distance from footing centre/B
Original surface
B
17
The images of flow of grains near the corner of the footing (B=38 mm) for a typical case of dense sand is413
superimposed on their resultant velocity distribution plots and presented in Fig.11 for the pre-failure and
post-414
failure stages. These plots for the cases of loose and medium-dense sand are provided in the Online Resource
415
OR8. The grains flow radially outwards and non-uniformly in all cases of the sand packing. The grains resting
416
beyond the influence zone of deformation (or velocity) do not move in the post-failure stage, which is beyond
417
about 1.25B, 1.2B, and 1.1B for loose, medium-dense and dense sand respectively for both cases of footing width.
418
This trend is in agreement with Liu and Iskander [17] who stated that this influence zone is limited within a depth
419
of about 1B of the footing at post-failure stage in the case of loose sand (Dr is limited to 21% in their experiments).
420
From the PIV results, the authors observe that the depth of this influence zone is lower than that of pre-failure
421
stages possibly due to relatively radially outwards movement from the edge of footing as a block, which is
422
consistent with conventional Terzaghi’s bearing capacity analysis (Fig.11) [48]. The vortex in the total velocity
423
distribution profiles is clearly seen nearer the corner side of the footing for all sand densities. It started when the
424
vertical displacement (Sv) ratio Sv/B ~ 0.1. This is a result of gravitational movement of sand from the surface heap
425
while the subsurface grains move upward with loading. Eventually the grains fall back from the passive zone
426
toward the edge of the footing and form a loop-like resultant velocity profile. The spatial nature of the vortex is
427
consistent with Murthy et al. [22] where the sand medium was dense. The present study confirms the presence of
428
such vortex maps in loose and medium-dense sand as well.
429
[image:18.595.108.497.467.723.2]430
Fig. 11 Vortex formation of resultant velocity vectors for footing (B=38) interacting with dense sand. Enlarged
431
view of the corner of the footing is also presented here
432
At q=
qult
At q >
qult
0 0.017 0.03 0.04 0.05 mm/s
≥
B
Stagnant zone
1.1
B
B
B
Dense sand
Footing’s corner Footing’s
corner
Dense sand
Distance from footing centre/B -2 -1 0 1 2
18
Computational studies based on finite element method, for example Griffiths et al. [52] and Kumar and Kouzer433
[38] have reported velocity discontinuities near the footing edge, but the current study has shown their evolution
434
in the sand packing using PIV experiments. The presence of such vortices around the corner at q > qult is likely to
435
be related to the local density at the corner rather than the bulk density underneath the footing. Hence, even in a
436
loose sand under compression loading, once the materials close to the footing corner compact to a certain density
437
that is close to the maximum density of the tested soil then vortex will be observed around the edge of the footing.
438
Since features like this are really local features and not bulk features, so it is the density in the local zone around
439
the corner that would be important than the whole soil density for characterise of the vortex formation.
440
Figure 12 quantifies the normalised vertical displacement component Sv and horizontal displacement component
441
Sh of dense sand (for a typical case of B= 38mm) at different loading levels (q≤ qult). These plots for loose and
442
medium-dense sand are provided in the Online Resource OR9. Sv presents an inverted triangle-like profile that
443
becomes deeper and narrower with increasing load level. The maximum value of Sv occurs along the footing
444
centre, then decreases gradually towards the footing edge [17]. Sv decreases to zero within a distance of 0.25B
445
from the footing edge. This behaviour is due to the lack of confinement in the soil [11]. The secondary peaks in
446
the distribution of Sv diminish with decrease in the density of sand. Such patterns, at times non-symmetric, are
447
seen mostly at or beyond the ultimate load even under the symmetric loading conditions on the footing as
448
discussed earlier. The secondary peaks increase with increasing density as shown in Online Resource OR9. This
449
could be due to the particles interlocking, jamming and dilation that increase with the relative density of sand.
450
[image:19.595.88.521.505.677.2]451
Fig. 12 For a typical case of dense sand: (left) Normalised vertical displacement component (right) normalised
452
horizontal displacement component at a horizontal cross section 0.5B below footing using PIV at different loading
453
levels. Signs: vertical displacement (positive down, negative up), horizontal displacement (Negative toward left,
454
positive toward right from the central axis). B = 38 mm
455
456
-3 -2 -1 0 1 2 3
-0.05
0.00
0.05
0.10
Primary peaks
Dense
q=0.3qult
q=0.7q
ult
q=qult
Distance from footing centre/B
S
v
/B
B
Secondary peaks
~0.75B
-3 -2 -1 0 1 2 3
-0.10 -0.05 0.00 0.05
Dense
q=0.3qult
q=0.7qult
q=q
ult
S
h
/B
Distance from footing centre/B
19
The profile of Sh component presents S-like shape with a neutral point (zero value) occurring along the axis of457
symmetry of the footing. The soil along the vertical axis of symmetry is confined by the maximum vertical
458
displacement and therefore Sh~0. It is worth mentioning that, though not presented here, the variation of resultant
459
displacement ( ) at the footing-soil interface was uniform along the footing width.
460
461
Previous classical approaches have estimated the elastic settlement of footings using influence factors, which
462
could vary along the depth of sand [8, 53]. Such variations are also observed from numerical solutions, for
463
example using finite element method [53], elastic theory [16] and simple triangular profile using in situ cone
464
penetration tests [14]. However, they show different types of profiles. Using PIV here, the variation of Sv/B along
465
the centre line of the footing is examined, and Sh/B along the edge of the footing with depth for a typical case of
466
dense sand (B=38 mm) is presented in Figure 13. These results for the cases of loose and medium-dense sand are
467
provided in the Online Resource OR10.
468
[image:20.595.86.503.373.535.2]469
Fig. 13 Settlement profiles with depth z from the bottom surface of the footing at different loading levels for a
470
typical case of dense sand: (left) normalised vertical displacement component (right) normalised horizontal
471
displacement for the sand packing. B= 38 mm
472
473
They show a nonlinear response for all cases of sand packing. They gradually decrease to a negligible value
474
beyond ~ z/B= 2.5, similar results have been reported for loose sand by Liu and Iskander [17], however this
475
distance decreases for an increase in the relative density of sand. The normalised vertical displacement (Sv/B)
476
attains the peak at a depth of about 0.1B for all cases of sand packing and footing widths, which are almost
477
independent of the loading stages.
478
0.00 0.05 0.10 0.15
0
1
2
3
Dense q=0.3qult
q=0.7qult
q=qult
N o rm a li s e d d e p th (z/ B )
Normalised vertical displacement (Sv/B)
-0.15 -0.10 -0.05 0.00 0.05 0.10 0.15
0
1
2
3
Sh max.
Dense q=0.3qult
q=0.7qult
q=qult Right edge Left edge
q=0.3qult q=0.7qult q=qult
N o rm a li s e d d e p th (z/ B )
20
Similarly, the normalised horizontal displacement component (Sh/B) attains maximum at a depth of about 0.25B479
from the surface of the footing. At q ≤ qult, the maximum value of normalised vertical displacement for smaller
480
width (B=38mm) is: Sv max/B =0.070, 0.086 and 0.0.096 and Sh max/B= 0.02, 0.03 and 0.07for loose, medium-dense
481
and dense sand respectively. These values increase with the relative density and load level. But, these values for
482
the larger width of footing (B=76 mm) is: Sv max/B =0.045, 0.052 and 0.074 for loose, medium-dense and dense
483
sand respectively. The authors observed that the values of Sv max/B at ultimate load are close to the measured values
484
of Su/B presented earlier. Interestingly, the values of Sv max/B agree with the common assumption of using S/B
485
between 0.05B -0.1B for estimating qult from the load-settlement plots in foundation engineering designs [25, 36,
486
53]. Overall, the displacement measures reported here could be used to derive more realistic description of
487
displacement profiles in soil media in future.
488
Conclusions
489
490
PIV is shown to be effective and promising in understanding the local and global geomechanical characteristics
491
of footing interacting with sand media of different relative densities in a coherent manner. Where possible, the
492
displacement measures and generic characteristics of velocity fields in the sand are compared with existing
493
literature and FEM analysis and a good level of agreement is obtained. PIV clearly shows detailed descriptions
494
of the stages of velocity discontinuities for the sand media. The velocity profiles of the medium-dense and dense
495
sand are consistent with Vesic [43] but the advanced measurements reported here detect their evolutions more
496
precisely. For the loose sand, the velocity discontinuities could reach the free surface. Significant vortex zones
497
are existent near the footing corner at and beyond the ultimate bearing capacity of sand of all relative densities
498
studied here. The boundaries of the zone of plastic flow in sand at failure load profiled using the advanced PIV
499
here are remarkably similar to such intuitive diagrams suggested by the forefathers of soil mechanics, for example
500
Fröhlich in the 1λ30’s and Terzaghi’s in 1λ40’s [48]. The depth at which the settlement vanishes in the sand
501
decreases for increase in the relative density of sand. The present study provides both the spatial and temporal
502
distribution of displacements in soils of different packing densities under key stages of loading elegantly. PIV
503
could be applied in future to develop robust failure surfaces for more complex soil profiles and foundation types
504
encountered in geotechnical engineering applications. Further analysis is required for evaluating the scaling and
505
size effects of footing-sand interactions in a detailed manner with a better resolution of the digital measurements
506
(e.g. using multiple grids per grain). Also simulations using discrete element method (DEM) could be more
507
21
require extensive level of computing resources to study the cases considered in this work. However, as shown in509
the current manuscript, FEM-based displacement fields can match to the level of local-scale grain displacements
510
of corresponding experimental systems based on PIV. In particular, experiments-based, user-defined constitutive
511
relation was used as input in the FEM simulations here which is found to be useful. Studies are underway in our
512
group to extend the present research strategy to account for more complex conditions and realistic sand profiles
513
in footing-sand interactions – for example layered soil systems, interference effects and roughness effects of
514
footings.
515
516
References
517
518
1. Jaeger HM, Nagel SR, Behringer RP (1996) Granular solids, liquids, and gases. Rev Mod Phys 68(4):
519
1259
520
2. Duran J (2000) Sands, Powders and Grains. Springer-Verlag, New York, USA
521
3. Desrues J, Viggiani G (2004) Strain localization in sand: an overview of the experimental results obtained
522
in Grenoble using stereo photogrammetry. Int J Num Analy Meth Geomech 28(4): 279-321
523
4. Antony SJ (2007) Link between single-particle properties and macroscopic properties in particulate
524
assemblies: role of structures within structures. Phil Tran Roy Soc A: Math, Phy Eng Sci 365(1861):
525
2879-2891
526
5. Radjai F, Wolf DE, Jean M, Moreau J-J (1998) Bimodal character of stress transmission in granular
527
packings. Phys Rev letters, 80(1): 61
528
6. Thornton C, Antony SJ (1998) Quasi-static deformation of particulate media. Philo Trans Roy Soc A:
529
Mathem Phys Eng Sci 356:2763-2782
530
7. Kruyt N, Antony SJ (2007) Force, relative-displacement, and work networks in granular materials
531
subjected to quasistatic deformation. Phys Rev E 75(5):051308
532
8. Bowles JE (1997) Foundation Analysis and Design. 5th ed., McGraw-Hill, Singapore
533
9. Liu C, Evett JB (2004) Soils and foundations. 6th ed Pearson Prentice Hall, New Jersey, USA
534
10. Fang H-Y (1991) Foundation Engineering Handbook. 2nd Chapman and Hall, New York, USA
535
11. Das BM (2009) Shallow foundations: bearing capacity and settlement. 2nd ed., CRC Press, London, UK
536
12. Terzaghi K, Peck RB (1967) Soil mechanics in engineering practice. Wiley, London, UK
537
22
14. Schmertmann JH, Brown PR, Hartman JP (1978) Improved strain influence factor diagrams. J Geotech539
Eng Div, Proc ASCE 104(8):1131-1135
540
15. Powrie W (2014) Soil mechanics: concepts and applications. 3rd ed., CRC Press, London, UK
541
16. Mayne PW, Poulos HG (1999) Approximate displacement influence factors for elastic shallow
542
foundations. J Geotech Geoenviron Eng 125(6): 453-460
543
17. Liu J, Iskander M (2004) Adaptive cross correlation for imaging displacements in soils. J compu civ Eng
544
18(1): 46-57
545
18. Dynamic Studio (2013) Dynamic Studio User’s Guide. Dantec Dynamics, Skovlunde, Denmark
546
19. Albaraki S, Antony SJ (2014) How does internal angle of hoppers affect granular flow? Experimental
547
studies using Digital Particle Image Velocimetry. Powd Tech 268:253-260
548
20. Adrian RJ (1991) Particle-imaging techniques for experimental fluid mechanics. Ann Rev Fluid Mech
549
23(1): 261-304
550
21. Hamm E, Tapia F, Melo F (2011) Dynamics of shear bands in a dense granular material forced by a
551
slowly moving rigid body. Phys Rev E 84(4): 041304
552
22. Murthy TG, Gnanamanickam E, Chandrasekar S (2012) Deformation field in indentation of a granular
553
ensemble. Phys Rev E 85(6): 061306
554
23. Cheng Y, White DJ, Bowman ET, Bolton MD, Soga K (2001) The observation of soil microstructure
555
under load. Powd Grains 2001. Balkema: 69-72
556
24. White D, Take W, Bolton M (2003) Soil deformation measurement using particle image velocimetry
557
(PIV) and photogrammetry. Geotech 53(7):619-631
558
25. O’δoughlin C, δehane B (2010) Nonlinear cone penetration test-based method for predicting footing
559
settlements on sand. J Geotech Geoenviron Eng 136(3): 409-416
560
26. Jahanger ZK, Antony SJ, Richter J (2016) Displacement patterns beneath a rigid beam indenting on
561
layered soil. Pro. Eighth Amer. Reg. Conf. Inter. Soc. Terrain-Vehicle Sys. Michigan, USA, Paper No.67
562
27. ASTM Standard (1989) Soil and Rock, Building, Stores, Geotextiles. 04.08, West Conshohocken, Pa,
563
USA
564
28. Head K (2006) Manual of Soil Laboratory Test. Volume 1: soil Classification and Compaction Tests.
565
3rd ed CRC Press, Boca Raton, FL, USA
566
29. Dijkstra J, White DJ, Gaudin C (2013) Comparison of failure modes below footings on carbonate and
567
23
30. White D, Bolton M (2004) Displacement and strain paths during plane-strain model pile installation in569
sand. Géotech 54(6):375-397
570
31. Cerato AB, Lutenegger AJ (2007) Scale effects of shallow foundation bearing capacity on granular
571
material. J Geo Geoenv Eng 133(10): 1192-1202
572
32. Altaee A, Fellenius BH (1994) Physical modeling in sand. Can Geotech J 31(3): 420-431
573
33. Lau CK (1988) Scale effects in tests on footings. PhD thesis, University of Cambridge, UK
574
34. Raymond GP, Komos FE (1978) Repeated load testing of a model plane strain footing. Can Geotech J
575
15(2): 190-201
576
35. Das BM (2011) Principles of foundation engineering. 7th ed., Global engineering,Connecticut USA
577
36. Kumar J, Bhoi MK (2009) Interference of two closely spaced strip footings on sand using model tests. J
578
Geotech Geoenviron Eng 135(4):595-604
579
37. ANSYS 17.2 (2016) ANSYS Theory Manual. ANSYS, Inc., Canonsburg, Pennsylvania, USA
580
38. Kumar J, Kouzer K (2007) Effect of footing roughness on bearing capacity factor N . J Geotech
581
Geoenvironl Eng 133(5): 502-511
582
39. Mosadegh A, Nikraz H (2015) Bearing Capacity Evaluation of Footing on a Layered Soil using
583
ABAQUS. J Earth Sci Clima Chan 6(3):264
584
40. Gordan B, Adnan A, Aida MA (2014) Soil saturated simulation in embankment during strong earthquake
585
by effect of elasticity modulus. Model Simul Eng 2014:20
586
41. Lee H-H (2015) Finite element simulations with ANSYS workbench 16. SDC publications, USA
587
42. Akbas SO, Kulhawy FH (2009) Axial compression of footings in cohesionless soils. I: Load-settlement
588
behavior. J Geotech Geoen Eng 135(11):1562-1574
589
43. Vesic AS (1973) Analysis of ultimate loads of shallow foundations. J Soil Mech Found Divis ASCE,
590
99(SM1):45-73
591
44. De Beer EE (1965) Bearing capacity and settlement of shallow foundations on sand. Proc Sympo Bear
592
Capac Settl Found Duke University, Durham, N.C.: 15-33
593
45. Jewell RA (1989) Direct shear tests on sand. Geotech 39(2): 309-322
594
46. Lechinsky D, Marcozzi GF (1990) Bearing capacity of shallow foundations: rigid versus flexible
595
models. J Geotech Eng 116(11):1750-175
596
47. Selvadurai APS (1979) Elastic Analysis of Soil-Foundation Interaction. Dev. Geotech. Eng., 17,