Int. J. Electrochem. Sci., 4 (2009) 1262 - 1276
International Journal of
ELECTROCHEMICAL
SCIENCE
www.electrochemsci.org
Quantitative Analysis of Pseudoephedrine in Formulation by
Potentiometric Membrane Sensor; Computational Investigation
Mohammad Reza Ganjali,1,2,* Aidin Alipour,1 Siavash Riahi,1,3 Bagher Larijani,2 Parviz Norouzi1,2
1
Center of Excellence in Electrochemistry, Faculty of Chemistry, University of Tehran, Tehran, Iran 2
Endocrinology & Metabolism Research Center, Tehran University of Medical Sciences, Tehran, Iran 3
Institute of Petroleum Engineering, Faculty of Engineering, University of Tehran, Tehran, Iran *
E-mail: ganjali@khayam.ut.ac.ir
Received: 5 September 2009 / Accepted: 15 September 2009 / Published: 30 September 2009
A potentiometric electrode was developed for the rapid determination of pseudoephedrine hydrochloride in pharmaceutical preparations. The electrode incorporates a PVC membrane with a pseudoephedrine-tetraphenyl borate ion-pair complex. The influences of membrane composition, pH of the test solution, and the interfering ions on the electrode performance were investigated. The sensor exhibits a Nernstian response for pseudoephedrine hydrochloride ions over a relatively wide concentration range (1.0×10⁻⁵ to 1.0×10⁻¹ mol L-1) with a slope of 56.2±0.5 mV per decade at 25°C. It can be used in the pH range of 4.9-6.5. The membrane sensor was successfully applied to determination of pseudoephedrine in its formulations. The agreement mutually verifies the accuracy of experimental method and the validity of computational calculations. Validation of the method shows suitability of the sensors for applies in the quality control analysis of pseudoephedrine hydrochloride in pharmaceutical formulation.
Keywords: Ion-pair sensor; potentiometry; pseudoephedrine hydrochloride; PVC membrane; Chemometrics; Computational Chemistry
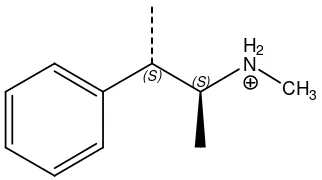
1. INTRODUCTION
(S) (S)
H2 N
[image:2.612.242.403.64.154.2]CH3
Figure 1. Chemical structure of Pseudoephedrine
Other techniques have been previously used to determine Pseudoephedrine in a variety of matrices. These methods include reverse-phase high performance liquid chromatography (HPLC) method [2], capillary electrophoresis [3], thin layer chromatography (TLC) [4], spectrophotometry [5] and GLC [6].
Potentiometric membrane sensors are playing an important role in pharmaceutical analysis [7-10] because of their simplicity, rapidity and accuracy over other analytical methods such as spectrophotometry and HPLC. Also, the other mentioned methods are elaborate, time-consuming and involve sophisticated equipment that might not be available in most analytical laboratories.
In this paper the interaction of pseudoephedrine with ion-pair reagents was studied by theoretical and calculative methods. According to the obtained results a Pseudoephedrine ion-selective potentiometric membrane electrode can be developed based on the ion-pair compound of Pseudoephedrine-tetraphenylbroate (PSE-TPB) as the electroactive substance. The proposed electrode was successfully applied for the determination of Pseudoephedrine in pharmaceutical formulations and urine samples.
Computational chemistry and molecular modeling play an important role in modern drug discovery and electrochemical science [11-17]. Computational work is also valuable in drug development where medium-sized organic pharmaceuticals are selected as candidates and are then made in larger quantities. Instead of modeling interactions with macromolecules the prediction of molecular properties for small molecules is more essential in the development stage.
The strength of binding usually correlates with the target molecules tendency to the ionophore and several energy contributions may be responsible for the binding. It is believed that amongst these energies, electrostatic interactions play a dominant role in the process - at least in sequence preference and target molecule positioning [18,19].
There are no studies to date in recent literature that have used computational methods to evaluate drug selective ligands by electronic properties. The lack of work in this area is probably due to the inherent difficulties associated with doing calculations on a Drug-Ligand complex. One of these problems includes the lack of parameters for semi-empirical or empirical methods (even though the numbers of atoms in typical drug complexes indicate the use of lower level calculations being appropriate).
2. EXPERIMENTAL PART
2.1. Materials and Reagents
The chemical reagents (analytical grade) were: Sodium tetraphenyl borate (NaTPB), high-molecular weight polyvinylchloride (PVC), dibutyl phthalate (DBP), benzyl acetate (BA), nitrobenzene (NB), tetrahydrofuran (THF), and the chloride and nitrate salts of the used cations (Merck Co.). Pseudoephedrine Hydrochloride and its tablet were obtained from different local pharmaceutical factories. All solutions were prepared using triply distilled water.
2.2. Apparatus
The glass cell, where the Pseudoephedrine-selective electrode was placed consisted of a R684 model Analion Ag/AgCl reference electrode as the internal reference electrode, and a calomel electrode (SCE, Philips). Both electrodes were connected to a Corning ion analyzer with a 250 pH/mV meter with ±0.1 mV precision.
2.3. Preparation of ion-pair compound
The ion-pair compound of Pseudoephedrine-tetraphenylborate (PSE-TPB) was prepared by: 20 mL of 0.01 mol L-1 solution of Pseudoephedrine hydrochloride mixed with 20 mL of tetraphenyl borate solution (0.01 mol L-1) under stirring. The resulting precipitate was filtered off, washed with water and dried [9,10].
2.4. Preparation of the electrodes
The general procedure to prepare the PVC membrane was as follows: Different amounts of the ion-pair along with appropriate amounts of PVC, plasticizer and additive were dissolved in tetrahydrofuran (THF), and the solution was mixed well. The resulting mixture was transferred into a glass dish of 2 cm diameter. The solvent was evaporated slowly until an oily concentrated mixture was obtained. A Pyrex tube (3-5 mm o.d.) was dipped into the mixture for about 10 s so that a transparent membrane of about 0.3 mm thickness was formed. The tube was then pulled out from the mixture and kept at room temperature for about 10 h. The tube was then filled with an internal filling solution (1.0×10⁻³ mol L-1 pseudoephedrine hydrochloride). The electrode was finally conditioned for 24 h by soaking in a 1.0×10⁻³ mol L-1 Pseudoephedrine hydrochloride solution [20-23].
2.5. Standard Pseudoephedrine hydrochloride solutions
2.6. Emf measurements
The following cell was assembled for the conduction of the emf (electromotive force) measurements:
Ag–AgCl | internal solution, 10-3 mol L-1 pseudoephedrine hydrochloride| PVC membrane | sample solution | Hg–Hg2Cl2, KC1 (satd.)
These measurements were preceded by the calibration of the electrode with several pseudoephedrine hydrochloride solutions (working solutions).
2.7. Computational methods
Calculations on the isolated molecules and molecular complexes were performed within GAUSSIAN 98 package [24]. Each species was initially optimized with PM3 method and then the optimized structures were again optimized with density functional theory, using the 6-31G* basis set. Full geometry optimizations and frequency calculations were performed. Each species was found to be of minima by having no negative values in the frequency calculation. The calculations gave internal energies at 0 K. In order to obtain gas phase free energies at 298.15 K it was necessary to calculate the zero-point energies, and thermal corrections together with entropies to convert the internal energies to Gibbs energies at 298.15 K [25, 26].
Frequency calculations on these structures verified that they were of true minima and provided the necessary thermal corrections to calculate H (Enthalpy) and G (Gibbs free energy). Finally, full optimizations and frequency calculations for each species were performed with the DFT/6-31G* [27,28].
The other one-electron properties (dipole moment, polarizability, energies of the frontier molecular orbital) were also determined at the B3LYP/6-31G* level. For the charged species the dipole moment was derived with respect to their mass center because for the non-neutral molecules, the calculated dipole moment depended on the origin of the coordinate system.
The stabilization energies of the selected complexes were determined with the help of the DFT calculations and calculated with a recently introduced method based on the combination of the approximate tight-binding DFTB with the empirical dispersion energy. The DFT methods are known to be inherently deficient for stacking interactions as they basically ignore the dispersion attraction [28-30]. As a consequence, their enlargement by an empirical dispersion term currently appears to be a very reasonable way to improve the major deficiency of the DFT method for the evaluation of the molecular complexes. It should also be mentioned that the interaction energies were obtained as the difference between the complex energy and the combined energies of the molecules in isolation [31].
3. RESULTS AND DISCUSSION 3.1. Theoretical Study
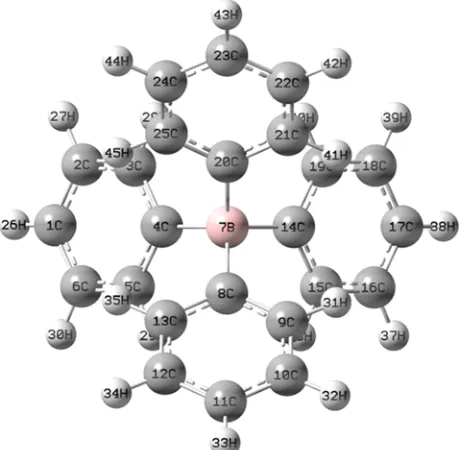
[image:5.612.203.433.116.341.2]
numeration of the atoms of the studied molecules; L1 for NaTPB (Fig. 2), L2 for KTpClPB, PSE for Drug (Fig. 3) and Drug-L1 for PSE-TPB (Fig. 4) and Drug-L2 for PSE-TpClPB are presented.
Figure 2. The full optimized structure of L1
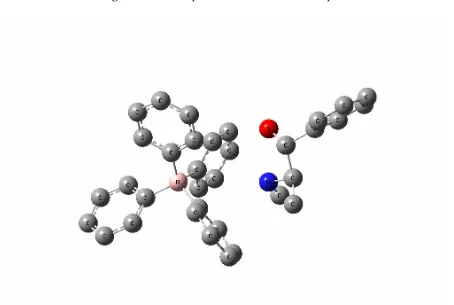
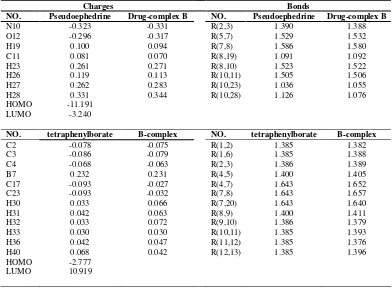
To obtain insight on PSE tendencies for L1 and L2 as potential ionophors, DFTB calculations (B3LYP/6-31G*) were carried out. The interaction energy of the pair ∆EA–B between molecules A (L1 or L2) and B (the drug) was estimated as the difference between the formed complex energy and the energies of the isolated partners. Interaction energies were corrected for the basis set superposition error using the counterpoise method [32,33]:
∆EA–B = EA−B − EA − EB
It was obtained to be -66.516 and -32.630 Kcal/mol for ∆EL1 and ∆EL2, respectively. It indicates L1 is a more appropriate ionophore for Pseudoephedrine sensor in comparison to L2 as it contributes to its higher interaction energy. The main discussions further on shall be on L1-Pseudoephedrine interactions.
Figure 3. The full optimized structure of Pseudoephedrine
[image:6.612.85.539.336.641.2]
Table 1. Significant computed atomic charges and bond length for Pseudoephedrine before and after complex formation
Charges Bonds
NO. Pseudoephedrine Drug-complex B NO. Pseudoephedrine Drug-complex B
N10 -0.323 -0.331 R(2,3) 1.390 1.388 O12 -0.296 -0.317 R(5,7) 1.529 1.532
H19 0.100 0.094 R(7,8) 1.586 1.580
C11 0.081 0.070 R(8,19) 1.091 1.092 H23 0.261 0.271 R(8,10) 1.523 1.522 H26 0.119 0.113 R(10,11) 1.505 1.506 H27 0.262 0.283 R(10,23) 1.036 1.055 H28 0.331 0.344 R(10,28) 1.126 1.076 HOMO -11.191
LUMO -3.240
NO. tetraphenylborate B-complex NO. tetraphenylborate B-complex
C2 -0.078 -0.075 R(1,2) 1.385 1.382 C3 -0.086 -0.079 R(1,6) 1.385 1.388 C4 -0.068 -0.063 R(2,3) 1.386 1.389
B7 0.232 0.231 R(4,5) 1.400 1.405
C17 -0.093 -0.027 R(4,7) 1.643 1.652 C23 -0.093 -0.032 R(7,8) 1.643 1.657 H30 0.033 0.066 R(7,20) 1.643 1.640
H31 0.042 0.063 R(8,9) 1.400 1.411
H32 0.033 0.072 R(9,10) 1.386 1.379 H33 0.030 0.030 R(10,11) 1.385 1.393 H36 0.042 0.047 R(11,12) 1.385 1.376 H40 0.068 0.042 R(12,13) 1.385 1.396 HOMO -2.777
LUMO 10.919
High values of polarizability (160.606 and 38.508 for L1 and drug, respectively) prove its role on interactions amongst L1 and the drug. The low values of dipole-dipole interactions (especially for that of L1=0.0) show it does not play a significant role between L1 and the studied drug. Moreover, since the studied molecules are in form of ions electrostatic interactions should also be considered.
The highest occupied molecular orbital (HOMO) and the lowest unoccupied molecular orbital (LUMO) for L1 and the drug calculated at B3LYP/6-31G(d) level are displayed in Table 1. The eigen values of LUMO and HOMO and their energy gap reflect the chemical activity of the molecule. LUMO as an electron acceptor represents the ability to obtain an electron, while HOMO as an electron donor represents the ability to donate an electron. From Table 1 the results illustrate that charge transfer interactions occur between L1 and the drug because the HOMO energy of L1 is close to the LUMO energy of the drug.
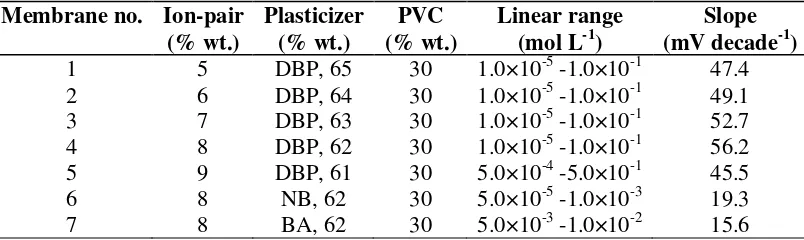
3.2. Membrane composition effect on the potential response of the sensor
optimum one in the development of this sensor. This membrane composition was selected after many considerations.
The high Pseudoephedrine extraction into the liquid membrane was a result of the elevated ion-pair tendency to exchange with the Pseudoephedrine cations. From Table 2, the 8 mg ion-ion-pair (PSE-TPB) is the best amount for the optimum response. The second factor that allows Pseudoephedrine ions to be extracted from an aqueous solution into the membrane as an organic phase is a plasticizer. After the evaluation of three solvent mediators (NB, BA and DBP), it was observed that they do not have the same results if the optimum composition is used. DBP, which is a low-polar solvent mediator, shows better response than BA and NB. NB and BA have higher dielectric constant values than DBP leading to the extraction of polar ions, which have negative effects on the extraction of Pseudoephedrine ions as a hydrophobic ion.
[image:8.612.106.508.344.464.2]The presence of lipophilic anions in a cation-selective membrane was also considered. As seen from Table 2 the presence of such anions in a catselective membrane (which is based on an ion-pair) decreases the response behavior of the sensor.
Table 2. Optimization of membrane ingredients
Membrane no. Ion-pair (% wt.)
Plasticizer (% wt.)
PVC (% wt.)
Linear range (mol L-1)
Slope (mV decade-1)
1 5 DBP, 65 30 1.0×10⁻⁵ -1.0×10⁻¹ 47.4
2 6 DBP, 64 30 1.0×10⁻⁵ -1.0×10⁻¹ 49.1
3 7 DBP, 63 30 1.0×10⁻⁵ -1.0×10⁻¹ 52.7
4 8 DBP, 62 30 1.0×10⁻⁵ -1.0×10⁻¹ 56.2
5 9 DBP, 61 30 5.0×10⁻⁴ -5.0×10⁻¹ 45.5
6 8 NB, 62 30 5.0×10⁻⁵ -1.0×10⁻³ 19.3
7 8 BA, 62 30 5.0×10⁻³ -1.0×10⁻² 15.6
3.3. pH effect on the electrode response
To understand the impact of pH on electrode response the potential was measured at two particular concentrations of the Pseudoephedrine solution (1.0×10⁻³ mol L-1), from the pH value of 3.0 up to 8.0 (concentrated NaOH or HCl solutions were employed for the pH adjustment). Fig. 5 shows the potential remained constant despite the pH change in the range 4.9 to 6.5 indicating the applicability of this electrode in this specific pH range.
-70 -60 -50 -40 -30 -20 -10 0
2 3 4 5 6 7 8 9
pH
E
(m
V
)
Figure 5. The pH effect of the test solutions (1.0×10⁻³ mol L-1) on the potential response of the
3.4. Study of sensor properties
The properties of a potentiometric membrane sensor are characterized by parameters such as: measuring range, detection limit, response time, selectivity, lifetime and accuracy [37-40].
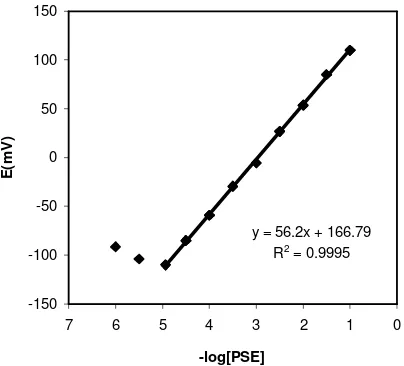
3.4.1. Measuring range
The measuring range of an ion-selective electrode includes the linear part of the calibration graph (Fig. 6). Measurements can be performed in this lower range but it must be noted that more closely spaced calibration points are required for more precise determinations. According to another definition, the measuring range of an ion-selective electrode is defined as the activity range between the upper and lower detection limits. The applicable measuring range of the proposed sensor is between 1×10⁻⁵ and 1×10⁻¹ mol L-1.
y = 56.2x + 166.79 R2 = 0.9995
-150 -100 -50 0 50 100 150
0 1 2 3 4 5 6 7
-log[PSE]
E
(m
V
)
[image:9.612.173.440.78.226.2] [image:9.612.204.406.495.678.2]
3.4.2. Detection limit
By extrapolating the linear parts of the ion-selective calibration curve the detection limit of the ion-selective electrode can be calculated. In practice, detection limits for the most selective electrodes are in the range of 10−5–10−6 mol L-1.
In this work the detection limit of the proposed membrane sensor was 9.0×10⁻⁶ mol L-1 and was calculated by extrapolating the two segments of the calibration curve (Fig. 6).
3.4.3. Response time
The response time of an electrode is evaluated by measuring the average time required to achieve a potential within ±0.1 mV of the final steady-state potential, upon successive immersion of a series of interested ions, each having a ten-fold difference in concentration. It is notable that the experimental conditions such as; stirring, flow rate, ionic concentration, composition of test solution, concentration and composition of solution to which the electrode was exposed before experimental measurements were performed, any previous use or preconditioning of the electrode and the testing temperature, have an effect on the experimental response time of a sensor [41-44].
In this work less than a 20 s response time was obtained for the proposed electrode when contacting different Pseudoephedrine solutions from 1.0×10⁻⁵ to 1.0×10⁻¹ mol L-1.
3.4.4. Pseudoephedrine electrode selectivity
The selectivity of an ion-pair based membrane electrode depends on the physico-chemical characteristics of the ion-exchange process at the membrane. For example, sample solution interface, mobility of the respective ions in the membrane and on the hydrophobic interactions between the primary ion and the organic membrane [45].
The selectivity of the Pseudoephedrine membrane electrode is related to the free energy of transfer of the Pseudoephedrine cation between aqueous and organic phases. The response of the electrode towards different substances was checked and the selectivity coefficient values KABPot were used to evaluate the interference degree. The selectivity coefficient values were obtained using the Matched Potential Method (MPM) [46-49].
The steps that need to be followed for the MPM method are: addition of a specified concentration of the primary ions (A, 10-2 mol L-1 of Pseudoephedrine solution) to a reference solution (10-5 mol L-1 of Pseudoephedrine solution), and the potential measurement. Then, the interfering ions (B, 10-2 mol L-1) are consecutively added to the same reference solution until the measured potential matches the one obtained before addition of the primary ions. The selectivity coefficient defined by the matched potential method, KMPM, is equal to the ratio of the resulting primary ion activity (concentration) to the interfering ion activity, KMPM = ∆aA/aB.
coefficient values it was considered that the function of the Pseudoephedrine-selective membrane sensor would not be greatly disturbed.
Table 3. Selectivity coefficients of various interfering compound for Pseudoephedrine sensor
Interference Log KMPM
Na+ -4.47
K+ -4.52
NH4+ -4.21
Fe3+ -4.77
Ca2+ -4.83
Glucose -3.92
3.4.5. Lifetime
The average lifetime for most of the reported ion-selective sensors is in the range of 4–10 weeks. After this time the slope of the sensor will decrease, and the detection limit will increase. The sensors were tested for 8 weeks during which time the electrodes were extensively used (one hour per day). The proposed sensors can be used for six weeks. Firstly, there is a slight gradual decrease in the slopes (from 56.2 to 51.1 mV decade-1) and then an increase in the detection limit (from 9.0×10⁻⁶ mol L-1 to 1.5×10⁻⁵ mol L-1). It is well established that the loss of plasticizer (ionic site) from the polymeric film is due to leaching into the sample. This is the primary reason for limited lifetimes of the sensors.
3.5. Analytical application
3.5.1. Determination of Pseudoephedrine in formulations
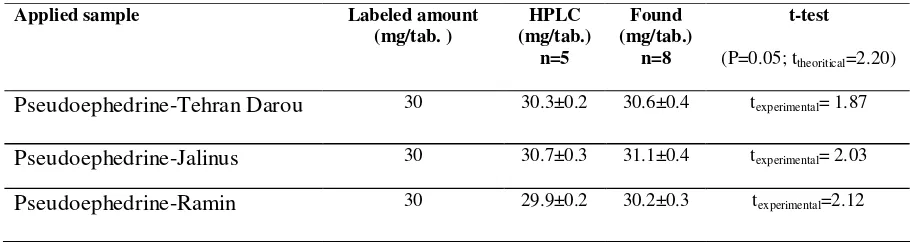
[image:11.612.77.532.600.721.2]The proposed sensor was evaluated by measuring the drug concentration in pharmaceutical formulations. The recovery results are shown in Table 4. The drug concentration was determined with the calibration method. The results are in satisfactory agreement with the labeled amounts. The RSD was equivalent to 1.95%.
Table 4. Results of pseudoephedrine assay in formulation by the pseudoephedrine membrane sensor
Applied sample Labeled amount
(mg/tab. )
HPLC (mg/tab.)
n=5
Found (mg/tab.)
n=8
t-test
(P=0.05; ttheoritical=2.20)
3.5.2. Recovery of Pseudoephedrine from urine samples
In order to investigate the applicability of the new sensor for determination of the drug in biological fluids it was applied to the recovery of Pseudoephedrine from urine samples. A 2.5 mL of 10-4 mol L-1 Pseudoephedrine solution was transferred into a 10-mL volumetric flask. After addition of 2.5 mL of urine samples, the solution was diluted to the mark with water. The determination of Pseudoephedrine solution content was done using the calibration method by the proposed sensor. The recovery of three replicate measurements was found to be 103.4%, 105.6% and 102.5%, respectively.
3.6. Recovery of Pseudoephedrine from urine samples
The linearity, detection limit, precision, accuracy, and ruggedness/robustness were the parameters which were used for the method validation [50-52].
As mentioned before, the measuring range of the Pseudoephedrine sensor is between 1×10⁻⁵ and 1×10⁻¹ mol L-1. The detection limit of the sensor was calculated as 9.0×10⁻⁶ mol L-1 (1.8 µg/mL).
3.6.1. Precision
The parameters of the repeatability and reproducibility were investigated in order to assess the precision of the technique. For the repeatability monitoring, 8 replicate standards samples 2, 20, 200 µg/mL were measured. Then, the mean concentrations were found to be 2.04, 20.3, 202.2 µg/mL with associated RSD values of 1.5, 1.03, and 0.55%, respectively. Regarding the inter-day precision, the same three concentrations were measured for 3 consecutive days providing mean Pseudoephedrine concentrations of 2.04, 20.3, 202.2 µg/mL and associated RSD values of 1.73, 1.05, and 0.26%,
respectively.
3.6.2. Accuracy
For determination of the accuracy of the method different tablets of the pseudoephedrine.HCl were analyzed with an official method and the proposed sensor. The results are shown in Table 4. At 95% confidence level the calculated t-value did not exceed the theoretical t-value indicating no significant difference between the proposed methods and the reference method.
3.6.3. Ruggedness/Robustness
under most conditions and did not show any significant change when the critical parameters were modified.
4. CONCLUSIONS
1. In this study it is observed that types of interactions exist between drugs and ligands. The DFTB method was employed in this case as the molecules considered were in the form of ions that resulted in ion pair formation. This technique was used as it considers dispersion energies in addition to those calculated by DFT for further investigations. These theoretical calculations help select appropriate ionophores and also predict their selectivity for different drugs.
2. After a series of experiments involving the use of PSE-TPB ion-pair complexes along with several plasticizers in the membrane design, it was concluded that the Pseudoephedrine sensor exhibited excellent analytical performance characteristics. It demonstrated an advanced performance with a fast response time (~20s), lower detection limit of 9.0×10⁻⁶ mol L-1 and pH independent potential responses across the range of 4.9–6.5.
3. The high sensitivity of this sensor allowed for the determination of Pseudoephedrine in pharmaceutical analysis. The theoretical calculations are accurate and suitable methods to obtain interaction energies and therefore helped choose better ion pairs. Additionally, employing these methods finds the center of interactions in the target molecule and ionophore.
ACKNOWLEDGEMENTS
The authors are grateful to the Research Council of the University of Tehran for the financial support of this work.
References
1. American Society of Health-System Pharmacists (ASHP) 2008.
2. K. Milenkova, A. Dimitrovska, L. Ugrinova and S. Trajkovi-Jolevska, Bull. Chem. Technol. Macedonia, 22 (2003) 33.
3. L. Zhanga, Q. Hua, G.Chenb and Y. Fang, Anal. Chim. Acta 424 (2000) 257. 4. P. E. Flinn, S. Kenyon and T. P. Layloff, J. Liq. Chromatogr. 15 (1992) 1639. 5. H. N. Dogan and A. Duran, Pharmazie 53 (1998) 781.
6. S. S. Yang and R. K. Gilpin, J. Chromatogr. Sci. 26 (1988) 416.
7. M. R. Ganjali, T. Razavi, R. Dinarvand, S. Riahi and P. Norouzi, Int. J. Electrochem. Sci. 3 (2008) 1543
8. S. Riahi, M. F. Mousavi, S. Z. Bathaie and M. Shamsipur, Anal. Chim. Acta 548 (2005) 192
9. M. R. Ganjali, M. Hariri, S. Riahi, P. Norouzi and M. Javaheri, Int. J. Electrochem. Sci. 4 (2009) 295
10.M. R. Ganjali, T. Razavi, F. Faridbod, S. Riahi and P. Norouzi, Current Pharm. Anal. 5 (2009) 28 11.S. Riahi, M. R. Ganjali, P. Norouzi and F. Jafari, Sens. Actuators B 132 (2008) 13
13.S. Riahi, A. B. Moghaddam, M. R. Ganjali and P. Norouzi, Spectrochim. Acta Part A 71 (2008) 1390
14.S. Riahi, M. R. Ganjali, A. B. Moghaddam, P. Norouzi and S. S. Hosseiny Davarani, Spectrochim. Acta Part A70 (2008) 94
15.S. Riahi, M. R. Ganjali, A. B. Moghaddam and P. Norouzi, J. Theor. Comput. Chem. (JTCC)6 (2007) 331
16.F. Faridbod, M. R. Ganjali, B. Larijani, P. Norouzi, S. Riahi and F. S. Mirnaghi, Sensors, 7 (2007) 3119
17.H. Karami, M. F. Mousavi, M. Shamsipur and S. Riahi, J. Power Sources, 154 (2006) 298 18.S. Riahi, M. R. Ganjali and P. Norouzi, J. Theor. Comput. Chem. (JTCC) 7 (2008) 317
19.S. Riahi, M. R. Ganjali, A. B. Moghaddam and P. Norouzi, J. Theor. Comput. Chem. (JTCC) 6 (2007) 255
20.M. R. Ganjali, Z. Memari, F. Faridbod, R. Dinarvand and P. Norouzi, Electroanalysis 20 (2008) 2663
21.M. R. Ganjali, F. Faridbod, P. Norouzi and M. Adib, Sens. Actuator B 120 (2006) 119
22.M.R. Ganjali, P. Norouzi, R. Dinarvand, F. Faridbod, M. Moghlimi, J. Anal. Chem. 63 (2008) 684 23.M. R. Ganjali, P. Norouzi, A. Daftari, F. Faridbod and M. Salavati-Niasari, Sens. Actuator B 120
(2007) 673
24.M. J. Frisch, G. W. Trucks, H. B. Schlegel, G. E. Scuseria, M. A. Robb, J. R. Cheeseman, V. G. Zakrzewski, et al.,Gaussian Inc. Pittsburgh, PA, 1998.
25.J. J. P. Stewart, J. Comp. Chem. 10 (1989) 221
26.W. Yang, Q. Wu, Direct Method for Optimized Effective Potentials in Density-Functional Theory, Physical Review Letters, 2002.
27.R. G. Parr and W. Yang, Annu Rev. Phys. Chem. 46 (1995) 701
28.F. B. Duijneveldt, R. J. G. C. M. Duijneveldt-van de and J. H. Lenthe, Chem. Rev. 94 (1994) 1873 29.T. A. Nieaus, M. Elstner, T. Frauenheim and S. Suhai, J. Mol. Struct. (THEOCHEM) 541 (2001)
185
30.H. Y. Zhou, E. Tajkhorshid, T. Frauenheim, S. Suhai and M. Elstner, Chem. Phys. 277 (2002) 91 31.P. Hobza and R. Zahradnik, Intermolecular Complexes, Elsevier, Amsterdam, 1988.
32.M. J. Frisch, J. E. Del Bene, J. S. Binkley and H. F. Schaefer, J. Chem. Phys. 84 (1986)2279 33.D. W. Schwenke and D. G. Truhlar, J. Chem. Phys. 82 (1985) 2418
34.M. R. Ganjali, P. Norouzi, F. Faridbod, S. Riahi, J. Ravanshad, J. Tashkhourian, M. Salavati-Niasari and M. Javaheri, IEEE Sens. J. 7 (2007) 1138
35.M. R.Ganjali, P. Norouzi, F. Sadat Mirnaghi, S. Riahi and F. Faridbod, IEEE Sens. J. 7 (2007) 544 36.F. Faridbod, M. R. Ganjali, R. Dinarvand, P. Norouzi and S. Riahi, Sensors, 8 (2008) 1645
37.S. Riahi, F. Faridbod and M. R. Ganjali, Sensor Lett. 7 (2009) 42
38.M. R. Ganjali, P. Norouzi, M. Rezapour, F. Faridbod and M. R. Pourjavid, Sensors, 6 (2006) 1018 39.M. R. Ganjali, P. Norouzi, F. Faridbod, M. Yousefi, L. Naji and M. Salavati-Niasari, Sens.
Actuators B, 120 (2007) 494
40.F. Faridbod, M. R. Ganjali, R. Dinarvand and P. Norouzi, Sensors, 8 (2008) 2331
41.M. R. Ganjali, P. Norouzi, F. Faridbod, A. Sepehrifard, M. Ghandi and A. Moghimi, Can. J. Anal. Sci. Spec. 52 (2007) 46
42.V. K. Gupta, A. K. Jain and G. Maheshwari, Int. J. Electrochem. Sci. 2 (2007) 102
43.M. R. Ganjali, R. Nemati, F. Faridbod P. Norouzi and F. Darviche, Int. J. Electrochem. Sci. 3 (2008) 1288
44.V. K. Gupta, R. N. Goyal and R. A. Sharma, Int. J. Electrochem. Sci. 4 (2009) 156
45.M. R. Ganjali, M. Tavakoli, F. Faridbod, S. Riahi, P. Norouzi and M. Salavati-Niassari, Int. J. Electrochem. Sci. 3 (2008) 1169
48.V. K. Gupta, S. Chandra, S. Agarwal and H. Lang, Sens. Actuators B, 107 (2005) 762 49.P. R. Buck and E. Lindneri, Pure Appl. Chem. 66 (1994) 2527
50.M. R. Ganjali, M. Hariri, S. Riahi, P. Norouzi, and M. Javaheri, Int. J. Electrochem. Sci. 4 (2009) 295
51.M. R. Ganjali, B. Vesimohammadi, S. Riahi, and Parviz Norouzi, Int. J. Electrochem. Sci. 4 (2009) 740
52.F. Faridbod, M. R. Ganjali, S. Labbafi, R. Dinarvand, S. Riahi, and Parviz Norouzi, Int. J. Electrochem. Sci. 4 (2009) 772