Int. J. Electrochem. Sci., 5 (2010) 1018 - 1025
International Journal of
ELECTROCHEMICAL
SCIENCE
www.electrochemsci.org
EQCM and EIS Study of the Effect of Potential of Zero Charge
on
Escherichia Coli
Biofilm Development
Xuan-Hui Xie, Erin Lin Li, Zi Kang Tang*
Nano Science and Technology Program, Hong Kong University of Science and Technology, Clear Water Bay, Kowloon, Hong Kong
*
E-Mail: bionanoust@gmail.com
Received: 17 June 2010 / Accepted: 29 June 2010 / Published: 15 July 2010
Using EQCM method, the influence of electrode potential on Escherichia coli (E. coli) biofilm development was investigated in a range from −0.6V to 0.6V. Parabolic dependence of the cell density on the electrode potential was observed. The cell density of biofilm grown at different electrode potentials was also verified by optical microscopic images. Double layer capacitance was determined by EIS in the same range of potentials, based on which potential of zero charge (PZC) was estimated at 0.15 V. The relation between surface charge and potential was revealed based on PZC which enables mechanistic understanding of the parabolic dependence of cell density on potential. Electrode potential has dual effect on biofilm development in that positively charged surface at potential larger than PZC promoted the initial adhesion of bacteria onto electrode surface via electrostatic attraction but it impeded cell elongation and division in later steps of bacterial proliferation on the surface. Therefore, the highest cell density of biofilm was obtained at moderately positively charged electrode surface at 0.2 V.
Keywords: Biofilm development, potential of zero charge (PZC), E. coli, electrochemical quartz crystal microbalance (EQCM), electrochemical impedance spectroscopy (EIS)
1. INTRODUCTION
Bacterial adhesion to the surface of natural and manmade materials in the form of biofilm is a ubiquitous phenomenon that attracts intensive interest in recent years [1]. On one hand, biofilm formation is harmful in medical treatment, e.g., it enhances microbial drugs resistance [2] and corrosion of metals [3]. On the other, it is salutary in biofilm based water treatment reactors [4] where the biocatalytic power is accelerated by the formation of biofilm.
the first step of biofilm development, initial adhesion step was considered of essential importance [6]. There are a variety of factors that influence the initial adhesion of bacteria onto surface [9]. Surface chemical groups on bacteria and solid may give rise to specific attraction or repulsion force [10]. More generally, non-specific forces dominate the initial adhesion process [11]. Under physiological condition, bacterial cells often carry negative charges [12] on their surface which lead to electrostatic interaction with the charges on solid surface. Nevertheless, how bacteria respond to surface at different electrostatic conditions has not been systematically elucidated.
Electrochemical quartz crystal microbalance (EQCM) is an effective tool to study absorption phenomena [13, 14]. We have previously reported using EQCM to modulate and monitor biofilm development on gold electrode [15]. In this work, we systematically investigated the influence of surface potential on biofilm development. Using EQCM method, E. coli biofilm development was recorded by the resonant frequency shift at a series of electrode potentials from −0.6 V to 0.6 V. The final cell density on the electrode was also verified by optical microscopic observation. Furthermore, using Electrochemical Impedance Spectroscopy (EIS) double layer capacitance of the electrode was determined from −0.6 V to 0.6 V. Based on the results of double layer capacitance, potential at the point of zero charge was estimated. Thereby, mechanistic insight into the biofilm development at different electrode potential was gained.
2. EXPERIMENTAL PART
2.1. Bacterial preparation
Wild type E. coli culture was grown under aerobic condition in Luria-Bertani (LB) medium (Peptone, 10 g/L; yeast extract, 5 g/L; NaCl, 10 g/L) at 30 °C at 150 rpm. The growth of E. coli was monitored by Optical Density at 600 nm (OD600) using Ultrospec 4300 pro UV/Visible
Spectrophotometer (GE) with cuvettes of 1-cm path length. Culture was harvested at mid log-phase and diluted with fresh LB medium. Bacterial concentrations were adjusted for each experiment to give a final concentration of OD600 =0.3 for immediate use. All chemicals are analytical grade and used as
received from Sigma Aldrich.
2.2. EQCM and EIS characterizations
As shown in Scheme 1, three-electrode configuration was adopted for electrochemical characterizations. Circular gold-coated quartz crystal electrode (diameter 6mm, CHI 125A, CH Instruments) with a fundamental frequency of 7.995 MHz was used as working electrode. Pt wire and Ag/AgCl (saturated KCl) were used as counter and reference electrode, respectively. Prior to use, working and counter electrodes were cleansed with piranha solution (70% H2SO4 and 30% H2O2) and
adaptation experiments were performed at 22 °C. All potentials were referred to Ag/AgCl (saturated KCl).
Scheme 1. Experimental setup of EQCM chamber consisting gold-coated quartz crystal working electrode, reference electrode and counter electrode.
Before introducing into the electrochemical chamber, E. coli culture and the chamber were thoroughly purged with nitrogen streams to create anaerobic condition. EQCM (CHI 440A, CH Instruments) modulated E. coli biofilm experiments were conducted at −0.6V, −0.4V, −0.2 V, 0 V, 0.2 V, 0.4V and 0.6V. EIS measurements were taken at potentials in the range between −0.6V and 0.6V using PAR 283 potentiostat (Princeton Applied Research) in combination with Frequency Response Detector (PAR 1025, Princeton Applied Research). 10 mV AC potential was applied at the specific potential (e.g., 0.6 V) over a frequency range from 100 kHz to 10 mHz. Double layer capacitance was determined by fitting an equivalent circuit model using Z-View software.
2.3. Microscopic observation of biofilm on electrode
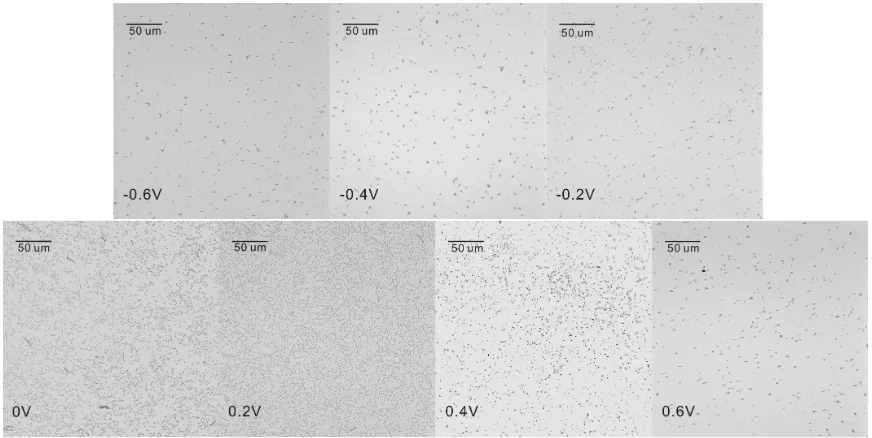
After 150 h biofilm development experiment under static condition, the working electrodes were taken out of the electrochemical chambers and rinses three times with Milli-Q water to make sure that the remaining cells were firmly attached to the electrodes. The surface colonizing biofilm cells were then observed under Olympus BX51 microscope. Images were captured with 500 × total magnification.
3. RESULTS AND DISCUSSION
3.1. Biofilm development at different electrode potentials modulated by EQCM
[image:4.612.113.499.270.558.2]
change on the electrode due to adhesion of bacteria [15]. In this study, E. coli cells were cultured in anaerobic and static condition in EQCM chambers. The gold-coated quartz crystal electrode (working electrode) was artificially controlled at −0.6V, −0.4V, −0.2 V, 0 V, 0.2 V, 0.4V and 0.6V. Biofilm development on the working electrode of different potentials was monitored as the resonant frequency shift in these conditions. Experiment at each potential was done in triplicate and only representative microscopic images were demonstrated. Fig. 1 shows the final resonant frequency shift on the working electrode at different potentials from −0.6V to 0.6V. Given that the negative frequency shift corresponds to increase of mass attached to the electrode surface as dictated by Sauerbrey equation [17], cell density exhibits a parabolic dependence on electrode potential. The highest cell density of biofilm was achieved at 0.2 V. The cell density decreased when bioflim was grown at potentials deviated from this value.
Figure 1. EQCM results of biofilm development at different electrode potentials. Resonant frequency shift at −0.6V, −0.4V, −0.2 V, 0 V, 0.2 V, 0.4V and 0.6V. Error bar represents standard deviation, n=3.
3.2 Microscopic images of biofilm grown at different potentials
surface are remaining. The electrodes were then observed under optical microscope. As shown in fig. 2, microscopic images of cell density are consistant with the frequency results. Since E. coli cells carry negative charges in phisiological condition [12], it is not surprising to find that the cell density at negative potentials is low due to electrostatic repulsion force. It is interesting to know why 0.2 V gave rise to the highest cell density. Why not other value?
Figure 2. Optical microscope images (500 x total magnification) of E. coli cells (at 150 h) at the electrode potential of −0.6V, −0.4V, −0.2 V, 0 V, 0.2 V, 0.4V and 0.6V.
3.3 EIS of double larger capacitance of electrode at different potentials
To understand the parabolic dependence of biofilm cell density on electrode potential, we evaluated the surface property of electrode. The electric field in the proximity of electrode is determined by the electric double layer at the electrode-medium interface.
It could directly lead to qualitative judgment of the type of interaction (attraction or interaction) between bacteria and surface if we know the type of charges on the surface. Unfortunately, it is experimentally difficult to directly measure the charges on the surface. Instead, indirectly methods are available such as estimation of PZC from EIS measurement [18]. PZC is an expedient marker of surface charges, which is critically relevant to absorption of electrolyte [19]. It denotes the potential when the surface carries zero charge. Normally when electrode potential is larger than PZC, the electrode carries positive charges and when it is smaller than PZC, the electrode carries negative charges. In this study, we used EIS to determine PZC of the gold coated electrode in pure LB medium without E. coli at different potentials in the range from −0.6V to 0.6V.
[image:5.612.88.524.170.389.2]
3B shows the equivalent circuit model. Since the electric double layer of most solid does not behave as ideal capacitance, a constant phase element (CPE) is employed to fit the double layer capacitance with the phase angle usually slightly smaller than 90°. R1 and R2 represent solution resistance and
polarization resistance, respectively. Since LB medium is not electrochemically active, the impedance results reflect non-faradic processes determined by the double layer at different electrode potentials.
Figure 3. (A) Nyquist plot of EIS of electrode in pure LB medium without bacteria at −0.6V, −0.4V, −0.2 V, −0.15 V, −0.1 V, −0.05 V, 0 V, 0.05 V, 0.1 V, 0.15 V, 0.2 V, 0.4V and 0.6V.(B) Equivalent circuit model used to fit EIS results.
3.4 PZC and its implication on biofilm development
[image:6.612.110.505.170.579.2]
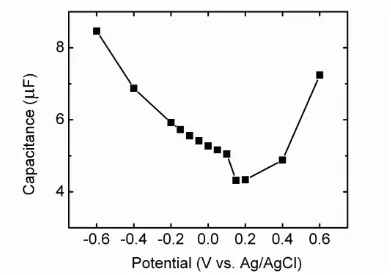
obtained at 0.15 V. This result suggests that PZC of the gold coated working electrode in this study is ca. 0.15 V. Therefore, electrode surface carried positive charges when the electrode was maintained at potential larger than 0.15 V and it carried negative charges when the electrode was maintained at potential smaller than 0.15 V. Biofilm development on the electrode at different potentials could then be perceived from the point of view of surface charge interaction. When electrode was maintained at potential smaller than 0.15 V, E. coli cells experience repulsion force in initial adhesion step. The more negative the electrode potential was, the larger repulsion force E. coli cells would experience. As a result, the cell density of biofilm decreased on the left arm of parabolic curve in Fig. 1.
Figure 4. Fitted double layer capacitance at −0.6V, −0.4V, −0.2 V, −0.15 V, −0.1 V, −0.05 V, 0 V, 0.05 V, 0.1 V, 0.15 V, 0.2 V, 0.4V and 0.6V.
[image:7.612.112.503.220.495.2]
effect is the electrostatic interaction that dictates the initial adhesion step. The secondary effect is the binding force that inhibits cell elongation and division in subsequent proliferation steps on the surface.
4. CONCLUSIONS
The parabolic dependence of cell density of biofilm on electrode potential was investigated from the angle of PZC by EQCM and EIS methods. Biofilm development at potential larger than PZC may be promoted in initial adhesion step but inhibited in later proliferation steps.
ACKNOWLEDGEMENTS
This work was supported by HKUST Allocation for School Based Initiative SBI 07/08.SC07.
References
1. L. J. Douglas, Trends Microbiol., 11 (2003) 30.
2. P. S. Stewart, M. J. Franklin, Nat. Rev. Microbiol., 6 (2008) 199. 3. R. Melchers, R. Jeffrey, Electrochim. Acta, 54 (2008) 80.
4. N. Qureshi, B. A. Annous, T. C. Ezeji, P. Karcher, and I. S. Maddox, Microb. Cell. Fact., 4 (2005) 24.
5. G. O'Toole, H. B. Kaplan, R. Kolte, Annu. Rev. Microbiol. 54 (2000) 49. 6. S. Hahnel, M. Rosentritt, G. Handel, R. Bürgers, J. Dent., 36 (2008) 977. 7. P. Takhistov, B. George, Bioproc. Biosyst. Eng., 26 (2004) 259.
8. I. W. Sutherland, Microbiology+, 147 (2001) 3.
9. N. P. Boks, W. Norde, H. C. van der Mei, H. J. Busscher, Microbiology+, 154 (2008) 3122. 10.H. J. Busscher, B. van de Belt-Gritter, R. J. B. Dijkstra, W. Norde, F. C. Petersen, A. A. Scheie, H.
C. van der Mei, J. Bacteriol., 189 (2007) 2988.
11. H. J. Busscher, W. Norde, H. C. van der Mei, Appl. Environ. Microb. 74 (2008) 2559.
12. R. Edgar, E. Bibi, EMBO J., 18 (1999) 822.
13. A. Méndez, P. Díaz-Arista, L. Salgado, Y. Meas, G. Trejo, Int. J. Electrochem. Sci., 3 (2008) 918. 14. Michael E.G. Lyons, Serge Rebouillat, Int. J. Electrochem. Sci., 4 (2009) 481.
15. X. H. Xie, E. L. Li, Z. K. Tang, Electrochem. Commun. 12 (2010) 600.
16. D. E. Nivens, J. Q. Chamber, T. R. Anderson, D.C. White, Anal. Chem., 65 (1993) 65. 17.G. Sauerbrey, Z. Phys. 155 (1959) 206.
18. Y. Yu, G. Jin, J. Colloid Interface Sci., 283 (2005) 477. 19. S. A. Abd El-Maksoud, Int. J. Electrochem. Sci., 3 (2008) 528.
20. B. Gottenbos, D. W. Grijpma, H. C. van der Mei, J. Feijen, H. J. Busscher,J. Antimicrob. Chemoth., 48 (2001) 7.