COMMISSION OF THE EUROPEAN COMMUNITIES
Brussels, 28.10.1998 COM(1998) 614 final
TRANS-EUROPEAN TRANSPORT NETWORK
1998 REPORT ON THE IMPLEMENTATION OF
THE GUIDELINES
AND
PRIORITIES
FOR
THE FUTURE
Report from the Commission to the European Parliament,
the Council, the Economic and Social Committee and
the Committee of the Regions
1998 lRE.POJRT ON THE IMPLEMENTATION OF THE GUIDELINES AND PRUORJTIES FOR THE FUTURE
Report to the European Parliament, the Council, the Economic and Soci~l
( :ommittee and the Committee of the Regions on the implementation of the guidelines for the dcvelopmci1t of the trans-European transport network (Decision 1 692/96/EC)
Contents
_ · ExecutiveSummary
1. Introduction
The TEN Strategy~ compditivencss and jobs
2. Recent trends in infrastructure development
3. Implementation by mode and sector
3.1 Modal networks 3 .1.1 Road network 0 3.1.2 Rail network
3 .1.3 Inland waterway network and inland ports 3.1.4 · Seaports
3. 1.5 Airports
3.
i
_.6 Combined transport network3.2 Traffic management and navigation systems 3.2.1 Road traffic management
3.2.2 European Rail Traffic Management System (ERTMS)
3.2.3 Trartic Management and Information for inland waterway navigation 3.2.4 Vessel Traflic Management Information System (VTMIS)
3.2.5 Air Traffic Management (ATM)
3.2.6 Global Navigation Satellite System (GNSS)
3.3 Horizontalissues 3.3 .1 Interoperability
3.3.2 Research and Development (R&D) 3.3.3 Environmental protection
3.3.4 Connection with third countries
4. Funding
4.1 TEN investment and funding
4.2 Development of the fourteen specific TEN projects 4.3 Public Private Partnerships (PPP's)
5. General assessment
EXIECUTRVE SUMMARY
This is the lirst implementation report on the Trans-Europcan Transport Network, as required by the
TJ·:N-T guidelines (Decision I6<J2/96/EC1). It is also the starting point for the first revision of the
TI·:N Transport guidelines, because it is desigmxl to start a broad consultation process to identify the changes that need to he made. The final section of this _report therefore sds out I he broad issues to consider in the revision process.
The overall picture is one of significant activity in difficult circumstances. The combination of low growth and fiscal consolidation in the period in question means that infrastructure spending overall has been below the long-term trend. As regards the 14 specific projects in Annex III of the guidelines ("the Essen projects") there has been significant progress, with three close to completion, 8 under construction or at a very advanced stage of preparation and most likely to be completed by around 2005. Looking ahead, Member States' plans suggest a significant increase in construction activity on the I 4 projects in the early years of the next century which will require increased financing by all p_arties concerned.
The main impact of the TEN-T will be to improve the competitiveness of the European economy, by ensuring that the Single Market is supported by an integrated transport system. This will be vital for sustainable growth. The main employment effects of the TEN-T will also be felt in the long tenn, due to this structural increase in European competitiveness, though sigFlificant numbers of temporary jobs are generated in the construction period.
Against this background, it is clearly essential for Member States to stick to their plans for increased investment in the 14 Essen projects (including through public-private partnerships), and find the necessary finance to do so. In order to achieve the guidelines objectives of completing the network by 2010, Member States will also be required to intensify their efforts on the TEN-T as a whole. It
will also be important to ensure adequate funding at EU level, through the range of Community Financial instruments, notably the TEN Budget itself, for which the Commission envisages an allocation of 5 BECU from 2000-6.
Some of the key conclusions of the report are:
total investment in a TEN-T in 1996-7 was 38,4 BECll. The estimated total costs of the projects concerned is 307 BECU, making up approximately 2/3 of the total schemes envisaged in the guidelines.
total support from Community funds and the Em amounted to 12,6 BECU, representing roughly 304% of the total investment;
39% of total investment in the period went on rail, 38% on roads and 15% on airports. Around 60% of the TEN-T budget goes to rail, compared to 15% on roads.
Nearly 2/3 of the rail investment was devoted to high-speed lines, although in terms of distance the upgrading of conventional rail was predominant in the 1800 km completed.
More than 54% of the road construction on the TEN related to upgrading of existing roads rather than new routes.
1
Decision 1692/96 of 23/08/96 ; OJ L 228 of 9/9/96.
The report also identifies progress in applying new technology to the TEN-T (Intelligent Transport Systems, ITS). ln particular, the research undertaken within the 41h Framework Research Programme
and olhL:r H.! J rL:scan:h programmes is starting to hear fruit with a clear move from research and
tkvelopmcnl to the implementation phase. Similarly, the development of a European Rail Traffic Management System (ERTMS). is close to realisation, offering the possibility of substantial safety and capacity improvements on the TEN-T rail network. In the field of satellite navigation, work to develop a European component for a Global Satellite Navigation System (GNSS) has advanced to a
stage where a strategy can be laid down for further action. ·
The period has also seen a number of important trends, in particular, the growing emphasis given to the development of more environmentally friendly transport systems, where the EU budget has had a beneficial impact, and the use of public private partnerships to accelerate implementation of infrastructure projects of all sizes.
One important conclusion from preparation of the report is that there is a need for a more systematic approach to data collection on transport infrastructure investment in the EU, to enable the EU and Member States to follow the development of traffic and infrastructure capacity to support policy decisions, including changes to the TEN-T guidelines .. This will be a priority in the coming period. The report also:scts out some of the key issues that wi II need to be looked at in the preparation of the . .
White Paper on revision of the TEN-T guidelines that is due to be published next summer, and which will be followed by a revision proposal in the course of2000.
The main areas identified are:
how best to set priorities for investment in the TEN-T, particularly once the 14 Essen projects have been completed;
how to shift the focus from infrastructure investment to quality of service;
how to integrate the modal networks, so that travellers are encouraged to use the most effective mix of forms of transport, rather than a single mode;
how to encourage the use of Intelligent Transport Systems to allow more efficient use of existing infrastructure;
how to take account in the guidelines ofthe forthcoming accession of new Member States; how to further strengthen the environnJental dimension of the guidelines.
·On this basis, the Commission hopes to stimulate a constructive debate on the future of the TEN-T in general, and priorities to revise the guidelines in particular.
~yone who wishes to put their views forward should send them to: DGVII/A/2
The Directorate General for Transport, European Commission
Rue de la Loi 200 (BU-33 04/05) B-1 049 Brussels
INTRODUCTION
This report provides a first assessment of the development of the trans-European transport network (TEN-T) following the TEN-T guidelines set out in Decision 1692/96/EC. The guidelines are addressed primarily to the Member States and, where specified, to the Commission. They constitute a general reference framework for the implementation ofthe network and identify projects of common interest, which arc to be completed by 2010.
Article 18§~ of the Decision requires the Commission, with the assistance of the Member States, to report on the implementation of the guidelines every two years. The report follows the structure of the guidelines Decision. It takes stock of the information available and summarises the main facts and trends in the development of the network in 1996 and 1997. The data collected will be made available in a Commission services working paper indicating developments on individual sections of the network. The main trends concerning TEN-T funding are covered in the present document. Other Commission documents referring to TEN-T include the annual report on TEN-T financing pursuant to Art. 18 of Council regulation (EC) N° 2236/952 and the annual Cohesion and Structural Fund reports-'. A report on the progress of the projects included in Annex lii of the Decision was presented at the occasion of the European Council at Cardiff (COM (98) 356 final) of June 3 this year.
In order to have as complete a picture as possible of TEN-T development, the Commission has worked in co-operation with the TEN-T committee (Article 18 of the guidelines) and national administrations. A survey was undertaken for each transport mode. However, the information available was not always complete nor compatible. In particular the quality of the information varied significantly from country to country making an overall evaluation difficult. For this reason, and since this is the first report, comparisons between different Member States should be made with caution. Moreover, there were discrepancies between the financial data supplied by the Member States, which in some cases related to multiannual programs covering a period longer than 1996/97. Future reports will benefit from work being undertaken to harmonise definitions and build a database which comprises available information on TEN-T.
It should also be noted that comparison with the situation prior to the adoption of the guidelines is somewhat problematical, as there is no information specifically dedicated to the TEN-T. Data concerning the situation before 1996 derives from different sources, mainly ECMT reports and general transport statistics. Furthermore, given the short time period of only two years it is difficult to identify long-run trends in infrastructure development.
The final section of the report seeks to identify areas where changes to the guidelines may be desirable. This is intended to launch a broad consultation process leading up to a white paper on revision to the guidelines in 1999. ·
2
O.J L228 of23.9.95
3
Annual report on the Cohesion fund 1996 COM (97) 302
The TEN Strategy: competitiveness andjobs
The rationale l(w the C'oni1~1unity's Trans-European Nctwo;-k policy is twol(lld :
• cllicicnl infrastructure li.lr transport is vital lt)f I·:U compclilivcncss, ami thus long-term growth and jobs. EU industry needs cfncicnt transport systems both to keep costs down and to allow it to provide a good service; ·
~~~ to enhance economic and social cohesion by ensuring that peripheral regions are well connected to EU Networks~ Work done for the Cohesion Fund points to a positive correlation between spending on TEN and private business investment suggesting a very favourable impact from new infrastructure investment, including a strong positive effect on employment in the long term. It is very difficult to make direct estimates of the employment impact of the TEN-T network. Though they create significant numbers of temporary jobs during the construction phase, it is their long-term impact on ecOnomic growth and competitiveness that is cruciaL And the extent of the impact will depend on whether other key competitiveness , factors - approp~~ate macro-economic policy, entrepreneurial culture, highly trained workforce- are in place.
On very cautious assumptions Commission services estimate that the Transport TEN as a whole (investment of 400 Bccu) could increase Community GDP by over 500 Becu by 2030 creating between C>OO.OOO and 1.000.000 new permanent jobs, or 2.5 additional jobs per mecu invested in TEN instead of the average alternative investment. If it were assumed that a higher share of growth ·went in employment rather that wages, or if this investment was not assumed to crowd out other productive investments (a reasonable assumption with the ElJ economy .
ai
under-capacity) the job . impact could be very significantly more, rising. to as much as 5 million jobs.It is more straightforward to estimate the extent of temporary job creation during the construction phase, which, though not the main objective of TEN policy, is still very significant. Studies undertaken at Member States level calculated the temporary employment effects on four of the specific projects4 in terms of man/years generated for each BECU of investment. These effects were , estimated between 14 000 and 24 000 man/year. Using these assumptions, the total employment on
TEN could be estimated between 270 000 and 460 000 man/year during 1996/97. ·
2 RIECIENT TRENDS BN IINFRASTIRUCTURIE DEVli:ILOPMENT
As this is the first_ TEN-T implementation report it is useful to recall some of the main transport trends. Traffic in Europe has increased significantly in the last decade with an average annual growth rate of 2,8% in goods transport and 3,2% in passenger transport. Investment in transport infrastructure also grew significantly. From 1985 to 1994 annual investment in rail, road and inland waterway infrastructure increased by 45%5• However, as indicated in Figure 1, the overall trend for
the period contrasts with a notable decline of investment starting in 1994. In 1995, investment in infrastructure decreased by no less than 7%. Although data on transport infrastructure is not yet . available from ECMT for 1996/97, indications from broader surveys6 suggest a modest recovery 1n-~ construction from 1997. Member States plans, particularly on the 14 specific projects imply a significant increase in investment in the coming years ..
4
Berlin- Niimberg, PBKAL Channel Tunnel rail link, PBKAL Ki:iln- Frankfurt ; TGV Est, 0resund fixed link. Sund & Bra Information on the fixed link across the 0resund; Germany: Gesamtwirtschaftliche Bewertung von
Verkehrswegeinvestitionen, Schriftenreihe Bundesminister fiir Verkehr,-Heft 72, 1993 5
All data in real terms .
6
FIEC: Federation de I'Jndustrie Europeenne de Ia construction« l'activite de Ia construction en Europe» June 1998.
!F'ngllllll"C n: Trame andl iiiDVCstme.nt growth Dill tll"al!lSIPOrt HlrD geliDeraD {1985= 1 00) 7
160
passengers~ ...
·:::..
investment
120
100
--- - - --- - - - 'A numher of major developments in the late 1980's and early 1990's account for the nse tn infrastructure expenditure in that period, notably:
• the construction of major projects such as the Channel Tunnel;
• the continuation of the high-speed (HS) rail programme in France, Germany and Spain. In particular the opening of the TGV Atlantic in 1990, of the HS lines Hannover-Wiirzburg and Mannheim-Stuttgart in 1991, of the HS line between Madrid and Seville in 1992, of the TGV Nord in 1993, and, ofthe section Lyon-Valence in 1994 (about 1500 km of new HS lines); • the accession of Spain and Portugal to the Community (both countries commencing major
infrastructure programmes) and the German re-unification.
By contrast, the downward trend in infrastructure investment starting in the mid 90's appears to be related to the following factors:
• a slowdown of economic growth in most EU countries allied to a policy to tighten controls on government spending;
• a greater emphasis on environmental concerns with a consequent slippage in the progress of schemes;
• the completion of major projects which were not followed by new construction programmes.
7
Figures extrapolated from ECMTdocument CS (98)12, ECIS «State of the Infrastructure in Europe» Rotterdam 1996 and DGVIVEurostat Statistical Pocket book, Brussels 1998.
3 IMPLEMENTATION BY MODE AND SECTOR
3.1 MODAL NETWORKS
This section examines the main developments of the modal networks of the TEN-T as outlined in Annex I of the guidelines Decision.
3.1.1 Road network
The primary road network in the EU comprises some 280 000 km of motorways and main inter-urban roads8. The TEN road network includes some 74 500 km, ofwhich 27 000 km are shown as "planned"9 to be completed by the year 2010. Of these, about 20 000 km are currently covered in Member States' plans submitted to the Commission and set out in the table below. Two thirds of the existing network consist of motorways (dual carriageways) and one third is designated as ''high quality roads", which includQs some single carriageways. Although the TEN road network itself accounts for only a quarter of the total length of the EU primary network, national road statistics underline its importance: in Germany and Denm?rk, for example, the TEN road network caters for about one third of total road passenger traffic (passenger/km); in the UK, roughly half of total freight
transport (in tonnes/km) involves TEN roads10. . ·
. Table 1: Development of TEN roatdlnetwo~rk in 1996/97 (in km) projects ll!lotftfiied by the Member States
Total length Under of which under of which currently development11 constmction completed
planned
BeRgium 171,4 159,4 104,0 17,0
Denmark . 238,0 227,0 131,0 77,0
Germany 3390,5 2938,6 345,012 440,0
·Greece 3900,0 2038,0 n.a n.a
Spain~ 2385,0 2354,2 1518,0 506,0
France 3152,5 2232,5 1607,0 247,0,
Ireland 147,6 147,6 84,6 63,0
Italy 2170,7 1226,8 1217,2 1,1
Luxembo&g 53,1 20,6 20,6
-The Netherlands ' 220,0 165,0 95,0 35,0
Austria 118,7 \_ 74,6 41,1
-Portugal 1406,0 611,0 385,0 184,0
Finland 760,0 760,0 280,0 292,0
Sweden 1021,0 392,0 176,0 172,0
United Kingdom 1303,0 1181,0 974,0 118,4
Total TlEN 20437,5 14528,3 6978,5 2152,5
x Source: EU Transport figures. Statistical Pocket Book 1998, EC-DG VII-EUROSTAT, Brussels
9
The term planned covers all stages of an infrastrUcture project of common interest, from preliminary studie~ until construction (c. f. Decision 1692/96, p8 op cit.). In the outline plans, the planned links are shown as interrupted lines.
10
Source Western European Road Directors. .
11
Under development relates to links on which investments occurred in 1996/97 : construction and studies.
12
For Germany, this table includes only new construction.
During 1996/97, more than 14 520 km of roads were under development. Of this, approximately
7000 km were under construction (newly built or upgraded) and more than 2150 km of new and upgraded sections were completed lJ.
Though tl1c quality of in/ormation concerning the status of the roads is variable, the table below shows that the "planned" TEN road network is made up largely of existing roads which are to be upgraded to a higher standard (54% of the length). The remaining 46% involves the construction of new roads. A significant share of the projects of common interest also involves improving transport conditions (capacity, safety, etc.) without increasing the length ofthe TEN road network.
Table 2. New construction(%)- fr?m data notified by the Memlber States
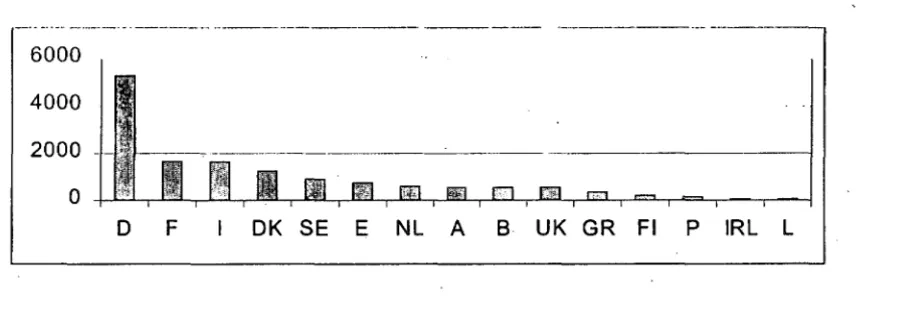
The investment in the TEN roads in 1996/97 amounted to U4,6 IBECU. France and Germany accounted together lor about half of the amount, while Spain accounted for 12«Yo and Greece lor 9%. The total cost of the projects (from figures made available to the Commission) is estimated at about 81,9 BECU (see Figure 3), however the data do not cover all the projects identified as "planned" in the guidelines Decision.
Figure 2: Investments in the TEN road network by country in 1996/97 (in MECU),
. - - · . - · · - · · · - · · · - · - · - - · · - - · · · - - · - · - - - ,
2000
1000
t0
I
I
I
I
I
II
-(MECU)
D
F
E GR DK
P SE UK iRL Fl
B NL
A
L
_Figure 3: Estimated total cost ofTEN road projects {in MECU)
20000
15000
10000
5000
0
, ..MECU
F
D GR
E
SW OK
P
NL
UK
Fl
A
IRL
B
L
'
·-·-·-··--~·---- - - ·--- · ·
-13
[image:9.549.19.519.287.674.2]The l4.lllowillg cxan1plcs l(lr cross-border links illustrate till~ progress achieved in 199(1/97;
The completion of the final section (9 km) of the IE40 at the border betweel!D France and Belgium eliminated a critical missing link between the two countries and provided a direct connection to the Channel Tunnel;
A new 63 km-long section of the A43 motorway currently under construction will link the French and Italian motorway networks via the Frejus tunnel. The project started in 1993 and is expected to be completed in 2000;
The 0resund (16 km) rail/road fixed link will connect northern Scandinavia (Sweden and Norway) to the continental rail and road network via Denmark. The Danish road sections, including the new motorway access on the island of Amager, arc already completed. Swedish road access and the project as a whole will be completed in 2000.
3.1.2 Rail network
[image:10.540.56.495.279.378.2]The rail networks of the 15 EU Member Stales have a total length 14 of 156.000 km of which some 78.600 km15 are designated as the trans-European railway network in Annex I of the guidelines (see table 3 below).
Table 3: TEN-T rail network
New HS lines Upgraded HS lines Conventional lines
Existing (km) 2 600 2 300 48 400
Planned (km) 10 000 14 000 l 300
Total (km) 12 600 16 300 49 700
In the period 1985-1995. investment in rail infrastructure in Europe rose by over 25% compared to the previous ten years. During this period much of the investment was devoted to high speed (HS) construction programmes in France, Germany, and Spain. While some 1553 km of HS lines were opened between I 990 ami 1993 (with an average of approximately 400 km per year), only 460 km were opened, or close to completion, between 1994 and I 998 (with an average of less than I 00 km per year).
During 1996-7, investments in the TEN rail network totalled 15,1 BECU: .one third was· invested in Germany while France and Italy accounted for about 11% each .. More than 68% of the total of the investment was devoted to, HS lines16• Most--of the .projects notified were in an early stage of
development in 1996/97. ·
14
Only main lines, source: EU Transport figures. Statistical Pocket Book 1998, EC-DG VII- EUROSTAT, Brussels.
15
DG VII estimates · .
16
For instance in France more than
9o%.
--·· -··--·· · · · -6000
4000
2000 -- •. - - 7
-0 :rr
0 F OK SE E NL A B UK GR Fl P IRL L
Major improvements in the TEN HS network arc f(lresccn in the coming years: it is expected that
X(,) kill of new liS lines and more than 2000 k111
or
upgraded liS lines will he completed by 2003(sec tables 4 and 5 ). Investment look place on about 401Yu of the length idcnti lied as "planned" in the
Guidelines during 19%/97 (see tables 4 and 5). According to the forecasts for the completion of the projects, it appears that from 1998 to 2003-5, investment in the TEN rail network will increase as a significant number of projects reach maturity. Most of the rail projects- in particular the HS lines-are likely to be completed by the second half of the next decade. After 2007, however, the number of projects still under construction may decline with a large majority of them being completed by 2010. The total cost ofthe rail projects is estimated at about 185,6 BECU.
Figure 5: Estimated total cost ofTEN rail projects per country, in MECU
60000
40000
20000
0
D
F
E NL A UK SW OK 8 GR P
Fl IRL L
[image:11.542.27.488.46.201.2]____ Table 4: Development of TEN rail network in 1996/97 (in km) - projects notified by the Member Statcs17
---.-··· .---.
Total length llnder l~l which liS lines/ t~/' which
currently development 19 llpgraded liS lines conventionallines211 "planned" 18
Belgium 273,2 273,2 125,0
-Denmark 714,0 714,0 176,0
-Germany21 · 3472,0 3472,0 2030,0 533,0
Greece 1649,0 1511,0 582,0 919,0
Spain 5498,0 4792,0 592,0 n.a
France 5573,5 3303,5 293,5 346,0
Ireland 1080,0 1080,0
-
1080,0Italy 5312,0 35777,0 1558,0 1305,0
Luxembourg 46,0 46,0
-
46,0The Netherlands 562,5 342,0
-
160,0Austria 1186,0 1079,2 671,4 323,8
Portugal 908,0 7?~
-
538,0· - - -·--
··-Finland 1044,0 1044,0
-
'1044,0
--Sweden 4879,0 4712,0 3066,0 401,0
United Kingdom 1408,0 1408,0 850,0 150,0
Total TEN 33605,2 28131,9 9943,9 6845,8
Conventional network
Upgr~ding the conventional rail network aims to improve quality, in terms of speed (specific measures are also undertaken to allow the use of tilting trains) and capacity as well 'as safety. More than 6000 km of conventional lines were under development in 1996/97 and the 'upgrading of these lines accounted for more than 3,6 BECU- about a quarter of the rail investment over the period. The improvements to the TEN conventional network relate in particular to:
· elcctri fication;
route alignment and double tracking;
loading gauge improvement in order to favour combined transport;
. axle weight improvement (in particular in the Nordic countries, to allow longer a.11d
·heavier freight trains); ·
. signalling and traffic control systems (see section 3.2.2).
17 Projects under construction or completed . . .
18
The figures also in~;lude lines shown as "existing" in the annex I of the guidelines on which:upgrading works were undertaken in 1996/97.
19
"Under development" relates to links on which investment occurred in 1996/97 : construction. or studies.
20
N<:w wnstruction and upgrading.
21
Including the magtl<:lic levitation truin.
[image:12.541.33.525.51.694.2]HS 11etwork
The HS network consists of new lines specifically designed for speeds of250 km/h and higher and of specially upgraded lines for speeds of the order of 200 km/h (less for certain limited sections). France in particular has pursued the construction of an entirely new HS infrastructure which will be supplemented on the less important axes by lines specially adapted for HS and the use of tilting trains. Other Member States - notably Germany and Spain - have chosen to mix new lines with upgraded infrastructure lines where the traffic_ volumes and/or the extra capacity available do not justify completely new HS lines. MS such as the UK and Finland have preferred to base their HS
network mainly or entirely on upgraded HS lines.
In some countries, the need for new HS infrastructure has been called into question by the development oftilting-train technologies, especially in cases where the economic viability of the HS speed line is low. However, some important cross-border US rail projects have progressed significantly in 1996/97:
Belgian section of the PBKAL between Brussels and the French border. Linking the capitals of Paris and Brussels, it represents the first newly built HS line which connects two HS networks. The journey time from Paris to Brussels has been reduced by around 50% and subsequently the market share
of
rail has risen from 25% at the beginning of 1996 to around 40% at the end of 1997;the Amsterdam-Belgian border link (also a branch of the PBKAL), which was approved in 1996 and should be completed by 2005;
in Germany, works on the 69 km Aachen-KOin section of the PBKAL (upgraded line) have started and due to be completed by 2007.
Some HS projects contribute substantially to tpe completion of the national network by linking major conurbations, for example:
in France, the 255 km line from Valence to Marseille and Nimes has reached an advanced stage of construction. The project represents more than 90% of the TEN rail infrastructure investment in France in the years 1996/97. The line is planned to be in service by 2001 when it will allow travelling times of 3 hours between Paris and Marseille;
in Italy, works progressed on the ne~ HS .line between Rome and Naples (204 laTI) which will form the backbone of the new Italian HS network and cut travel times by around 50% by 2001;
in Germany, progress was made on the construction of the 177 km HS link between Koln and Frankfurt {operational in · 2000), while major upgrading works were carried out on the 200km section between Berlin and Halle/Leipzig and 117 km section between Leipzig and Dresden.
..,-.,. ... ~ .. ~ ... ;;; .. -~ ... - -~"'"'·•:t ... ,. • .. -.
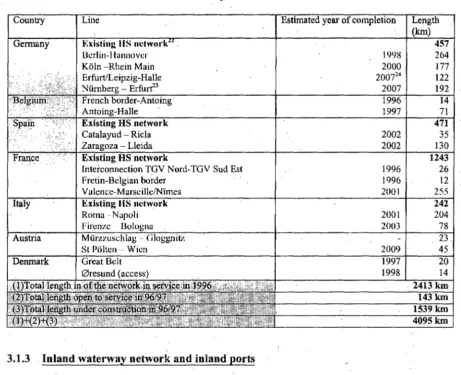
Table 5: New HS lines under construction or opened in 1996/97
2002 35
2002 130
Existing HS network 1243
Interconnection TGV Nord-TGV Sud Est 1996 26
Fretin-Belgian border 1996 12
Valencc-Marscillc/Nimes 2001 255
Existing liS network 242
Roma -Napoli 2001 204
Fircnzc 2003 78
3.1.3 Inland waterway network and inland ports
Investment in inland waterways has continued to decline in real terms over the last 20 years although inland waterway transport has grown by 16 per cent over the same period25. The TEN planned inland · waterway network comprises 42 sections with significant shortcomings. Of these, 22 sections are under construction, 2 sections arc in planning and for 16 sections studies arc being carried out. Expenditure undertaken in the years 1996 ahd 1997 amounted to some 1,028 BECU and the total estimated up to the year 2010 is 14 8ECU. Most of the works concerned upgrading, notably for water depth and locks, in order to increase all year reliability. Around 85 per cent of the investment in 19WJ aild 1997 was undertaken in Germany. EU,support from the TEN-T budget was granted to 4 projects and totalled 5,5 MECU in 1996/97. ·
On the German part of the Rhine a reporting and information system (MIB) has been established which, in combination with the existing systems in the Netherlands (IVS), allows the four riparian · state's to exchange data automatically on the transport of dangerous goods: Also on the Rhine, from Oberwesel_ to St. Goar, a radar-equipped guidance system for vessels (VTS) was put into service. On ._
the Amsterdam-Rijncanal the installation of a traffic guidance system will be completed in 1998. (See also point 3.2.3)
22
Lines open to <.:ommercial service on 1.1.1996 .
23
Berlin-Ham10ver and Niirnberg-Erfurt also includes sections of upgraded HS lines. 24
Between 200 l and 2007
25
ECMT/CS(98) 12
[image:14.547.51.513.35.410.2]Inland ports form an essential part of the TEN-T in particular as intermodal connection points for transhipment between different transport modes. For this purpose adequate infrastructure inside the port area is required together with links to the road and rail network and installations for the handling of containers and roll-on/roll-off traffic.
In 1996-97, some major infrastructure works were undertaken, including investment in the creation of logistics centres in and around inland ports. Investment in various inland ports in Germany amounted to neatly 250 MECU in 1996/97 while French inland ports (Lill~. Paris, Mulhouse and Strasbourg) were expanded and upgraded at a cost of roughly 50 MECU. The port of Liege in Belgium was modernised at a cost of some 2,4 MECU.
3.1.4 Seaports
Seaports in the Union handle more than 90% of the Union's trade with third countries and approximately 30(Yo of intra EU traffic (freight traffic: 2.7 billion tonnes p.a.; international passenger traffic: 200 million passengers p.a.). This is highlighted in the Commission's recent Green Paper on Seaports and Maritime Infrastructure (COM (97) 678) and in the proposal to integrate ports and terminals into the TEN-T guidelines (COM (97) 681 )26• Although ports.play an important role in the
transport system, investment gradually declined between 1970 and the late 1980's. At the beginning of the 1990's however the trend changed and investment in ports picked up significantly7.
TEN-T projects of common interest involving seaports are identified by the criteria in Annex II of the guidelines 'and can be located in any port of a MS. In these circumstances, the Commission requested information only for projects larger than 10 MECU. However, in some specific cases, aggregated data on investment was provided that makes it diffic:;ult to draw conclusions. Overall, investment in seaports accounted for more than 1, 7 BE<CllJ in the years 1996/97 ( approx. 5% of the total investment inTEN-T). Four main categories of port investment can be identified:
• New port infrastructli.B.re (approx. 35% ofthe investment)
The extension of existing terminals or new construction (mainly ro/ro and container terminals) was undertaken mainly in the northern range ports, the Baltic and some Mediterranean ports.
+
hnprovement of connections with the TEN-T land networks (approx 40%)+ Transhipment facilities and multimodal connections within the port area (about 10%)
+
Improvement of sea access to ports (about 15%)This mainly concerned ports located around the Baltic Sea and illll the North Sea, due to their physical constraints or geographical location (improvements included deepening access channels, dredging or ice breaking).
3.1.5 Airports
The network of airports is very different from networks of surface links. Ai'rports are by their nature intermodal nodes on a route network requiring virtually no en-route surface infrastructure. The 30 qr
so largest airports handle three qumtcrs of total passengers and about 90 percent of extra-Community international tranic. They arc thus regarded as lnJernational Connecting Poh1ts, although they also take most inlra-Community traffic as well. A further 60 or so Communily Connecting Poinis, generally handling between one arid five million passengers per annum~ account for almost all the
26
The current TEN-T guidelines set out criteria for identifYing port projects of common interest. The proposal puts . forward a ports map and develops specific criteria.
27
Source: ECMT/CS (98) 12: Investment in seaports remains limited with respect to the total investment in transport infrastructure.
remaining international and intra-Community traffic. The remaining 200 airports in the network tend to be quite small, but fulfil a vital Regional and Accessihility Point role, often in relatively remote areas, although they take only five per cent of Community passengers.
The objective of the guidelines is to ensure that airport capacity develops to. match demand, while meeting safety and environmetital requirements. Within those constraints, and in the face of forecast rates of traffic growth, the guidelines thus focus upon the enhancement of existing capacity, intcrinodal connectivity, and the amelioration of environmental impact, as well as upon the provision of new infrastructure.
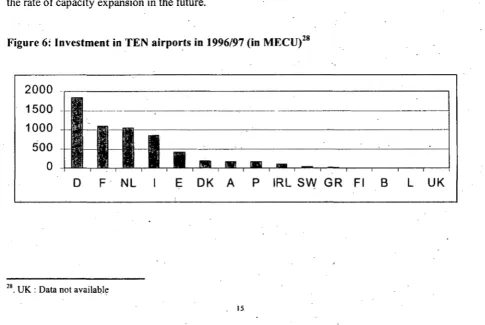
Infrastructure investments were planned and undertaken at virtually all the Interrwtional Connecting Points during the period under review. Particular attention W(lS given, in several cases, to connections to the rail, especially high speed rail, network. Investment of over 5 BECU (some 20% of it at Amsterdam Schiphol) was reported by these largest airports in 1996-97. Works at the airport of Milan-Malpensa were reported as on target although problems with land links remain. At other airports there were considerable investments in land links (e.g. the Heathrow Express rail link:. 562,5 MECU in total).
Almost all Community Connecting Points showed evidence of investment in 1996-97, totalling 800MECU. The range of projects is very wide, ranging from major runway schemes at Funchal and Leipzig-Hallc, through airside improvements and terminal extensions at several airports, to relatively modest works elsewhere. Finally, reported investments· at Regional and Accessibility Points totalled 300MECU.
[image:16.541.36.521.436.761.2]Overall, despite reporting uncertainties, a .total of the order of 6 BECU can be identified as having been invested in the airport network in 1996-97. Given the commercial status of most major airports, it is not surprising that the great Q.ulk of investment came from private sources. However, Community financial assistance under the TEN-T budget contributed 25 MECU, and substantial sums were provided by grants and loans from other Community sources. Investment in the airport network can· be seen to be responding to the needs identified in the guidelines, but environmental constraints· and responsibilities may be an even more important influence on investment needs and · the rate of capacity expansion in the future.
Figure 6: Investment in TEN airports in 1996/97 (in MECU)28
2000
1500
1000
---···---,---·- - - ;
500
0
D F NL
28
. UK: Data not availa~l~
E OK A P IRL
sw_
GR Fl BL UK
3.1.6 Comlboned ~ral!llsport
Investment in infrastruciure relating to combined transport took place in several Member States, notably Germany and France. Germany is carrying out a 1,8 BECU investment programme from
\992-2010 to upgrade and develop a network of some 44 combined transport terminals. Annual funding for terminals in France averages about 8 M ECU per year, and in 1996 the sector benefited from a special 50 MECU grant to boost combined transporl. In the UK, local and regional authorities provided the bulk of the funding necessary to create a core network of regional terminals for Charmel Tunnel traffic. The cost of upgrading and constructing this network of6 to 8 tem1inals is estimated in the range of 150-200 MECU. Austria has begun a major investment programme to improve the terminal infrastructure in particular on the main axes for rail and combined transport laid down in Protocol 9 to the Austrian EU accession Treaty. The cost for these measures, which concern among others the terminals Vienria-lnzersdorf, Wels and Graz-Werndorf, is estimated at approximately 400 MECU. Finally, Italy committed, through the law 240/1990, some 443 MECU (at 1992 prices) for the development of combined transport terminals for the period 1992 to 2007. More· than 253 MECU was invested in 1995. In 1996-97, following a request made by the regions, Italy committed an additional99 MECU for projects involving a dozen combined transport terminals located all over the country.
As regards Community financial assistance, 7 of the 14 specific projects, including notably the Betuwe rail freight line in the Netherlands, involve expansion or upgrading works which contribute to the development of combined transport. In addition, smaller contributions from the TEN-T budget (in the range of 2-·4 MECU) were al1ocated to specific terminal schemes, including sites near Berlin and Leipzig.
3.2 TRAFFIC MANAGEMENT AND NAViGATION SYSTEMS
This section gives an account of the development of Intelligent Transport Systems (ITS) as set out in Annex II of the guidelines for the various modal networks. '
3.2.1 Road traffic management
The TEN-T guidelines include the telematic infrastructure for traffic management systems and traffic information services. The aim is to develop the quality and the continuity of services across borders. The implementation of road traffic management systems and traffic information services has become a more important issue since it is seen as an important tool contributing to transport efficiency, r9ad safety and to the environmental objectives of the EU.
Progress towards deployment has been made in all the four main areas of projects of common interest identified by the guidelines:
the installation of telematic infrastructure and equipment for tnffic data collection a111d
processing is progressing in most of the Member States. The consequence is that the average
quality of data is improving. Nevertheless, there is still missing infrastructure- although in some countries (Germany
+
UK) private service providers are building up their own traffic monitoring installations- and new data collection methods (using mobile tools like GSM) are being deployed;the development of traffic information and traffic controi centres is now well under way.
with very up-to-date centres (Spain, Portugal, Luxembourg, Belgium, and Finland). Furthermore many existing traffic centres will benefit from up-to-date technologies (in countries !ike Germany, the Netherlands, Italy, France). ·Finally the interconnection of the traffic centres dealing with cross-border exchange of traffic data has been initiated;
the promotiosu of traffic information services has been a major achievement. The overall quality of on-trip traffic information services available on TEN-T roads provided by radio
messag~s and variable message signs has been improved. Advanced information services disseminated via RDS-TMC29 or GSM, as well as navigation services based on GPS have started. RDS-TMC services are already broadcast in Ger'many, the Netherlands and France and should be extended to 12 Member States by 2000;
-actions in- the field of interoperability have been fruitful in particular at EU level, for instance regarding RDS-TMC'services or cross-border data exchange between traffic centres (Memoranda of Understanding have been agreed in 1997). Much remains to be done, however, in such fields as electronic fee collection.
An EU action programme for road transport telematics30 was endorsed by the Council of Ministers in 1997. This action programme is a solid contribution to the implementation of the TEN-T guidelines. Approximately 77 MECU has been allocated for studies and projects over the period 1995-1998 from the TEN-T budget. These resources have generated 450 MECU of investments on the major- trans-European corridors. A fresh impetus has been given to cross-border co-operation through five Euro-Regional projects grouping together
12
EU Member States.3.2.2 European Rail Traffic Management System (ERTMS)
The Council Resolution of 17 December 1990 regarding the development of the European high-speed rail network, as well as the TEN-T guidelines in 1996, underlined the importance of a harmonised rail control-command system for the development of an integrated trans-European rail network. Th'e Commission consequently initiated a work Jirogram supporting the development of a unique standard for rail signalling called "European Rail Traffic Management System" (ERTMS). _ , The programme is expected to run up to the year 2000. The cost of the program is estimated. to be
appro_ximately 420 MECU, from both public and private sources, and ofwhich the EU contribution is estimated at 30-35%. During the period 1996- f997 the TEN~ T budget provided around 25 MECU, complementing a research contribution of approximately the same order of magnitude.
The following main targets have been reached during the period ·1996-1997:
• The completion of a set of common system specifications, to be used as the core reference document for an European railway signalling standard; ·
• The deployment of the prototype telecommunication GSM-Requipment in several trial sites;_
o The award- of the first contracts for the supply of signalling equipment to the trial sites (July
1997), which include the upgrading of the whole Berlin-Halle-Leipzig line to the ERTMS standard (estimated cost: 30 MECU).
3.2.3 Traffic management and information for inland waterway navigation
29
RPS-TMC (Ratio Data System-Traffic Message Channel) is a broadcast service which gives drivers messages about
the latest traffic conditions.
-311
Council conclusions of 17 June 1997 and COM(97)223 of 20 May 1998 Community strategy -and framework for the deployment of road transport telematics in Europe and proposals for initials actions.
17
.-The development of traffic management on the trans-European inland waterway network was mainly addressed in the transport section of the 4th Framework Programme, which included different aspects
or lraflic management and information services in a number of R&D projects. The introduction of. modern transport management and control systems for inland navigation will substantially improve the eniciency of waterways.
'rhe R&D project "INDRIS" is currently developing the concept of River Information Services (RlS), integrating existing R&D results and national systems (e.g. IVS90). The underlying aim is to contribute to efficient, safe and environmentally-friendly traffic flows on Europe's inland waterways through the provision of 'open' information systems. Existing Traffic Management and Information Services in inland waterways are currently operating on a local basis. "INDRIS" aims at harmonising the services at a European level. Results will be validated in demonstration sites on the Danube,
Rhine and Seine. · .
3.2.4 Vessel traffic management and information system (VTMI§)
The trans-European vessel traffic management and information system incorporates coastal or port1 vessel tramc services (VTS), terrestrial communication distress and safety systems, aids to navigation, and some of the computerised telecommunications applications, all of which can help to ensure a high level of safety.
In the period 1996-1997, the Member States undertook 13 projects in the field of VTMIS. This led to the creation
o(
more than 20 new VTMIS nodes in eight Member States and the upgrade of more than 15 existing.nodes in six Member States. The total investment amounted to more than 63 MECU of which about 20 MECU came from Community funds.New aids to navigation infrastructures were initiated in Ireland and in the. Netherlands and enhancement to existing systems have started in the member countries of the North European
Loran-e
system. These infrastructures will complement the forthcoming Global Navigation Satellite System (GNSS), providing to the maritime industry a comprehensive set of radio navigation systems. The United Kingdom undertook to upgrade the existing VHF radio stations to provide marine distress and safety communication services within the Global Maritime Distress and Safety System (GMDSS) framework.The Netherlands, Spain, Germany, Finland and Belgium arc jointly to set up a data exchange system concerning the carriage
or
dangerous and polluting cargo in application of the Council Directive 93/75/EEC.3.2.5 Air Traffic Management (ATM)
The TEN-T guidelines in the area of ATM aim at facilitating and accelerating ~mplementation
measures to increase the capacity of the European ATM system and at ensuring the optimal use of available Air Traffic Control capacity. Given the intricate nature of a system composed of different national systems and the wide range of actions necessary, Community support has been focused on two main streams of activities.
The first implementation measures aimed at replacing or upgrading the components of the system using existing off-the-shelf technologies. These measures, conceived within a Europe-wide implementation plan managed by Eurocontrol in co-ordination with all stakeholders, have usually been undertaken at national level. They c~nsisted, i~ter alia, of new radar installations, communication networks and data processing systems. Their completion ensures that the users of the system (aircraft operators) enjoy consistent performances and uniform operations across the European airspace, notwithstanding the great variety of national components in lerins of hardware and so ftwarc.
However, only the adoption of common standardised facilities can overcome the current limitations to system interoperability and interconnection and lead to a significant increase of the capacity of the Europeail ATM system. Therefore, the second stream of activities has centred on facilitating the deployment and implementation of new components by supporting the development of r.elated standards and ultimately the integration of national A TM systems into a single regional system. Examples of these measures arc pre-operational studies and trials· related to data-linking and data networking, advanced survei I lance and data processing. Overall, the implementation of ATM technologi9s otTers significant opportunities f(.)f European industry. The capital investment in the
ATM sector lor the period 1996-97 amounted to around 1,3 BECU. ·
3.2.6 Global Positioning and Navigation Network
One element ofthe TEN-T is a positioning and navigation network to provide a reliable and efficient service which can be used by all modes of transport. It· includes satellite and certain terrestrial systems. The Commission has, therefore, supported projects which use satellite-based technology as the backbone for the development of the trans-European navigation and positioning network. A multi-year project, known as EGNOS31
, has been defined and currently involves the European
Community, the European Space Agency and Eurocontrol, as well as individual Member States. EGNOS is Europe's contribution to an initial civil global navigation satellite system (GNSS). !twill provide benefits to all modes oftransportation as well as giving European industry a real opportunity to develop expertise in a field presently dominated by the US. It is based on existing US and Russian satellite signals, and will provide enhanced accuracy and reliability-over Europe, as well as a number
of other areas. - ·
Other benefits include:
- improvements in safety across the whole region, especially in areas where little navigation infrastructure currently exists, such as remote areas and peripheral regions. Other projects submitted by Member States are to complement the EGNOS service for specific local
requirements (landing, docking, in-town nayigation, etc); ·
- opportunities to rationalise current terrestrial navigation infrastructure, bringing net economic benefits.
The estimated total cost ofEGNOS is 270 MECU, with one-third funded by the EU. 25 MECU was spent on EGNOS from the TEN-T budget in 1996-7. The Commission is currently preparing recommendations on the EU role in GNSS beyond EGNOS.
~
3.3 HORIZONTAL ISSUES
The following section examines the implementation in some major areas relevant to the development and establishment oftheTEN-T.
3.3.1 ll.nteH"operability
One of the main objectives ofthe TEN-T is the interoperability of national networks. The wide range of activities on interoperability that are under way have b.een described in previous sections.
31
European Geostationary Navigation Overlay Service
Activity in the area of rail has been of particular significance. Directive 96/48EC32 (adopted on 23 July 1996) laid down the conditions for interoperability of High Speed rail services. This directive requires a report to he provided. The Commission is preparing this for the autumn of this year. Further work on intcropcrability is underway and a communication on conventional rail interoperability is soon to be published.
3.3.2 Research
and developmentResearch and development is one of the broad lines of measures covered by the TEN-T guidelines. Under the 41
h Framework Programme for Research and Development (1994-1998), two specific
programmes cover activities which contribute to the implementation of the guidelines, namely the Transport Research Programme and the Telematics Applications Programme. Research activities are also undertaken in the context of COST actions (European Co-operation in the field of scientific and technical research) which associate EU Member States with EFTA countries, Central and Eastern European countries and some Mediterranean countries.
With regard to the integration of environmental concerns into the design and development of the network, a group of projects directly linked to the TEN-T guidelines (articles 5c and 8) involve a pilot study on the emissions, energy consumption and safety impacts of the TEN-T as a whole. Results from these projects will help assess whether Community guidelines need revision to take better account of these issues. One COST action deals with habitat fragmentation due to transportation infrastructure, while another covers the measurement of emissions and. energy use by different transport modes.
Another cluster of projects is developing an analytical framework for measuring the socio-economic effects of large infrastructure investments such as those related to the TEN-T. Research activities are now on-going to determine the configuration in which the TEN-T projects would produce the most beneficial economic and social effects (article 5j of the guidelines). One COST action is studying tJ:le roles of transport operators and infrastructure managers in generating added value from interconnectivity and interoperability.
RTD related to the· TEN-T guidelines will continue under the Fifth Framework Programme for Research and Development (1998-2002), notably in the key actions "Sustainable Mobility and lntermodality" and "Systems and Services for the Citizen".
3.3.3 Envill'onmental nssi!Des
The TEN-T guidelines stress the importance of integrating environmental concerns into the definition and the implementation of the network. This takes place at' project, corridor, and network
level. ·
When projects of common interest are implemented, environmental protection is taken into account by the Member States concerned through the execution of environmental impact assessments pursuant to Directive 85/337 and to Directive 92/43 on the conservation of natural habitats.
In this context, the Council adopted on 3 March 1997 Directive 97/11 amending the EIA Directive 85/337 and extending the need for ex-ante assessment, in particular in the case of the upgrading of existing transport infrastructure. The Directive also underlines the need for information exchange in the case of cross-border projects which could have·impacts on neighbouring countries.
32
Council Directive 96/48 EC, of23.7.96 on the interoperability of the trans-European high-speed rail system.
In order to ensure that environmental concerns are integrated from the outset, a strategic environmental assessment should also be carried out at the initial planning stage, since strategic choices may foreclose alternatives in the further development of an infrastructure project. The TEN-T guidelines (article 8§2) call for the development of methods for strategically evaluating the environmental impact of the whole network as well as fot methods for· environmental evaluation at the corridor level. This is consistent with the need to look at the environmental impact of choices of overall network design.
In accon.lancc with article 8, the Commission is currently supporting work in the following areas: • Development of a "toolbox" handbook of SEA methodologies for application at project, corridor
and network level; -
-• Application of SEA methods on pilottransport corridors in five Member States (UK, A, I, S, F); •, Research on, and subsequent application of, methods for a network-wide analysis, based on
different scenarios of network development.
The handbook on SEA-methodologies (SEA Manual) will give a detailed overview of state-of-the-art SEA tools and methods and their application in the Member States. If is primarily intended as a guide - for transport-decision makers involved in the development and use of the SEA concept.
. In order to promote corridor analyses, a number of corridor assessments have been set up in co-operation with the Member States concerned. They cover the Danube corridor _(Austrian part), the trans-Pennine corridor (UK), Ravenna-Venezia (Italy), Norrkopping -Jonkopping (Sweden) and-Corridor nord (France).
The Commission, assisted by the European Environment Agency, is developing an approach for assessment at the network level. This is proving difficult, 'largely because of the absence of comprehensive data. At the same time, as already indicated, a group of 41h Framework RTD projects
focuses on the effect of the TEN on traffic, einissions and energy consumption. -, The conclusion that may be drawn from these initiatives so far is that a flexible methodology should be developed in order to take account of the specific characteristics of a corridor and that the environmental assessment should be part of a wider strategic evaluation, including financial and socio-economic elements. The strategic assessment should focus on broad policy choices rather than on the detailed impacts which are analysed at the project level.
3.3.4 Connection with third countries
In 1997, the-Commission tabled a Communication to the Council and Parliament "Connecting the Union's transport infrastructure network to its neighbours- Towards a co-operative pan-European transport network policy"3J. This Communication set out a five-part strategy for the development of a pan-European transport network:
•
•
..
consolidation of the Pan-European Transport Corridors and the development of the-concept of Pan-European Transport Areas;
the extension of the TEN-T to the candidate countries through the Transport Infrastructure Needs Assessment (TINA) process;
a common approach to transport technology, aimed at ensuring inter-operability; the promotion of the use ofintelligent transport technologies;
33
COM(97) 172 final of23.04.1997
m co-operation on research and development.
This strategy is embodied in the concept of a pan-European network partnership.
The third Pan-European Transport Conference, held in Helsinki in June 1997, endorsed the broad lines of Lhe Commission's Communication, and identified for further development ten Pan-European Transport Corridors and four Areas. The Commission, in co-operation with the European Conference of Ministers ofTransport, and the UN Economic Commission for Europe, is co-ordinating this work. Since 1996, the TINA process has been under way, chaired by the Commission and involving senior officials from the EU and from the eleven candidate countries. Its aim is to define the TEN-Transport for the enlarged Union. The first stage of the work has now been completed, with the a,greement, in Vienna in June 1998, on an outline network for the enlarged Union. ·This will constitute a basis for a Commission's proposal, at the appropriate time, to extend the TEN-T guidelines. The TINA process,which is supported by a secretariat in Vienna, will continueinto 1999, 'in order to identify projects of common interest for priority financing. The latter aspect will be particularly important for the implementation ofthe new Instrument for Structural Pre-Accession Aid (lSPA). If agreed, this will provide EU support, from 2000 onwards, for projects aimed at addressing the problems of the transport infrastructure network in the candidate countries, which were highlighted in Agenda 2000. These problems are already addressed in PHARE which has spent over I BECU on transport infrastructure projects up to now.
4. FUNDING
This section provides summary information about the financing of TEN-T and in particular the EU financial support during the period under consideration.
4.1 TEN-T
investment
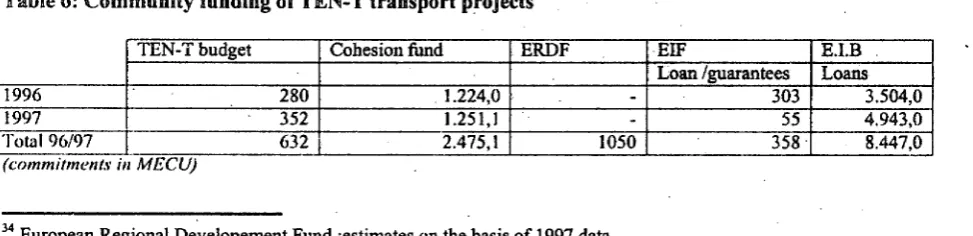
and fundingFinancing from national budgets accounts for' the majority of TEN-T investments. However, EU financial contributions to projects of common interest in the framework of TEN-T are important stimulants. Commitments from the TEN-T budget, the ERDF34 and the C!Jhesion fund are estimated at 4,157 BECU for 1996/97 (direct grants).
Financial commitments from the TEN-T budget in 1996/97 amounted to 632 MECU of which two-thirds were lor the 14 speci lie projects listed in Annex Ill of the guidelines Decision. In the same period, the Cohesion fund committed 2,475 BECU.
[image:23.539.15.502.624.742.2]As regards the ERDF, the annual contribution is estimated at about 525 MECU for TEN-T projects. In addition, the European Investment Bank (EIB) provided loans of 8,447 BECU and the European Investment Fund (ElF) guaranteed loans for a value of 0,358 BECU (see Table 6 below). Overall, the combined total of monies from European sources - roughly 12 BE<CU - represent an important share of the total investment in TEN-T (30%). However, it must be noted that the Cohesion and ERDF funds, with their geographical targeting comprise 85% of the total Community direct grants. Table 6: Community funding of TEN-T transport projects
TEN-T budget Cohesion fund ERDF
1996 280 1.224,0
-1997 352 1.251,1
-Total 96/97 632 2.475, l 1050
(commitments m MECU)
34
European Regional De~elopement Fund :estimates on the basis of 1997 data.
22
ElF E.I.B
Loan /guarantees Loans 303 3.504,0
As regards EU funding by transport mode,, the share of rai I increased from 26,3% in 1996 to 38,3% in 1997. For the TEN-T budget, rail accounted for 62% of the funding in 1996 and 58% in 1997. Table 7: Modal share of communitynnancial support in 1996/97
TEN-T budget Cohesion Fu11d ERDF3
1996 % 1997 % 1996 % 1997 % 1997 %
Road 35,3 12,6 62,0 17,7 959,5 78,5 707,6 57,0 139,6 26,0 Rail 173,6 62,0 204,0 58,0 222,0 18;5 407,7 32,5 369,9 71,0
LW.W 1,5 0,6 4,0 I, 1
-Ports 3,6 1,3 9,0 2,5 23,0 2,0 21,3 1,7 14,9 3,0
Airports 3,7 1,3 21,0 6,0 15,7 1,0 110,3 8,8 5,0 1,0
ITS >O 62,3 22,2 52,0° 14,7. 4 4,2
-
-Total 280,0 100 352,0 100 1224,2 100 1251,1 100 526,7 100 Total support m 4.150~0
1996/97
(commltments m MECU)
4.2 Specific projects
As regards the 14 TEN-T projects included in Annex III of the guidelines, the estimated total cost is around 110 BECU - compared to the estimated cost for the total network of more than 400 BECU until 2010. In the period 1996-1997 significant progress has been achieved"' Most ofthe projects are under construction or in the advanced planning stage and the majority is likely to be completed by
around 200539•
-EU funding provides a major contribution to the 14 specific projects. This is the case in particular for projects eligible for funding from the Structural and Cohesion fund, including the Belfast to Dublin rail link, the motorway networkin Greece and the high-speed trainsouth.
The TEN-T budget, although modest in scale, has aiso had a considerable impact in- helping to launch major projects such as the 0resund fixed link and the Belgian section of the PBKAL.
The EIB remains one ofthc major source of loan funding for TEN-T projects, granting 1,2 BECU in 1996 and 1,8 BECU in 1997 to the 14 specific projects. EIF guarantees to the- specific projects totalled around 350 MECU by 1997.
4.3 Public Private Partnerships (PPPs)
Public Private Partnerships provide a means of seeking better value for money through fresh ideas and new methods. In the light of the very large investment required to complete the TEN and the period of rigour in public sector financing new p'rivate sources of funding are essential. The · Commission has therefore sought to encourage the development of PPPs in order to accelerate implementation of the TEN. The report of a High Level Group on PPPs chaired by Commissioner Kinnock issued in
J
99740 indicated a number of avenues to be explored in order to mobilise35
Disagregated figures for ERDF are only known for 1997
36
TEN-T budget: all modes except rail; cohesion fund: only VTS
37
.The slight fall in commitments to ITS-projects between 1996 and 1997 is due to the fact that in 1997 some 18 MECU . designated to rail traffic management are included under the headirig rail.
38
This total assumes ERDF spending in 1996 is same as in 1997
39
For more details, cfCardiffReport.
'4
°
COM (97) 453 of 10.09.97. [image:24.539.27.517.60.287.2]increased private resources. The Commission is actively following this up and several examples of PPPs on the TEN are emerging:
o the UK government's commitment to a PPP for the Channel Tunnel Rail Link;
o the Greek's authorities decision to construct the Rio Antirio bridge and other major
PATHE projects;
o th~.: Dutch governnwnt is pressing ahead on a scheme f()r their section of the Paris-Amsterdam high speed rail route.
5. GENERAL ASSESSMENT
[image:25.548.18.501.322.722.2]The investment in the TEN-T during 1996/97 is estimated at about 38,4 .BECU41 but this includes neither ITS nor the investments on combined transport for which only limited information on financing was available. Most of these figures relate to multi-annual projects covering more than the period in consideration.
Table 8 shows the volume of investment undertaken in the different Member States on TEN rail and road ·networks in 1996/97 and gives a rough idea of the state of progress of the projects. Despite certain stati_stical shortcomings, this first survey shows that significant progress has been realised in several scclors.ofthe TEN-T. On this basis,' the TEN-T network can still be achieved by 2010.
41
Rail, roads, inland waterways, seaports, airports. Combined transport and ITS not included. Additionall,3 BECU were invested in ATM.