This is a repository copy of
Estimating Future Health Technology Diffusion Using Expert
Beliefs Calibrated to an Established Diffusion Model
.
White Rose Research Online URL for this paper:
http://eprints.whiterose.ac.uk/126684/
Version: Accepted Version
Article:
Grimm, S.E., Stevens, J.W. orcid.org/0000-0002-9867-7209 and Dixon, S. (2018)
Estimating Future Health Technology Diffusion Using Expert Beliefs Calibrated to an
Established Diffusion Model. Value in Health. ISSN 1098-3015
https://doi.org/10.1016/j.jval.2018.01.010
[email protected] https://eprints.whiterose.ac.uk/ Reuse
This article is distributed under the terms of the Creative Commons Attribution-NonCommercial-NoDerivs (CC BY-NC-ND) licence. This licence only allows you to download this work and share it with others as long as you credit the authors, but you can’t change the article in any way or use it commercially. More
information and the full terms of the licence here: https://creativecommons.org/licenses/
Takedown
If you consider content in White Rose Research Online to be in breach of UK law, please notify us by
1
Estimating future health technology diffusion using expert beliefs calibrated to an established
diffusion model
Abstract
Objectives: Estimates of future health technology diffusion, or future uptake over time, are a requirement for different analyses performed within health technology assessments. Methods for obtaining such estimates include constant uptake estimates based on expert opinion or analogous technologies, and extrapolation from initial data points using parametric curves – but remain divorced from established diffusion theory and modelling. We propose an approach to obtaining diffusion estimates using experts’ beliefs calibrated to an established diffusion model to address this methodological gap.
Methods: We performed an elicitation of experts’ beliefs on future diffusion of a new preterm birth screening illustrative case study technology. The elicited quantities were chosen such that they could be calibrated to yield the parameters of the Bass model of new product growth, which was chosen based on a review of the diffusion literature.
Results: With the elicitation of only three quantities per diffusion curve, our approach enabled us to quantify uncertainty about diffusion of the new technology in different scenarios. Pooled results showed that the attainable number of adoptions was predicted to be relatively low compared with what was thought possible.
Further research evidence improved the attainable number of adoptions only slightly but resulted in greater
speed of diffusion.
2 Highlights
Estimates of future health technology implementation are a requirement for different analyses performed within health technology assessments (HTAs). Methods for obtaining such estimates have included simple uptake estimates held constant over the time horizon based on expert opinion or analogous technologies – but remain divorced from established diffusion theory and modelling.
3 1. Introduction
Estimates of health technology uptake, or diffusion when considered over time, are of increasing importance in
health technology assessment (HTA) decision-making. The definition of uptake, for the purposes of this article,
is the number of units of a technology purchased through the health system relating to a specific medical
indication. Diffusion is defined as the process of uptake growth over time (1). For instance, numerous studies
are performed to assess the value of implementation measures (2-7), for which both the potential diffusion with
the implementation measure and the counterfactual (what happens if we opt to not invest in implementation) are
needed (7, 8). In budget impact analyses, the requirement for an estimate of the affected population also
necessitates an estimate of the likely market share or uptake of a new technology, preferably of dynamic nature
(9, 10). In cost-effectiveness analyses, recent research showed that prices of medical devices may decline with
increasing uptake and this mechanism was implemented in a cost-effectiveness framework that enabled the
assessment of dynamic cost-effectiveness and price-volume agreements (1, 11). Finally, value of research
studies have investigated the potential effect of research on diffusion, and highlighted that quantification of the
effect of research on diffusion enables better estimation of the value of research (12, 13). These HTA themes
thus have in common that diffusion estimates are often required for their appropriate consideration.
Existing studies using uptake estimates within HTA have relied heavily on the use of constant uptake estimates,
based on similar technologies or expert opinion (14). Alternatively, parametric curves were used to inform
dynamic uptake curves (2, 3). The issue with the first approach is that health technology uptake is unlikely to be
best represented by a single uptake estimate held constant across future time periods, as was shown in empirical
evidence from many different countries (15). A literature review concluded that uptake generally varies over
time and is heterogeneous at therapeutic class level as well as at the technology level (7). The second approach,
extrapolating future diffusion from available data points, suffers from two issues: first, fitting parametric curves
through a few data points can result in vastly different diffusion patterns, because these curves do not typically
account for a likely ceiling value or the speed of diffusion based on diffusion theory insights. More sophisticated
methods of extrapolating diffusion from existing data are available in the forecasting literature (16, 17). Second,
HTA decision-making requires the diffusion estimate to be available prior to the launch of the technology,
4 there is a need for methods that help predict technology uptake prior to technology introduction, and that allow
estimation of diffusion, rather than constant uptake rates.
We therefore reviewed the forecasting and diffusion literature in search for methods to estimate diffusion prior
to technology introduction. Diffusion theory was established by Rogers in 1962, suggesting that diffusion of
goods typically follows an s-shaped curve, time being presented on the x-axis and cumulative per period uptake
on the y-axis (18). The s-shape resulted from the assumption that populations are heterogeneous in their
propensity to innovate, with innovators having a relatively small threshold to technology adoption and imitators
having a relatively higher threshold (16). Rogers assumed that the threshold sizes were distributed normally
among the population (18).
It furthermore became evident that there is a limited number of tools available to researchers who wish to
predict diffusion prior to technology introduction, called pre-launch forecasting in the diffusion literature (17).
The two methods typically used for pre-launch forecasting are “guessing by analogy” and subjective judgements
(17). Guessing by analogy involves (a) choosing technologies that can be considered as analogous by using
pre-specified criteria and (b) using available time series data for the analogous technologies to predict sales of the
new technology (19-21). In health care, such guessing by analogy applications appear to be limited to estimates
of constant uptake. Limitations associated with this approach include that little is known on how analogies
should be chosen (19), the unavailability of similar products in certain technology types (20), selection bias
caused by diffusion data of unsuccessful products rarely being available (20) and elapsed time since the
analogous technology was introduced, which may have brought about other exogenous factors influencing
diffusion patterns (22).
Compared to guessing by analogy, subjective judgement methods provide the advantage of enabling experts to
consider technology- and time-specific conditions. However, published studies typically fail to quantify the
uncertainty associated with the forecasts and do not use the structure of formal diffusion models (17). Without
an assessment of uncertainty, resulting forecasts are of limited use to decision-makers. The use of approaches
5 We conclude that the requirement for diffusion estimates at the time of HTA stands in stark contrast to the
dearth of methods permitting an estimation of diffusion in accordance with diffusion theory available to health
economic analysts at present. In this paper, we therefore aim to develop a novel approach to estimating diffusion
of health technologies using a formal process of elicitation of experts’ beliefs, and calibrating these to an
established diffusion model. Given the complexity of the topic, we see particular value in a detailed methods
guide for interested researchers. We illustrate our approach in a case study on a preterm birth screening
technology. The paper is structured as follows: we first present the diffusion model in the Methods Section 2.1,
then propose an approach to estimating this by eliciting observable quantities and calibrating these (Section 2.2).
We describe background on the case study technology (Section 2.3) and provide more detail on the elicitation
study (Section 2.4). In Section 3, we present results of the application in the illustrative example, and we
provide a Discussion and Conclusion in Sections 4 and 5.
2. Methods
2.1 The diffusion model
The most widely cited model for diffusion of innovations is the Bass model of new product growth (16), which
represents the sigmoid shape of diffusion first proposed by Rogers (18). For short the Bass model, it was
developed in 1969 (23) as an adaptation of a logistic model that reflects the effects of ‘innovation’ and
‘imitation’, to be consistent with diffusion literature (18):
(1)
Where P(t) is the probability of adoption in period t, p the coefficient of innovation or external influence, q the
coefficient of imitation or internal influence, m the number of attainable adoptions, and the number of
cumulative adoptions up to the previous period t-1.
6 (2)
Where is the number of per period adoptions in period t.
To give an intuition about these parameters, note first that the number of attainable adoptions m does not
necessarily coincide with any normative idea of what the maximum number of potential adoptions could be.
Second, equation (1) shows that if across all periods t, which means that imitation plays no role
in the diffusion of the technology and the probability of adoption in a period stays constant. If , however,
imitation factor q solely dictates the speed by which the attainable number of adoptions is reached by
determining the proportion of the remaining non-adopters that will adopt in period t. The term
controls the scale and the term controls the shape of the diffusion curve, with ensuring the s-shape of
the cumulative diffusion curve. Parameters p and q are therefore interdependent. Reported ranges for parameters
p and q from a meta-analysis of diffusion curves in a variety of industries were (0.000021; 0.03297) and
(0.2013; 1.67260) respectively (24).
2.2 Eliciting beliefs about diffusion
The Bass model parameters are not straightforward to elicit because they are not observable quantities (25, 26) –
expressing an opinion about the value of the coefficients of innovation or imitation is cognitively challenging.
Another challenge is to keep the elicited summaries to a particular type rather than eliciting a mix of absolute
numbers, proportions and odds ratios (27).
Given these challenges, our proposed solution is to elicit uncertainty about the following three quantities: the
attainable number of adoptions (which we denote as m), the number of adoptions in the first year after
technology introduction (denoted as N1), and the point of inflection, described as the number of years after
which the number of adoptions starts to decline (t’). The elicited quantity m is equivalent to the Bass model
parameter m, whereas quantities N1 and t’ require further computation to generate the Bass model parameters p
and q. Unfortunately, there is no simple algebraic solution that converts observable quantities into Bass model
parameters. Kim, Hong (22) found algebraic solutions for the logistic model but not for the Bass model.
7 solution for quantities that we considered less intuitive, such as the sum of Bass model parameters p and q (28).
Instead, we used a numerical approximation using minimisation of the sum of squared error terms on the three
elicited quantities. This entailed using excel solver to calculate the error terms between the elicited information
and the fitted diffusion curve in each solver trial run until the sum of squared error terms was minimised. The
computation of parameter values was performed for 1,000 random samples from the probability distributions of
the three elicited quantities to yield distributions of parameters p and q.
A problem associated with estimation of parameters in the classic Bass model is that it can result in an
unrealistic ‘oscillating’ curve at specific combinations of parameters p and q because of its time-continuous
presentation of discrete data. This arose as a consequence of simplifying the process for the experts by eliciting
parameter values independently and ignoring the correlation between uncertain parameters. To overcome this
feature, we used the Satoh adaptation of the Bass model (29), which applies a discrete analogue of a quadratic
first order equation to the Bass model to make it discrete in time rather than continuous in time, such that:
(3)
where is the cumulative number of adoptions in period t.
2.3 Background on the case study technology
The illustrative case study technology is a new device that can help determine whether a pregnant woman is
likely to have a preterm birth. This device is still in development and accuracy data are confidential. Compared
to the existing standard option, an early study showed that the new technology would be more sensitive and
more specific. However, sensitivity was still considered relatively low. The new technology would be easy to
use, address capacity issues with the existing technology, its purchase would not be exceedingly costly, but it
would be associated with some consumable cost. Treatment options if tested positive include progesterone and
cervical cerclage. There were 231 obstetric units in England, which would be expected to purchase one or more
8 2.4 Elicitation of experts’ beliefs about the diffusion curve of the new preterm birth screening technology
Elicitation of experts’ beliefs is a widely-used method to obtain quantitative experts’ judgements reflecting
parameter uncertainty (25). It describes “the process of capturing expert knowledge about one or more uncertain quantities in the form of a probability distribution”(30). Structured approaches to elicit experts’
beliefs have been found to reduce bias (26) and tools and software packages are readily available, for example,
the Sheffield Elicitation Framework (SHELF) (30). Structured elicitation of experts’ beliefs requires thorough
preparation and consideration of many aspects that require a methodological choice by the analyst (31, 32). We
briefly summarise the main decisions in the following, according to reporting guidelines for use of expert
judgement (32). More detail can be found in the elicitation protocol in the appendix and the R package on the
SHELF website (30).
We recruited three obstetricians from different locations and types of hospitals in England. In order to qualify
for the study, they had to fulfil criteria of having a tangible level of expertise, an understanding of the general
problem area, and no conflict of interest. Tangible expertise required that experts had knowledge about the
therapeutic area (preterm birth), treatment and diagnostic options in the area, and were familiar with the
commissioning process of new health technologies. Obstetricians practicing in English hospitals were
considered generally eligible for the reasons that: 1) diffusion for the preterm birth screening technology was
limited to patients in England for this illustrative example; 2) in England, the technology would be made
available to hospitals with obstetric units that assess women at high risk of preterm birth; and 3) the key
customers are obstetricians, typically involved throughout the procurement decision-making process. The
experts’ deeper tangible expertise was established within a preceding qualitative study.
Possible biases and heuristics were discussed and experts encouraged to avoid these. Training of experts should
involve following the process of elicitation through for a quantity that is unknown to the experts but knowable
in principle (25). For this, the number of preterm births in England was elicited from each expert, using a scalar
quantity in keeping with the quantities elicited in the main study. We used the tertile method, a variable interval
method in which experts are asked about the median of an uncertain quantity, , say, such that
9 respectively. Separate face-to-face sessions were held with each expert and gamma distributions fitted to their
elicited values. The distributions were then combined across experts using linear mathematical pooling, with
equal weights for the experts. One pilot was performed, and no changes were made to the protocol subsequently.
Within the provision of background information, experts were provided a document with general background on
preterm birth statistics, the accuracy data of the new and the current technologies and other information
mentioned in Section 2.3, a brief background on diffusion theory, and a presentation of findings from the
preceding qualitative study, which suggested that further research would be desirable to establish the predictive
accuracy of this technology. We therefore performed the elicitation exercise twice: once for a scenario based on
the current evidence of predictive accuracy, and once more for a hypothetical scenario in which new evidence
on the device’s accuracy was available. We provide a view to the mechanism by which any change in diffusion
could be attained with the availability of further research evidence by reporting experts’ rationales for their
estimates of the “with research” diffusion curve. These qualitative statements were obtained as part of one of the
steps in SHELF, fitting the distribution and feedback.
3. Results
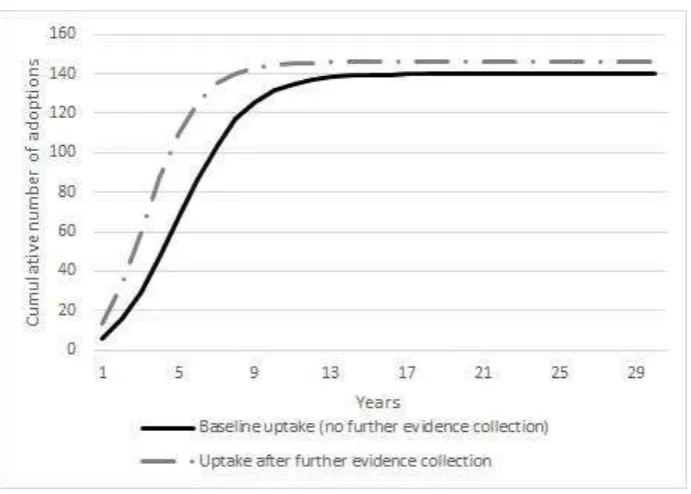
In summary, the pooled elicitation results (Tables 1 and 2, Figure 1) suggest that the maximum attainable
number of adoptions for the preterm birth screening device in England will be at 140 devices without further
research and at 146 with further research evidence. These are relatively small numbers given that there are 231
obstetric units in England and that most units would be expected to purchase more than one device. A very
small number of adoptions would occur in the first year, at a mean of six adoptions, or thirteen adoptions with
the availability of more research evidence. The rationale given by the experts was that in the first year, potential
purchasers would mainly be hospitals that were involved in the development of the technology or those that had
research grants for it (Table 3 and Figure 2). The number of years at which the maximum number of per-period
adoptions is reached was estimated to be at a mean of six years, or five years with more research, with the
rationale being that a greater evidence base would enter the consciousness of clinicians sooner.
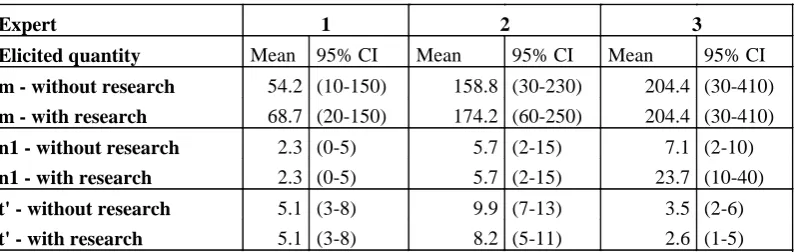
To provide an overview of the individual experts’ beliefs, Table 3 and Figure 2 present the results for each
10 convincing. Expert 2 had similar reservations but considered that more evidence, even showing the same result,
would help with the evaluation process. Expert 3 thought that the maximum number of adoptions was
constrained by the adversity to innovation in the England National Health Service (NHS) but they thought that
the device would diffuse quickly within these constraints and that further evidence would speed up the diffusion
process slightly.
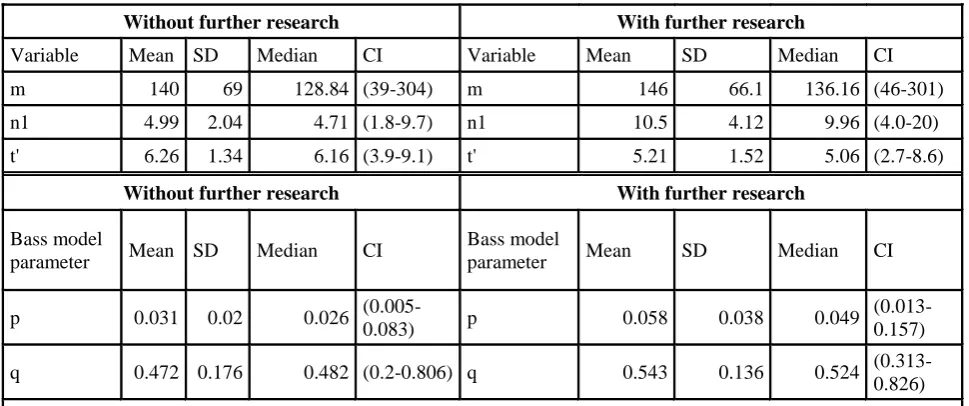
Computing the distributions of p and q from the elicited distributions resulted in mean values of 0.031 and
0.472, respectively, for the current scenario and 0.058 and 0.543, respectively, for the further research scenario
(Table 1). The exact p and q values lack an intuitive interpretation but can be interpreted in the context of the
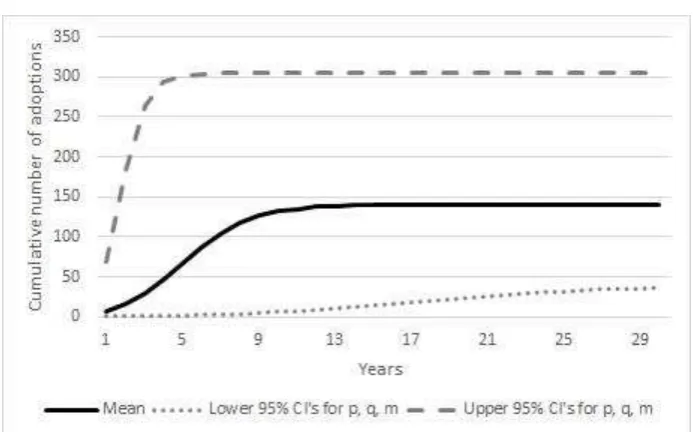
general statements outlined in Section 2.1 of this paper. Uncertainty about the shape of the “without evidence”
diffusion curve is presented in Figure 3, in which the mean diffusion curve is plotted along with the curves
obtained when the 95% credible interval values of parameters p, q and m are used.
4. Discussion
In this paper, we have presented a novel approach to predicting diffusion of new health technologies using
elicitation of experts’ beliefs about uncertain values to inform an adaptation of the Bass model of diffusion. We
applied our approach to estimating diffusion of a new preterm birth screening technology for two counterfactual
scenarios of with and without the availability of further research evidence. Pooled results showed that the
attainable number of adoptions was predicted to be below what was thought to be possible for a new device in
this therapeutic area. This was mainly attributed to relatively unconvincing accuracy evidence for the device and
the general adversity to change that was thought to be present in the England NHS. The availability of further
research evidence could improve the maximum attainable number of adoptions only slightly but resulted in
greater speed of diffusion.
The method presented in this paper is of particular relevance considering the lack of methods in the literature
that addresses the requirements for dynamic estimates of technology implementation in the context of different
types of analyses commonly performed within HTAs. More practically, the elicited diffusion curves for the new
case study technology can inform further studies on the value of implementation of the collection of further
11 with these estimates. In value of research studies, the impact of collecting further research evidence can be
assessed in terms of both the increase in implementation and the decrease of uncertainty. Finally,
cost-effectiveness of this technology could be modelled including price-volume agreements and the uncertainty about
diffusion could be appropriately reflected in the probabilistic sensitivity analysis. Our paper offers an approach
to obtaining the technology-specific and probabilistic diffusion estimates required for these analyses prior to
technology introduction, a currently unexplored topic (17). The approach presented here improves upon the
commonly used methods of using data from analogous technologies and deterministic expert or analyst
judgements by providing estimates that reflect uncertainty about diffusion based on a widely validated diffusion
model.
The strength of this approach lies in the ability to estimate diffusion for the technology lifetime from only three
elicited quantities. Our approach also enables the use of available expert knowledge, rather than being
dependent on diffusion data for other technologies. Data on analogous health technologies are sparse, amongst
others because of patent protection leading to long lags until competitors can enter the market. The Bass model
of diffusion was chosen because of a strong evidence base in support of its ability to predict diffusion well in
different industries. No other models had the same evidence base. Another strength is the elicitation of
uncertainty information, with the possible ‘diffusion space’ including a range of possibilities for different paths
of diffusion that could become reality given that certain events occur (such as a new competitor entering the
market).
It may be perceived as a limitation that relatively little information is provided on our illustrative case study. We
felt that a focus on the new approach was more appropriate. We wish to highlight that the choice of experts, the
avoidance of heuristics and bias in elicitation, and the appropriate briefing on the technology and possible
influencing factors and future developments deserve more attention and refer the reader to the wider elicitation
literature (25-27, 31-33). The number of experts used should furthermore be carefully assessed. We used 3
experts and thought this was possibly sufficient to characterise the uncertainty about future diffusion. However,
Grigore et al. since then suggested between 6 and 12 experts (31), and hence, the use of only 3 experts may be a
limitation. A technical limitation is that we univariately elicited beliefs about quantities that are likely to be
interdependent. This, and the use of the Satoh adaptation of the Bass model, may have led to the introduction of
12 Alternative methodological choices in the elicitation of expert opinion include fixed interval methods such as
the roulette method, which divide the sample space into fixed intervals and ask for the probabilities of these (27,
34). Variable interval methods (such as the tertile method used here), in contrast, offer more flexibility for the
expert but may sacrifice simplicity and there is no conclusive evidence on which method performs best (35).
Another method is the so-called hybrid, in which experts are asked to provide information about the lowest and
highest possible value as well as the most likely value of a quantity of interest (36).
Alternative distributions could be used for the quantities of interest. In particular, where the number for 100% of
adoptions is known (i.e. where there is an upper bound to uptake), it may be easier for experts to think about
proportions of adoptions. More research is required to establish whether this would be the case and whether the
elicited quantities could then easily be back-calculated to estimate the diffusion model parameters.
There is no consensus on whether behavioural or mathematical aggregation of expert opinions should be used.
Whilst behavioural aggregation through discussion and adjustment of beliefs in a group setting offers the
advantage that a consensus can be found, this method also tends to produce over-confident judgements (27).
Mathematical aggregation, however, neglects the different opinions of the experts. Due to time constraints, we
were unable to perform a feedback round, in a technique that is known as the Delphi method and has previously
been applied to forecasting (37).
It should be highlighted that researchers performing such an exercise may wish to be careful in the study design
to avoid any anchoring bias between scenarios. In our ‘with research’ scenario, the newly generated hypothetical
evidence was conditional on the currently existing evidence and we therefore did not perceive any anchoring as
problematic. But when independent scenarios are elicited, a timely separation of the elicitation exercises is
advisable to avoid anchoring.
Alternative diffusion models may be used. The applicability of diffusion theory to health technologies may be
compromised by health technologies being subject to different rules and adoption mechanisms compared to
technologies in other industries. Other prediction models should arguably be tested in comparison with the Bass
13 Scope for further research includes applying our approach to more technologies. Its performance in accurately
forecasting diffusion in comparison with other forecasting methods should be assessed once sufficient empirical
data becomes available. Methodological research is furthermore required in elicitation techniques, in particular
multivariate elicitation of interdependent quantities.
5. Conclusion
The proposed approach of eliciting experts’ beliefs about diffusion and informing the Bass model has the
14
References
1.
Grimm SE, Dixon S, Stevens JW. When Future Change Matters: Modeling Future Price and
Diffusion in Health Technology Assessments of Medical Devices. Value in Health. 2016;19(6):720-6.
2.
Faria R, Walker S, Whyte S, Dixon S, Palmer S, Sculpher M. How to Invest in Getting
Cost-effective Technologies into Practice? A Framework for Value of Implementation Analysis Applied to
Novel Oral Anticoagulants. Med Decis Making. 2017;37(2):148-61.
3.
Whyte S, Dixon S, Faria R, Walker S, Palmer S, Sculpher M, et al. Estimating the
Cost-Effectiveness of Implementation: Is Sufficient Evidence Available? Value in Health.
2016;19(2):138-44.
4.
Walker S, Mason AR, Claxton K, Cookson R, Fenwick E, Fleetcroft R, et al. Value for
money and the Quality and Outcomes Framework in primary care in the UK NHS. Brit J Gen Pract.
2010;60(574):213-20.
5.
Mason J, Freemantle N, Nazareth I, Eccles M, Haines A, Drummond M. When is it
cost-effective to change the behavior of health professionals? Jama-J Am Med Assoc.
2001;286(23):2988-92.
6.
Sculpher M. Evaluating the cost-effectiveness of interventions designed to increase the
utilization of evidence-based guidelines. Fam Pract. 2000;17:S26-S31.
7.
Essat R, Faria R, Gomersall T, Grimm SE, Keetharuth A, Walker S, et al. Getting
cost-effective technologies into practice: the value of implementation - Report on initial scoping review for
Phase 1. Sheffield: EEPRU, 2013.
8.
Walker S, Faria R, Whyte S, Dixon S, Palmer S, Sculpher M. Getting cost-effective
technologies into practice: the value of implementation. Report on framework for valuing
implementation initiatives. York: EEPRU, 2014.
9.
Sullivan SD, Mauskopf JA, Augustovski F, Caro JJ, Lee KM, Minchin M, et al. Budget
Impact Analysis Principles of Good Practice: Report of the ISPOR 2012 Budget Impact Analysis
Good Practice II Task Force. Value in Health. 2014;17(1):5-14.
10.
Mauskopf JA, Sullivan SD, Annemans L, Caro J, Mullins CD, Nuijten M, et al. Principles of
good practice for budget impact analysis: Report of the ISPOR task force on good research practices -
budget impact analysis. Value in Health. 2007;10(5):336-47.
11.
Hoyle M, Anderson R. Whose costs and benefits? Why economic evaluations should simulate
both prevalent and all future incident patient cohorts. Med Decis Making. 2010;30(4):426-37.
12.
Grimm SE, Dixon S, Stevens JW. Assessing the Expected Value of Research Studies in
Reducing Uncertainty and Improving Implementation Dynamics. Med Decis Making.
2017;37(5):523-33.
13.
Willan AR, Eckermann S. Optimal Clinical Trial Design Using Value of Information
Methods with Imperfect Implementation. Health Econ. 2010;19(5):549-61.
14.
Retel VP, Joore MA, Linn SC, Rutgers EJ, van Harten WH. Scenario drafting to anticipate
future developments in technology assessment. BMC Res Notes. 2012;5:442.
15.
Packer C, Simpson S, Stevens A. International diffusion of new health technologies: A
ten-country analysis of six health technologies. Int J Technol Assess. 2006;22(4):419-28.
16.
Meade N, Islam T. Modelling and forecasting the diffusion of innovation - A 25-year review.
Int J Forecasting. 2006;22(3):519-45.
17.
Goodwin P, Meeran S, Dyussekeneva K. The challenges of pre-launch forecasting of
adoption time series for new durable products. Int J Forecasting. 2014;30(4):1082-97.
18.
Rogers EM. Diffusion of Innovations. 5th ed. New York: The Free Press; 2003.
19.
Bass FM, Gordon K, Ferguson TL, Githens ML. DIRECTV: Forecasting diffusion of a new
technology prior to product launch. Interfaces. 2001;31(3):S82-S93.
15
21.
Lee H, Kim SG, Park HW, Kang P. Pre-launch new product demand forecasting using the
Bass model: A statistical and machine learning-based approach. Technol Forecast Soc.
2014;86:49-64.
22.
Kim T, Hong J, Koo H. Forecasting diffusion of innovative technology at pre-launch A
survey-based method. Ind Manage Data Syst. 2013;113(6):800-16.
23.
Bass FM. A new product growth for model consumer durables. Management Science.
1969;15(5):215-27.
24.
Sultan F, Farley JU, Lehmann DR. A Meta-Analysis of Applications of Diffusion-Models. J
Marketing Res. 1990;27(1):70-7.
25.
O'Hagan A, Oakley JE, Daneshkhah A, Eiser J, Gartwhaite P, Jenkinson D. Uncertain
Judgements: Eliciting Experts' Probabilities. Chichester: John Wiley & Sons; 2006.
26.
Johnson SR, Tomlinson GA, Hawker GA, Granton JT, Feldman BM. Methods to elicit beliefs
for Bayesian priors: a systematic review. J Clin Epidemiol. 2010;63(4):355-69.
27.
Soares MO, Bojke L, Dumville J, Iglesias C, Cullum N, Claxton K. Methods to elicit experts'
beliefs over uncertain quantities: application to a cost effectiveness transition model of negative
pressure wound therapy for severe pressure ulceration. Stat Med. 2011;30(19):2363-80.
28.
Lawrence K, Lawton W. Applications of Diffusion Models: Some Empirical Results. In:
Wind Y, Mahajan V, Cardozo R, editors. New Product Forecasting. Lexington, MA: Lexington
Books; 1981. p. 529-41.
29.
Satoh D. A discrete bass model and its parameter estimation. J Oper Res Soc Jpn.
2001;44(1):1-18.
30.
O'Hagan A, Oakley JE. SHELF: The Sheffield Elicitation Framework 2016 [June 2017].
Available from: http://www.tonyohagan.co.uk/shelf/.
31.
Grigore B, Peters J, Hyde C, Stein K. Methods to elicit probability distributions from experts:
a systematic review of reported practice in health technology assessment. Pharmacoeconomics.
2013;31(11):991-1003.
32.
Iglesias CP, Thompson A, Rogowski WH, Payne K. Reporting Guidelines for the Use of
Expert Judgement in Model-Based Economic Evaluations. Pharmacoeconomics.
2016;34(11):1161-72.
33.
Hora SC, VonWinterfeldt D. Nuclear waste and future societies: A look into the deep future.
Technol Forecast Soc. 1997;56(2):155-70.
34.
Bojke L, Claxton K, Sculpher M, Palmer S. Characterizing Structural Uncertainty in Decision
Analytic Models: A Review and Application of Methods. Value in Health. 2009;12(5):739-49.
35.
Garthwaite PH, Kadane JB, O'Hagan A. Statistical methods for eliciting probability
distributions. J Am Stat Assoc. 2005;100(470):680-700.
36.
Grigore B, Peters J, Hyde C, Stein K. A comparison of two methods for expert elicitation in
health technology assessments. Bmc Med Res Methodol. 2016;16(1):85.
16
17 Table 1. Pooled elicited quantities and Bass model parameters
Without further research With further research
Variable Mean SD Median CI Variable Mean SD Median CI
m 140 69 128.84 (39-304) m 146 66.1 136.16 (46-301)
n1 4.99 2.04 4.71 (1.8-9.7) n1 10.5 4.12 9.96 (4.0-20)
t' 6.26 1.34 6.16 (3.9-9.1) t' 5.21 1.52 5.06 (2.7-8.6)
Without further research With further research
Bass model
parameter Mean SD Median CI
Bass model
parameter Mean SD Median CI
p 0.031 0.02 0.026
(0.005-0.083) p 0.058 0.038 0.049
(0.013-0.157)
q 0.472 0.176 0.482 (0.2-0.806) q 0.543 0.136 0.524 (0.313-0.826)
[image:18.595.77.252.345.744.2]Key: m - number of attainable adoptions, n1 - number of adoptions in period 1, t' - time at which number of adoptions starts to decline, SD - standard deviation, CI - credible intervals
Table 2. Cumulative adoptions as per pooled elicited diffusion curves
Nt Year Without research With research
1 6 13
2 15 33
3 29 59
4 47 87
5 67 110
6 87 126
7 104 135
8 117 140
9 126 143
10 131 145
11 135 145
12 137 146
13 138 146
14 139 146
15 139 146
16 140 146
17 140 146
18 140 146
19 140 146
20 140 146
18 Table 3. Experts' individual elicited quantities
Expert 1 2 3
Elicited quantity Mean 95% CI Mean 95% CI Mean 95% CI
m - without research 54.2 (10-150) 158.8 (30-230) 204.4 (30-410)
m - with research 68.7 (20-150) 174.2 (60-250) 204.4 (30-410)
n1 - without research 2.3 (0-5) 5.7 (2-15) 7.1 (2-10)
n1 - with research 2.3 (0-5) 5.7 (2-15) 23.7 (10-40)
t' - without research 5.1 (3-8) 9.9 (7-13) 3.5 (2-6)
t' - with research 5.1 (3-8) 8.2 (5-11) 2.6 (1-5)
19
[image:20.595.73.419.114.361.2]Figures
[image:20.595.76.520.422.547.2]Figure 1. Diffusion with and without further evidence collection
21
Appendix
Quantifying factors that will influence usage of a new technology for pre-term birth
screening in the UK
Script
1. Introduction
Introduce yourself
Explain that the aim is to quantify beliefs about future purchases of Technology A for PTB
screening in the UK
Explain that this study will inform an economic model
Explain that this is part of a PhD study that looks into how adoptions affect the evaluation of
a technology
Explain that I wish to develop a standard approach by which experts are being asked about
adoption of innovative technologies
Explain that this study is a so-called elicitation of expert beliefs by which experts quantify
their opinions about some unknown quantities of interest
Explain that having a feeling of uncertainty with their opinion is fine and can be addressed
using this method
Reassure re: confidentiality and anonymity.
–
Highlight that no individual will be identified.
Remind about length of meeting
–
approximately 1 hour 30 mins
Check if participant has any questions at all at this stage
Ask participants to sign consent form to provide written consent for participation
Thank the participants for agreeing to participate
2. Training
Explain that we will now conduct training using one example quantity that is not used for this
study
Explain that we will elicit beliefs about the number of pregnant women delivering their baby
pre-maturely in England, called X in the following
Refer to number of hospital births under bullet point 1. in background document as a help and
tabular overview of how percentages translate to numbers
Provide calculator and sheet of paper
22
Ask experts to provide a range such that it is extremely unlikely but not entirely impossible
that X falls outside that interval (lower bound L to upper bound U) [tertile.single(Lo=X1,
Up=X2)]
Ask experts to state the median M, a number at which it will be as likely for X to be larger
than the median as sm
aller than the median. This is a value such that the proposition that ‘X
lies below the median’ is equally likely to ‘X lies above the median’.
Ask experts to state upper and lower tertiles (T1 and T2) by considering the range from L to
U and dividing it into three equally likely intervals.
–
Point out that of course M will have to lie between T1 and T2.
–
Point out that this is like giving an interval at which they are 33% confident that X
will fall into it
–
Ask experts to regard each of the three ranges (L to T1, T1 to T2 and T2 to U) as
equally likely.
–
Ask experts to regard also as equally likely the ranges T1 to M and M to T2.
–
Point out that values of X close to M are likely more probable than values of X close
to L and U, that is the intervals T1 to M and M to T2 will be narrower than the
intervals L to T1 or T2 to U.
When tertiles are decided on, show histogram and ask whether they think that the 3 boxes are
indeed equally likely [press show histogram]
Then show the fitted distribution (gamma) as density function [press first gamma, then
density] and tell them their estimated mean
Reveal real results of number of pre-mature births in England (2011-2012): 42,000 which is
equal to 6.3%.
3. Structuring
Remind of background that was sent in advance of the meeting
Ask whether they want to go briefly through the explanation of Technology A in background
doc (point 2)
Explain study results
Present LRs and sensitivity, specificity
Explain about uptake using the background document (point 4)
Explain 3 different uptake curves
Explain that this means elicitation of m, n1 and t’
Explain that later, we will look at m, n1 and t’ under the assumption that further trials have
been conducted
23
4. Elicitation
Explain that the first quantity to be elicited is the number of Technology A devices sold
across all obstetric units in England (m1).
Remind them that they can use the information in point 1-4 from the background sheet.
For m1: the number of Technology A devices potentially sold across all obstetric units
in England
Ask experts to provide a range such that it is extremely unlikely but not entirely impossible
that m1 falls outside that interval (lower bound L to upper bound U).
[tertile.single(Lo=L,Up=U)]
Double-check by asking whether they really think that there is 0% chance that m1 will fall
outside this range.
Ask experts to state the median M, a number at which it will be as likely for m1 to be larger
than the median as smaller than the median. This is a value such that the proposition that ‘m1
lies below the media
n’ is equally likely to ‘m1 lies above the median’. [write down on
Elicitation part 2]
Ask experts to state lower and upper tertiles (T1 and T2) by considering the range from L to
U and dividing it into three equally likely intervals.
–
Point out that of course M will have to lie between T1 and T2.
–
Point out that this is like giving an interval at which they are 33% confident that m1
will fall into it
–
Ask experts to regard also as equally likely the ranges T1 to M and M to T2.
–
Point out that values of m1 close to M are more probable than values of m1 close to L
and U, that is the intervals T1 to M and M to T2 will be narrower than the intervals L
to T1 or T2 to U.
Record median and tertiles in Elicitation part 2.
When tertiles are decided on, show histogram and ask whether they think that the 3 boxes are
indeed equally likely [press show histogram]
Then show the fitted distribution (gamma) as density function [press first gamma, then
density] and tell them their estimated mean
Ask whether experts are happy with their own distribution or whether they would like their
judgements changed (tell them mean and 90% percentiles)
–
Record any changes in Elicitation part 2 - Fitting
Ask experts to individually explain their rationales for their distributions.
24
Then elicit (according to the same protocol):
n1-1: the number of purchases of Technology A in hospitals in first year
t’1: the number of years at which the purchases
per period peak
m2: the number of potential purchases of Technology A given new evidence
n1-2: the number of purchases of Technology A in first year given new evidence
t’2: the number of years at which the purchases per period peak given new evidence
5. Conclusion
Highlight that this work will enable the preliminary economic evaluation of Technology A in
PTB screening, including setting research priorities.
25
Quantifying uptake determinants of Technology A for use in pre-term birth
screening in the UK
Elicitation briefing notes
The purpose of the elicitation meeting is to obtain probability distributions to represent your
uncertainty about various quantities of interest. These are listed in section three of the
attached pro forma.
The elicitation will be conducted following the Sheffield Elicitation Framework (SHELF),
based on elicitation practice recommended in O’Hagan et al (2006). You will be given
training in the process of elicitation at the start of the meeting, which will include a practice
exercise to familiarise you with the procedure.
It is important to note that you will not be asked to provide single estimates of any of these
quantities. The elicitation process will instead involve considerations such as what a
plausible range of values would be for each unknown quantity, and whether, in your opinion,
some values are more likely than others. You may have considerable uncertainty about
some of these quantities (though less than that of a lay person). This will not be of concern
during the elicitation itself, as the outputs from the elicitation will reflect large uncertainty
when it is present.
Due to the subjective nature of elicited probability distributions, it is important to make the
elicitation process as transparent as possible. A written record will be kept of the meeting,
which will include details of experts present at the meeting, a summary of each expert’s
relevant expertise, and any declarations of interest. It would be helpful if you could complete
sections 2 and 4 in the pro forma. A brief summary will be sufficient for section 4, covering
expertise relevant to the parameters listed in section 3.
Please note that declarations of interest are recorded for the purposes of transparency only,
and will not be used as grounds for exclusion from the elicitation. It is common for experts to
be stakeholders in the wider process.
Suggested relevant evidence is listed in section 5. If you wish to add to this list you may do
so. Where appropriate, publications/data listed in this section will be made available at the
elicitation meeting.
Reference:
O'Hagan, A., Buck, C. E., Daneshkhah, A., Eiser, J. E., Garthwaite, P. H., Jenkinson, D. J.,
Oakley, J. E. and Rakow, T. (2006). Uncertain Judgements: Eliciting Expert Probabilities.
26
Quantifying uptake determinants of Technology A for use in pre-term birth
screening in the UK
Pre-elicitation meeting pro forma
1) Background
The purpose of this exercise is to obtain estimates of future purchases
for Technolgy A for use in pre-term birth screening. These estimates
will then be used in an economic evaluation of this device that will
show future cost-effectiveness and help in setting research priorities.
2) Declarations of
interests
[To be completed by the expert. Please identify any personal interest
that you might have in the outcome of this elicitation exercise, or in
the wider context specified above: these can include being an
investigator in the trial of Technology A, being involved in the
development of Technology A, having any stake or interest in the
economic outcomes of Technology A or future research prospects]
3) Parameter
definitions
1. The number of potential purchases of Technology A in the NHS
England (your expertise of adoption processes in the NHS in your
field of work is needed).
2. The number of years at which the purchase rate peaks (your
expertise of how long it takes to reach the majority of adopters in the
NHS in your field of work is needed).
3. The number of purchases at the peak.
4. The same 3 parameters as above assuming that there is more
research available (your expertise of impact of research on adoptions
in your field of work is needed).
4) Participant’s
expertise
[To be completed by the expert. Please briefly identify your expertise
27
5) Key relevant
evidence
[The expert should add details of any key documents and studies that
28
ELICITATION RECORD
–
Part 1
–
Context
To be filled in by the facilitator.
Elicitation title
Quantifying factors that will influence usage of a new technology for
pre-term birth screening in the UK
Session
1
Date
Part 1 start time
Attendance and
roles
Purpose of
elicitation
To obtain estimates of future adoptions for Technology A in pre-term
birth with the purpose of performing an economic evaluation
This record
Participants are aware that this elicitation will be conducted using the
Sheffield Elicitation Framework, and that this document, including
attachments, will form a record of the session.
Orientation and
training
Conducted on one quantity: the number of pre-term births in one year in
the NHS England
Participants’
expertise
Declarations of
interests
Strengths and
weaknesses
Evidence
Structuring
1. maximum number of purchases attainable given current evidence
2. number of years at which number of purchases peak given current
evidence
3. number of purchases at peak given current evidence
4. maximum number of purchases attainable given availability of further
evidence
5. number of years at which number of purchases peak given
availability of further research evidence
6. number of purchases at peak given availability of further evidence
Definitions
29
1. m1
2. n1-1
3. t’1
4. m2
5. n1-2
6. t’2
Part 1 end time
30