THE ECONOMIC IMPACT OF THE
LONDON
HIGHER EDUCATION SECTOR
Universities UKThis report was produced for Universities UK by
Ursula Kelly, Emeritus Professor Iain McNicoll
and James White of Viewforth Consulting Ltd.
1. INTRODUCTION 2
2. SUMMARY OF RESULTS FOR EACH REGION 4
2.1 East of England 4
2.2 East Midlands 4
2.3 London 5
2.4 North East 5
2.5 North West 6
2.6 South East 6
2.7 South West 7
2.8 West Midlands 7
2.9 Yorkshire and Humberside 8
3. THE ECONOMIC IMPACT OF THE LONDON
HIGHER EDUCATION SECTOR 9
3.1 Introduction 9
3.2 Key regional higher education sector characteristics 9
3.2.1 Revenue 9
3.2.2 Export earnings 10
3.2.3 Employment 10
3.2.4 Expenditure 11
3.2.5 Students 11
3.3 Secondary or ‘knock-on’ effects on the economy 11
3
.3.1 Generation of ‘knock-on’ effects 113.3.2 Output generated by the institutions 11
3.3.3 Output multipliers 12
3.3.4 Employment generated by the institutions 12
3.3.5 Employment multipliers 13
3.4 GVA generated by the institutions 14
3.5 The impact of student expenditure 15
3.5.1 Student profile 15
3.5.2 International students 15
3.5.3 Students from the rest of the UK 15
3.6 Conclusions 16
ANNEXES
Annexe A: Methodology and data sources 18
Annexe B: Institutions included in the studies 19
Index of figures
Index of figures
Figure 1: Institutional revenue, 2011–12
Figure 2: Institutional revenue by broad source, 2011–12
Figure 3: Occupational profile of institutional employment, 2011–12
Figure 4: Institutional expenditure, 2011–12
Figure 5: Total output generated by London institutions, 2011–12
Figure 6: Secondary output generated by the institutions, 2011–12
Figure 7: Total employment generated by London institutions, 2011–12
Figure 8: Secondary employment generated by London institutions, 2011–12
Figure 9: Comparison of the occupational profile of employment generated, 2011–12
Figure 10: Secondary GVA generated by the London university sector, 2011–12
Figure 11: Student profile by domicile of origin, 2011–12
Figure 12: Total sectoral impact: summary of output generated
Figure 13: Total sectoral impact: summary of employment generated
The economic impact of the London higher education sector
CHAPTER 1
INTRODUCTION
The local role of higher education is a matter of growing interest in the UK and internationally. This report presents a summary of findings from analysis of the impact of higher education on local economies in England. It updates a previous 2010 Universities UK report, Making an economic impact: higher education and the English regions, and its focus is on the impact of the institutions as enterprises in themselves and the higher education sector in each geographical region as an industry.
With 130 higher education institutions overall, in terms of turnover the higher education sector in England makes up 83% of all UK higher education. It has a total revenue of £23.3 billion (the UK as a whole has a revenue of £27.9 billion), employs over 262,700 staff and has over two million students spread across England.
Recent studies in the UK have highlighted that higher education is important to the national economy, with a graduate workforce raising productivity and contributing to economic growth.1
The university research base is also seen as vital in fostering innovation, with the research base considered an essential part of the framework supporting innovation and national economic competitiveness.2
However, the importance of higher education in the local economy is also attracting extensive attention. Across Europe the growing emphasis on regional ‘smart specialisation’ is encouraging business, government and universities to work collaboratively to help identify, develop and maintain the particular strengths that will make for regional economic success.
Universities can bring many benefits to their local areas. They provide educational opportunities, are a source of research and innovation support, and can work with local and regional businesses as well as playing an important role in civic society. As independent organisations with a non-profit-making educational mission, universities can provide civic
leadership as well as being – literally and metaphor-ically – a ‘public space’ for debate and exchange of ideas. As a result, universities can be perfectly situated to help develop and support the necessary collaborations that can be important for regional success.3 Universities also operate globally and their
international connections are a vital link – especially for peripheral regions – with the wider world.
The 2013 Witty review4 of the role of universities in
their local communities focused on how universities can drive growth and contribute to society. Witty recognised that universities will be important players in the work of Local Enterprise Partnerships (LEPs), particularly in support for innovation. The review recommended that all universities should have a presence on their LEP Board to work together with other organisations to stimulate economic growth in their area.
The Witty review explored many of the other ways universities benefit their local areas, not only through education and research but also as economic actors in themselves, being a vital source of economic activity in a region, with a positive influence particularly during times of recession. Universities are substantial enterprises and are frequently among the largest employers in their localities. They are counter-cyclical. While they may not grow as fast as other enterprises during an economic boom, neither do they contract as much in a recession – thus being a source of stability, anchoring investment in the region.
The economic contribution of higher education institutions as businesses in their region is the subject of this report. The report highlights key economic characteristics of the higher education sector in each of the nine regions5 of England,
including institutional income, employment and expenditure. The report also presents the results of modelled secondary or ‘knock-on’ effects of higher education expenditure on the regions, showing how many jobs are dependent on the universities and the contribution being made to GDP.
1. Holland D, Liadze I, Rienzo C, Wilkinson D (2013) The relationship between graduates and economic growth across countries Department for Business, Innovation and Skills, Research Paper 110
2. Allman K. et al. (2011) Measuring Wider Framework Conditions for successful innovation: A system’s review of UK and international innovation data London: Nesta
Introduction
In relation to the economic impact generated by students in a region, the impact of international (i.e. all non-UK) off-campus student expenditure is considered. Additional analysis is also made of the off-campus expenditure of domestic students from outside the region who are attracted there by the universities. While domestic student expenditure is not additional to the UK economy as a whole, it is legitimate at a regional level to consider the money being attracted into a region from the rest of the UK. Analysis is not included of the off-campus expenditure of local students (i.e. students from the specific region under analysis) on the basis that their personal expenditure is not additional to the region, but is likely to have occurred in the region in any event.
Analysis has been conducted and results presented at sectoral level for each region, examining the collective impact of the region’s universities rather than the individual impact of each university. Each region has different characteristics in terms of
its business and industrial structure, and the composition of its higher education sector.
The analysis was conducted of each region separately, using a two-stage approach to the estimation of the economic impact of each regional higher education sector. The impact of the higher education institutions on the UK economy was modelled, using a purpose-designed economic input-output model of the UK. Analysis was then undertaken, using a Location Quotient approach, to estimate the share of the institutional impact on the UK likely to have accrued to the region. Fuller details of the methodological approach are given in Annexe A.
The economic impact of the London higher education sector
CHAPTER 2
SUMMARY OF RESULTS FOR EACH REGION
2.1 East of England
• Total revenue of East of England higher education institutions was £2.46 billion in 2011–12.
• International revenue amounted to £467 million which, together with the estimated off-campus expenditure of international (all non-UK) students (£369 million), represented a total of £836 million export earnings.
• Universities provided 21,123 full-time equivalent jobs across a range of occupations and skill levels.
• 33,148 full-time equivalent jobs were generated outside the universities, with most (30,494) based in the region.
• The universities’ own output was £2.46 billion. Through knock-on effects they generated an additional £3.35 billion in other industries
throughout the UK, with the majority (£3.1 billion) in the region.
• Universities attracted 32,730 students from outside the UK to study in the region.
• International students’ off-campus expenditure (£369 million) generated £554 million of output and 4,691 full-time equivalent jobs throughout the UK.
• Universities attracted 52,405 students from other parts of the UK to study in the region.
• The off-campus expenditure of students from the rest of the UK (£580 million) generated £647 million of output and 6,858 full-time equivalent jobs in the region.
• The East of England higher education institutions, together with the spending of international
students and students from other parts of the UK, generated 62,840 jobs in the region, which was equivalent to 2.2% of the 2012 East of England workforce in employment.6
• The higher education institutions alone
generated regional GVA of £2.9 billion (direct plus
secondary), which was equivalent to around 2.6% of all 2011 East of England GVA.
• When combined with the impact of the spending of international students and students from other parts of the UK, a total regional GVA of over £3.5 billion was generated, equivalent to 3.1% of total East of England GVA.7
2.2 East Midlands
• Total revenue of East Midlands higher education institutions was £1.7 billion in 2011–12.
• International revenue amounted to £345 million which, together with the estimated off-campus expenditure of international students (£293 million), represented a total of £638 million of export earnings.
• Universities provided 21,478 full-time equivalent jobs across a range of occupations and skill levels.
• 23,118 full-time equivalent jobs were generated outside the universities, with most (19,240) based in the region.
• The universities’ own output was £1.7 billion. Through knock-on effects they generated an additional £2.3 billion in other industries throughout the UK, with the majority (£1.9 billion) in the region.
• Universities attracted 25,945 students from outside the UK to study in the region.
• International students’ off-campus expenditure (£293 million) generated £440 million of output and 3,719 full-time equivalent jobs throughout the UK.
• Universities attracted 84,695 students from other parts of the UK to study in the region.
• The off-campus expenditure of students from the rest of the UK (£938 million) generated £1.1 billion of output and 9,527 full-time equivalent jobs in the region.
6. ONS regional summary of labour market indicators for 2012 (2,907,000 people in employment in the East of England) 7. East of England regional GVA in 2011 was £114.1 billion. (ONS 2012)
Summary of results for each region
• The universities, together with the expenditure of their international students and students from the rest of the UK, generated 53,220 jobs in the region, equivalent to 2.5% of the 2012 workforce in employment.8
• The higher education institutions alone generated over £2 billion of regional GVA (direct and
secondary), equivalent to around 2.5% of all 2011 East Midlands GVA.
• When combined with the spending of international students and students from other parts of the UK, a total regional GVA of £2.7 billion was generated, equivalent to 3.3% of total 2011 East Midlands GVA.9
2.3 London
• Total revenue of London higher education institutions was £5.8 billion in 2011–12.
• International revenue amounted to £1.3 billion which, together with the estimated off-campus expenditure of international students (£1.2 billion), represented a total of £2.5 billion in export
earnings.
• Universities provided 56,896 full-time equivalent jobs across a range of occupations and skill levels.
• Over 78,380 full-time equivalent jobs were generated outside the universities, with most (64,241) based in London.
• The universities’ own output was £5.8 billion. Through knock-on effects they generated an additional £7.9 billion in other industries throughout the UK, with the majority (£5.9 billion) in London.
• Universities attracted 102,995 students from outside the UK to study in London.
• International students’ off-campus expenditure (£1.2 billion) generated £1.7 billion of output and 14,763 full-time equivalent jobs throughout the UK.
• Universities attracted 113,995 students from other parts of the UK to study in London.
• The off-campus expenditure of students from the rest of the UK (£1.4 billion) generated £1.5 billion
of output and 13,447 full-time equivalent jobs in London.
• The universities, together with the expenditure of their international students and students from the rest of the UK, generated 145,921 jobs in London. This was equivalent to 3.7% of the workforce in employment in 2012.10
• The higher education institutions alone generated £6.6 billion regional GVA (direct plus secondary), equivalent to 2.3% of all 2011 London GVA.
• When combined with the spending of international students and students from other parts of the UK, regional GVA of over £7.9 billion was generated, equivalent to 2.8% of total 2011 London GVA.11
2.4 North East
• Total revenue of North East higher education institutions was £1.1 billion in 2011–12.
• International revenue amounted to £244 million which, together with the estimated off-campus expenditure of international students (£213 million), represented a total of £457 million of export earnings.
• Universities provided 14,661 full-time equivalent jobs across a range of occupations and skill levels.
• 15,261 full-time equivalent jobs were generated outside the universities, with most (11,493) based in the region.
• The universities’ own output was £1.1 billion. Through knock-on effects they generated an additional £1.5 billion in other industries throughout the UK, with the majority (£1.1 billion) in the region.
• Universities attracted 18,860 students from outside the UK to study in the region.
• International students’ off-campus expenditure (£213 million) generated £319 million of output and 2,703 full-time equivalent jobs throughout the UK.
• Universities attracted 40,505 students from other parts of the UK to study in the region.
• The off-campus expenditure of students from the rest of the UK (£457 million) generated £509
8. ONS 2013 (East Midlands 2012 employment was 2,121,000) 9. East Midlands regional GVA in 2011 was £81.6 billion. (ONS 2012)
The economic impact of the London higher education sector
million of output and 4,156 full-time equivalent jobs in the region.
• The universities, together with the expenditure of their international students and students from the rest of the UK, generated 32,246 jobs in the region. This was equivalent to 2.76% of the workforce in employment in 2012.12
• The universities alone generated £1.3 billion of regional GVA (direct plus secondary), equivalent to around 3% of all 2011 North East GVA.
• Combined with the spending of international students and students from other parts of the UK, regional GVA of nearly £1.6 billion was generated, equivalent to 3.8% of total 2011 North East GVA.13
2.5 North West
• Total revenue of North West higher education institutions was £2.6 billion in 2011–12.
• International revenue amounted to £461 million which, together with the estimated off-campus expenditure of international students (£387 million), represented a total of £848 million of export earnings.
• Universities provided 31,085 full-time
equivalent jobs across a range of occupations and skill levels.
• 34,617 full-time equivalent jobs were generated outside the universities, with most (29,795) based in the region.
• The universities’ own output was £2.61 billion. Through knock-on effects they generated an additional £3.48 billion in other industries
throughout the UK, with the majority (£2.91 billion) in the region.
• Universities attracted 34,270 students from outside the UK to study in the region.
• International students’ off-campus expenditure (£387 million) generated £581 million of output and 4,912 full-time equivalent jobs throughout the UK.
• Universities attracted 80,030 students from other parts of the UK to study in the region.
• The off-campus expenditure of students from the rest of the UK (£886 million) generated over £1 billion of output and 9,286 full-time equivalent jobs in the region.
• The universities, together with the expenditure of their international students and students from the rest of the UK, generated 74,218 jobs14 in the
region. This was equivalent to 2.3% of the 2012 North West workforce in employment.
• The higher education institutions alone
generated £3.1 billion of regional GVA (direct plus secondary), equivalent to around 2.5% of all 2011 North West GVA.
• Combined with the spending of international students and students from the rest of the UK, regional GVA of £3.86 billion was generated, equivalent to 3.1% of total 2011 North West GVA.15
2.6 South East
• Total revenue of South East higher education institutions was £3.8 billion in 2011–12.
• International revenue amounted to £707 million which, together with the estimated off-campus expenditure of international students (£549 million), represented a total of £1.26 billion of export earnings.
• Universities provided 45,982 full-time equivalent jobs across a range of occupations and skill levels.
• 50,920 full-time equivalent jobs were generated outside the universities, with most (45,515) based in the region.
• The universities’ own output was £3.8 billion. Through knock-on effects they generated an additional £5.1 billion in other industries throughout the UK, with the majority (£4.5 billion) in the region.
• Universities attracted 48,675 students from outside the UK to study in the region.
• International students’ off-campus expenditure (£549 million) generated £825 million of output and 6,977 full-time equivalent jobs throughout the UK.
12. ONS regional summary of labour market indicators for 2012 (1,167,000 people in employment in the North East) 13. North East regional GVA in 2011 was £41.6 billion (ONS 2012)
14. ONS regional summary of labour market indicators for 2012 (3,177,000 people in employment in the North West) 15. North West regional GVA in 2011 was £123.9 billion (ONS 2012)
Summary of results for each region
• Universities attracted 98,170 students from other parts of the UK to study in the region.
• The off-campus expenditure of students from the rest of the UK (£1.1 billion) generated £1.4 billion of output and 12,591 full-time equivalent jobs in the region.
• The universities, together with the expenditure of their international students and students from the rest of the UK, generated 110,331 jobs in the region. This was equivalent to 2.6% of the South East workforce in employment in 2012.16
• The higher education institutions alone generated £4.7 billion of regional GVA (direct plus secondary), equivalent to around 2.4% of all regional GVA. Combined with the spending of international students and students from other parts of the UK, regional GVA of nearly £5.7 billion was generated, equivalent to around 3% of total 2011 South East region GVA.17
2.7 South West
• Total revenue of South West higher education institutions was £1.7 billion in 2011–12.
• International revenue amounted to £288 million which, together with the estimated off-campus expenditure of international students (£270 million), represented a total of £558 million of export earnings.
• Universities provided 20,522 full-time equivalent jobs across a range of occupations and skill levels.
• 22,207 full-time equivalent jobs were generated outside the universities, with most (19,677) based in the region.
• The universities’ own output was £1.7 billion. Through knock-on effects they generated an additional £2.2 billion in other industries throughout the UK, with the majority (£1.9 billion) in the region.
• Universities attracted 23,915 students from outside the UK to study in the region.
• International students’ off-campus expenditure (£270 million) generated £405 million of output and 3,428 full-time equivalent jobs throughout the UK.
• Universities attracted 70,225 students from other parts of the UK to study in the region.
• The off-campus expenditure of students from the rest of the UK (£792 million) generated £996 million of output and 8,639 full-time equivalent jobs in the region.
• The universities, together with the expenditure of their international students and students from the rest of the UK, generated 51,780 jobs in the region. This was equivalent to 2% of the workforce in employment in 2012.18
• The higher education institutions alone
generated £2 billion of regional GVA (direct plus secondary), equivalent to around 2% of all 2011 South West GVA.
• Combined with the spending of international students and students from other parts of the UK, regional GVA of £2.7 billion was generated, equivalent to around 2.6% of total 2011 South West region GVA.19
2.8 West Midlands
• Total revenue of West Midlands higher education institutions was £1.95 billion in 2011–12.
• International revenue amounted to £394 million which, together with the estimated off-campus expenditure of international students (£408 million), represented a total of £802 million of export earnings.
• Universities provided 23,674 full-time equivalent jobs across a range of occupations and skill levels.
• 25,361 full-time equivalent jobs were generated outside the universities, with most (19,451) based in the region.
• The universities’ own output was £1.95 billion. Through knock-on effects they generated an additional £2.6 billion in other industries throughout the UK, with the majority (£1.9 billion) in the region.
• Universities attracted 36,140 students from outside the UK to study in the region.
• International students’ off-campus expenditure (£408 million) generated £612 million of output
16. ONS regional summary of labour market indicators for 2012 (4,225,000 people in employment in the South East) 17. South East regional GVA in 2011 was £192.3 billion. (ONS 2012)
The economic impact of the London higher education sector
and 5,180 full-time equivalent jobs throughout the UK.
• Universities attracted 76,580 students from other parts of the UK to study in the region.
• The off-campus expenditure of students from the rest of the UK (£864 million) generated £981 million of output and 8,309 full-time equivalent jobs in the region.
• The universities, together with the expenditure of their international students and students from the rest of the UK, generated 55,355 jobs in the region. This was equivalent to 2.18% of the workforce in employment in 2012.20
• The higher education institutions alone
generated £2.2 billion of regional GVA (direct plus secondary), equivalent to around 2.3% of 2011 West Midlands regional GVA.
• Combined with the spending of their international students and students from other parts of the UK, regional GVA of £2.9 billion was generated, equivalent to 3% of total 2011 West Midlands region GVA.21
2.9 Yorkshire and Humberside
• Total revenue of Yorkshire and Humberside higher education institutions was £2.2 billion in 2011–12.
• International revenue amounted to £422 million which, together with the estimated off-campus expenditure of international students (£380 million), represented a total of £802 million of export earnings.
• Universities provided 27,375 full-time equivalent jobs across a range of occupations and skill levels.
• 28,227 full-time equivalent jobs were generated outside the universities, with most (22,270) based in the region.
• The universities’ own output was £2.2 billion. Through knock-on effects they generated an additional £2.8 billion in other industries throughout the UK, with the majority (£2.1 billion) in the region.
• Universities attracted 33,655 students from outside the UK to study in the region.
• International students’ off-campus expenditure (£380 million) generated £570 million of output and 4,823 full-time equivalent jobs throughout the UK.
• Universities attracted 94,430 students from other parts of the UK to study in the region.
• The off-campus expenditure of students from the rest of the UK (£1 billion) generated over £1.1 billion of output and 9,677 full-time equivalent jobs in the region.
• The universities, together with the expenditure of their international students and students from the rest of the UK, generated 62,838 jobs in the region. This was equivalent to 2.5% of the region’s workforce in employment in 2012.22
• The higher education institutions alone
generated £2.5 billion of regional GVA (direct plus secondary), equivalent to around 2.7% of all 2011 Yorkshire and Humberside GVA.
• Combined with the spending of international students and students from other parts of the UK, regional GVA of over £3.2 billion was generated, equivalent to 3.5% of total 2011 Yorkshire and Humberside GVA.23
20. ONS regional summary of labour market indicators for 2012 (2,533,000 people in employment in the West Midlands) 21. West Midlands regional GVA in 2011 was £95.8 billion. (ONS 2012)
The economic impact of the London higher education sector
CHAPTER 3
THE ECONOMIC IMPACT OF THE LONDON
HIGHER EDUCATION SECTOR
3.1 Introduction
This summary presents key economic aspects of the higher education sector in London in the academic and financial year ending 2012 and of the sector’s impact on the region and on the rest of the UK. The study includes the 40 higher education institutions covered in the 2011–12 Higher Education Statistics Agency (HESA) data. London is the largest centre for higher education in the UK with many different types of institutions, including small specialist colleges such as the Royal College of Music (720 students) and the Courtauld Institute of Art (435 students) through various research institutes, such as the Institute of Cancer Research (290 students), mid-sized universities (for example, the University of the Arts, which has 17,300 students) to larger institutions such as University College London (25,525 students) and the University of Greenwich (26,445). A list of the included institutions can be found in Annexe B.
Major economic characteristics of the sector were examined, including its revenue, expenditure and employment. The study also included modelled analysis of the economic activity generated in other sectors of the economy through the secondary or ‘knock-on’ effects of the expenditure of the institutions and their staff, as well as the impact generated by the off-campus expenditure of international (all non-UK) students and students from outside London. The model used was the most recent version of the
Universities UK economic impact modelling system,24
which was updated and revised by Viewforth Consulting in spring 2013. A description of the methodology and data sources used is included as Annexe A. Overall this summary report presents an up-to-date examination of the quantifiable contribution of the London higher education sector to the regional economy, as well as its impact on the rest of the UK.
3.2 Key regional higher education sector
characteristics
3.2.1 Revenue
• The London higher education sector had a total revenue of £5.8 billion in the study year. This
[image:11.595.351.492.243.393.2]was earned for a wide range of educational and related services. This is shown in Figure 1.
Figure 1: Institutional revenue, 2011–12
27%
37% 19%
16%
1%
Funding council grants Research grants and contracts
Other income Endowment and investment income Tuition fees, education grants and contracts
Source: HESA HE Finance Plus 2011/12
• The largest part of institutional revenue (83%) was earned for delivering teaching and research (funding council grants, tuition fees and research income). This came from a range of sources, individual student fee payments and research contracts with private and international clients as well as from the UK public sector. In addition to money for teaching and research the sector also earns 16% of its income from other services including, for example, consultancy services, the provision of residence and catering services, conference support or facilities hire. Income from endowments and investments (frequently these come from charitable or philanthropic donations) is relatively modest at 1%; this is fairly typical of higher education across the UK.
• Around 45% of university revenue in the study year was estimated as being derived from public sector sources. However only 27% of this was the baseline funding council income which is awarded directly from the Higher Education Funding Council for England (HEFCE). ‘Other’
The economic impact of the London higher education sector
[image:12.595.73.216.327.474.2]public sector income makes up an estimated 18% of total university income. (This includes Research Council funding, tuition fees paid by public sector agencies, or research and consultancy contracts with public sector bodies – much of which is won in competition with other bodies such as consultancy firms.) Thirty-two per cent of university revenue comes from the UK private sector and 23% from international sources. Private revenue includes student fee payments (whether made directly by individuals or through loans from the Student Loans Company), payments for other services includes residence and catering, consultancy or research contracts with private firms. International revenue (estimated as amounting to nearly £1.34 billion) includes overseas student fees as well as residence and conference income and research and consultancy contracts with international agencies.
Figure 2: Institutional revenue by broad source, 2011–1225
Funding council grants Other UK public sector
27%
18% 32%
23%
UK private sector International
Source: Derived from analysis of HESA HE Finance Plus 2011/12
3.2.2 Export earnings
• The sector’s international revenue of £1.3 billion together with the estimated off-campus expenditure of international students (£1.2 billion) represents a total of £2.5 billion of export earnings. This is an important contribution to the UK balance of trade.
3.2.3 Employment
• The sector directly provided 56,896 full-time equivalent (FTE) jobs across a wide range of occupations. The occupational profile of university employment is shown in Figure 3. Unsurprisingly, academic professions (professors, lecturers and researchers) are the largest single type of occupation. However jobs are provided across a wide range of occupations, including a range of skilled and semi-skilled jobs. This reflects the need to maintain significant university estates including lecture halls, laboratories, offices as well as halls of residence, cafeteria and related facilities for students such as sports facilities. It is worth noting here however that the staffing profile of London institutions is slightly different from the UK average, with more of an emphasis on higher skilled professional and technical roles and with a lower proportion of manual and ancillary staff than the average UK institution. This almost certainly will reflect a greater propensity or opportunity for institutions in London to outsource ancillary roles. This is discussed further when reflecting on employment multipliers and employment generated outside the universities (Section 3.3.5).
Figure 3: Occupational profile of institutional employment, 2011–12
0 5,000 10,000 15,000 20,000 25,000 30,000
Number of jobs (FTE)
Academic professionals
Managers
Non-academic professionals
Laboratory, engineering, building, IT and medical technicians (inc. nurses
)
Student welfare workers, careers advisors, vocational training instructors etc
.
Artistic, media, PR, marketin g
and sports occupationsLibrary assistants, clerk
s
and general admin. assistant s
Secretaries, typists, receptionists etc.
Chefs, gardeners, electricaland construction etc
.
Care
taker
s, re
siden
tial w
arde
ns, s
ports
and l
eisur
e atte
ndan
ts, nu
rsery n
urse
s etc.
Retail and customer services
Drivers, maintenance supervisors and plant operatives
Cleaners, catering assistants ,
security officers, porters etc.
Source: HESA staff data 2011–12
[image:12.595.34.535.541.755.2]The economic impact of the London higher education sector
3.2.4 Expenditure
• University expenditure, together with the expenditure of university staff and students, generates economic activity through secondary or ‘knock-on’ effects.
• In 2011–12 the HESA data shows a total
[image:13.595.60.245.208.379.2]expenditure (including staff salaries) of £5.6 billion.
Figure 4: Institutional expenditure, 2011–12
Staff costs Other operating expenses
55% 38%
5%
Depreciation Interest payable
2%
Source: HESA HE Finance Plus 2011/12
3.2.5 Students
• There was a total (headcount) student population of 402,400 students in 2011–12.26
• The sector attracted 102,995 students from outside the UK. As well as paying fees to the university, international students spend money on rent, food and other living expenses, much of which accrues to the local area. International student off-campus personal expenditure amounted to an estimated £1.2 billion.
• In addition, the sector attracted 113,995 students from other parts of the UK who spent an estimated £1.4 billion on living and personal expenses. The expenditure of other domestic students from outside the region can be regarded as an injection into the regional economy.
3.3 Secondary or ‘knock-on’ effects on the
economy
3.3.1 Generation of ‘knock-on’ effects
The higher education sector generates economic
impact through its expenditure. Known as ‘knock-on’ effects, this impact is chiefly recognised as occurring in two ways:
• through the universities buying goods and services from a wide range of suppliers (from books and stationery to legal services, laboratory equipment to catering supplies); the suppliers also have to make purchases in order to fulfil the university orders and their suppliers in turn make other purchases and so on, rippling through the economy.
• through the universities paying wages to their employees, who in turn spend their salaries on housing, food and other consumer goods and services. This creates income for employees in other businesses and sectors, who also spend their income and so on.
In the case of universities that are long established in a particular location, purchasing linkages will be highly developed within their host region (previous studies of universities in the UK have shown that universities have a relatively high propensity to spend on UK, rather than imported, goods and services, generating greater regional economic impact than businesses that rely more heavily on imports27).
Staff expenditure tends to follow a different pattern from institutional expenditure, being more consumer oriented, but while staff expenditure will have a higher proportion of expenditure on imported consumer goods and goods from elsewhere in the UK (e.g. through online shopping), there is still an observable reliance on local goods and services – such as cafés, pubs, restaurants, fast food outlets, taxi services or personal services such as hairdressing etc. The ‘snapshot’ analysis of the impact of expenditure will reflect the composition of those linkages.
In this particular study, the impact of London institutions’ expenditure on the UK as a whole was modelled and then the proportion of that impact accruing to the region was analysed. This took into account the business and industry structure of the region as well as a consideration of purchases that are most likely to be more locally based, for instance the goods and services of local pubs and coffee shops, grocery stores and personal services such as hairdressers.
3.3.2 Output generated by the institutions
• The sector’s output in 2011–12 was £5.8 billion.28
Through the ‘knock-on’ effects of its expenditure in that year, the sector generated an additional
26. Student data is taken from HESA 2011/2012 and uses the HESA student record figure. 27. See McNicoll, 1995 & 1997 Kelly et al. 2006, 2009
The economic impact of the London higher education sector
[image:14.595.51.217.142.306.2]£7.9 billion in other industries throughout the UK, with the majority (£5.9 billion) accruing in London industries.
Figure 5: Total output generated by London institutions, 2011–12
University output Output in the rest of the region
42%
43% 15%
Output in the rest of the UK
Source: Viewforth modelling system (2013) analysis
The impact was spread across a range of other industries, with an emphasis on manufacturing, wholesale and retail, and business activities. The spread of impact is determined by the types of goods and services bought by the universities and their staff – as well as from whom they are bought. A university may buy laboratory equipment direct from a manufacturer, for instance, or through a wholesaler. They may purchase legal services from a local firm of solicitors. University staff expenditure tends to be more oriented towards consumer goods and services, many of these from local companies and shops. Figure 6 shows the pattern of output impact across industries.
3.3.3 Output multipliers
The impact is generated by institutional expenditure. By studying the volume of impact generated by 2011–12 sectoral expenditure it is possible to calculate ‘multipliers’. Analysis of the output impact
enabled Type II output multipliers for the London higher education sector to be derived. These were:
• UK: 2.36
• London: 2.02
In other words, every £1 million of higher education institutional revenue will generate a further
secondary output impact of £1.02 million in London plus a further £0.34 million in the rest of the UK.
3.3.4 Employment generated by the institutions
• In addition to directly providing 56,896 full-time equivalent (FTE) jobs, university expenditure gener-ated additional jobs in other parts of the economy.
• 78,381 more FTE jobs were generated outside the universities. The majority of the additional jobs (64,241) were generated in London.
• Total employment generated by the institutions amounted to 135,277 jobs.
Figure 7: Total employment generated by London institutions, 2011–12
University jobs Jobs in the rest of the region
42% 48%
10%
Jobs in the rest of the UK
[image:14.595.49.538.614.773.2]Source: Viewforth modelling system (2013) analysis
Figure 6: Secondary output generated by London institutions, 2011–12
Agriculture, forestry and fishing
Mining and quarryin g
Manufacturin g
Electricity, gas an d
water supply Constructio
n
Wholesale and retail trad e
Hotels and restaurantsTransport storage an
d
communicatio n
Financial intermediatio n
Business activities
Public administratio n
Other services
2,500 2,000 1,500 1,000 500 0
Region Rest of UK
£m
The economic impact of the London higher education sector
Figure 8 shows the other industries within which the additional jobs would be generated. This pattern of employment generated has a particular emphasis on the wholesale and retail trade, business activities and public administration. This is because of a combination of two major factors – that London higher education institutions had a relatively high output impact in these areas and also that these industries tend to be relatively labour intensive.
3.3.5 Employment multipliers
As with the analysis of output impact, it is possible to calculate ‘multiplier’ values.
• The Type II employment multipliers derived for the London higher education sector were observed to be as follows:
— UK: 2.38 — London: 2.13
• In other words, for every 100 direct full-time equivalent (FTE) jobs created in the universities themselves, another 138 UK jobs would be generated outside the universities in other industries, of which 113 would be in London. The employment multiplier values for London higher education are higher than those of most other UK regions with more jobs being created outside the institutions per job inside than in other regions. The London higher education sector has a slightly different staffing profile to the ‘average’ for UK higher education. Where the UK higher education sector as a whole has a balance of 46% academic staff: 54% support staff, for London higher
education the ratio is 50:50. Looking closer at the composition of the support staff in London higher education there is a noticeable difference from the UK average, which almost certainly reflects a greater degree of outsourcing of manual and ancillary support roles. For instance whereas cleaners, catering assistants and security officers comprise around 14% of UK higher education support staff overall, in London institutions they only make up around 6.5% of the support staff. Hence while the jobs and work required will continue to exist, more of these jobs will be created in other industries rather than as part of the universities’ direct employment.30
• The total UK employment impact of £1 million received by the London institutions is 23.34 FTE jobs. Every £1 million of sectoral output31 creates:
— 9.82 FTE jobs directly in the universities — plus 11.08 FTE additional (secondary impact
or ‘knock-on’) jobs in the region
— plus 2.44 FTE secondary impact jobs in the rest of the UK
Figure 3 has shown how the sectoral employment profile covers the full range of skill levels. By translating sectoral employment profile into Standard Occupational Classifications32 it is
[image:15.595.62.563.73.246.2]possible to compare the profile of higher education employment with that generated outside the universities. Figure 9 compares the sectoral occupational profile with that of the employment created outside the higher education institutions in London and in the rest of the UK.
Figure 8: Secondary employment generated by London institutions, 2011–1229
Agric ulture, forestr y and fish ing Mining and quarrying Manufacturing
Electricity, gas andwater supply Construc
tion
Wholesale and reta
il trade
Hotels and restaurantsTransport storage and communicatio n Financial intermediation Business activities Public admini strat ion Other services 25,000 0 5,000 10,000 15,000 20,000
Other industries in the region Rest of UK
Jobs generated (FTE)
Source: Viewforth modelling system (2013) analysis
29. The economic model used is based on SIC 2003 descriptors, which at a 1 digit level are not significantly different from SIC 2007. Hence the industry descriptors used here are SIC 2003.
30. Information on staffing is sourced from HESA. London institutions also employ a relatively higher proportion of higher skilled and technical posts (e.g. managers, non-academic professionals such as librarians, and other technical posts) compared to the UK average.
31. University output is definitionally equivalent to revenue or ‘turnover’.
The economic impact of the London higher education sector
As Figure 9 illustrates, higher education
employment is relatively specialised in high skilled ‘white collar’ jobs compared to jobs in the rest of the economy. This might be expected from the knowledge intensive nature of university activity, but is even more pronounced in London higher education than in UK higher education on average. The relatively fewer ‘managerial’ occupations in universities compared to the jobs generated in the rest of the economy will tend to be more of a reflection of how universities classify their own staff – with many academics (who are classed as professionals, rather than managers) undertaking managerial roles.
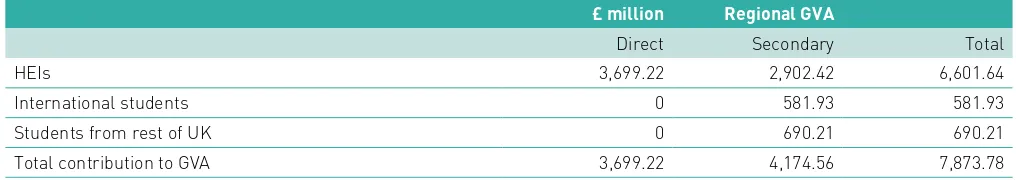
3.4 GVA generated by the institutions
The importance of higher education to the regional economy can be seen by its generation of significant levels of gross output and employment. However another key measure of the sector’s contribution to
the economy is the GVA generated. GVA or ‘Gross Value Added’ is a measure of the value created by the sector – GVA is the industry level measure of GDP (O). GDP (O) is a production measure of the net change in wealth or prosperity in the economy as a whole over the year. The sector’s direct GVA amounted to £3.7 billion and through secondary or ‘knock-on’ effects it generated a further £3.9 billion of GVA in other industries across the UK (£2.9 billion of GVA was related London industries).
London higher education institutions generated £6.6 billion regional GVA in total (direct plus secondary), which was equivalent to around 2.3% of all 2011 London GVA.33
The GVA multipliers were calculated as being:
• UK: 2.04
• Regional: 1.78
[image:16.595.34.543.82.244.2]33. 2011 London GVA was £283 billion. (ONS 2012)
Figure 10: Secondary GVA generated by the London university sector, 2011–12
Agriculture, forestry and fishin
g
Mining and quarryin g
Manufacturing
Electricity, gas andwater suppl
y
Constructio n
Wholesale and retail tradeHotels and restaurantsTransport storage and
communicatio n Financial intermediation Business activities Public administratio n Other services 900 800 700 600 500 400 300 100 200 0
Regional GVA Rest of UK GVA
£m
[image:16.595.36.543.575.755.2]Source: Viewforth modelling system (2013) analysis
Figure 9: Comparison of the occupational profile of employment generated, 2011–12
35,000 0 5,000 10,000 15,000 20,000 25,000 30,000
University jobs Other jobs in the region Jobs in the rest of the UK
Jobs generated (FTE)
Managers an d
administrator s
Professional occupationsAssociate professional an d technical occupations Clerical an d secretarial occupation s
Craft and relate d
occupations
Pers onal and pr
otective
servi
ce occupations Sales oc cupations
Plant and machin e
occupa tions
Other occupations
The economic impact of the London higher education sector
3.5 The impact of student expenditure
3.5.1 Student profile
[image:17.595.103.236.236.368.2]As well as providing educational opportunities for local students, with around 46% of all students coming from London itself, the city’s universities attract a substantial number of students from the rest of the UK and from overseas. Twenty-eight per cent come from the rest of the UK and 26% from other countries.
Figure 11: Student profile by domicile of origin, 2011–12
46%
28% 17% 9%
London students Students from rest of UK Students from rest of EU Students from rest of world
Source: HESA Students in Higher Education Institutions 2011/12
3.5.2 International students
When attracting students from further afield to study in London, London institutions are attracting additional money into the city and boosting export earnings.
• In 2011–12 the region’s universities attracted over 102,995 students from outside the UK. The fees paid by international students to the universities are captured in the university accounts and their impact is included in analysis of the overall institutional impact at sectoral level. (Non-EU students alone paid the universities £867 million in fee income in 2011–12.) Payments to the universities for halls of residence accommodation, or money spent in university cafeterias, bars etc are likewise captured in the institutional impact. However, in addition to any fees or other monies they pay to the university, international students spend money off-campus. This can be on private sector rental, food, entertainment, consumer goods, travel etc. In 2011–12 this off-campus expenditure of international students was estimated as £1.2
billion.34 In this context ‘international’ includes
both students from the rest of the EU and non-EU students, as all of their personal expenditure can be regarded as an injection into the UK economy and thus as export earnings.
• The off-campus expenditure of international students generated £1.7 billion of output (of which £1.3 billion was in London) and over 14,763 full-time jobs throughout the UK (of which 11,337 were in London). The international student expenditure generated £809 million of GVA in the UK. (£582 million regional GVA.)
3.5.3 Students from the rest of the UK
All student expenditure, domestic as well as
international, can be very important to the local and regional economy and is seen by local businesses as a core part of their own revenue stream. There is a visible impact on the areas surrounding a university. The most casual observer can see the plethora of bars, cafés and shops and other services that spring up to serve the student population. Local landlords also benefit from the need for rented accommodation.
The off-campus expenditure of local students – from within the region itself – is not analysed in this study on the basis that the personal living expenditure of local students – as ongoing residents of the region itself – is likely to have happened in the region anyway, irrespective of student status. However, the expenditure of students from outside the region, while not additional to the UK economy as a whole, can be regarded as an injection into the regional economy. Consideration of this element of impact is legitimate in terms of regional policy evaluation.
• In 2011–12, there were 113,995 students from outside the region registered at London higher education institutions.35
• The off-campus expenditure of the 113,995 students from the rest of the UK studying at higher education institutions in London was estimated to be £1.4 billion.
• This off-campus expenditure of students from the rest of the UK generated £1.5 billion of output and 13,447 jobs in London.
• The off-campus expenditure of students from the rest of the UK generated £690 million of regional GVA.
34. International student off-campus expenditure was estimated by drawing on the detailed analysis of international student expenditure carried out for the HM Government International Education Strategy Paper, International Education: Global Growth and Prosperity (July 2013). Overall student spend figures were adjusted downwards to reflect the estimated amount (13%) spent on campus for residence, catering etc. This was done to avoid double counting because amounts spent on campus are already included in the university impact.
The economic impact of the London higher education sector
3.6 Conclusions
[image:18.595.33.540.281.418.2]This study focused on higher education institutions as businesses and the higher education sector in each region as an industry, generating jobs and output through its expenditure. A summary of the results for the modelled analysis for London is provided in Figures 12 and 13. The study shows higher education to be of significant economic importance to the London economy bringing immediate benefits to the city in terms of output generated, jobs created and its contribution to regional GVA.
Figure 12: Total sectoral impact: summary of output generated
Direct
(£ million) impact on UK*‘Knock-on’ Of which accruing to the region (direct & ‘knock-on’)Total UK impact Total impact on the region (direct & ‘knock-on’)
Region HEIs 5,795.60 7,891.50 5,903 13,687 11,698.50 Plus international
students
0 1,744.60 1,276.30 1,744.60 1,276.30 Subtotal 5,795.60 9,636 7,179.30 15,431.63 12,974.80 Plus rest of UK
students
0 1,513.83 1,513.83 1,513.83 1,513.80 Total combined
impact
5,795 11,149.91 8,684.11 16,945.46 14,488.60
* Because of the wider displacement effects of domestic student expenditure (domestic student expenditure can be relevant to the regional economy but is not additional to the UK economy) the knock-on impact of domestic student expenditure only on the UK as a whole is defined to be identically equal to the estimated impact on the region.
Figure 13: Total sectoral impact: summary of employment generated
Direct employment (FTEs)
‘Knock-on’ impact on UK*
Of which accruing to the region
Total UK impact (direct & ‘knock-on’)
Total impact on the region (direct & ‘knock-on’)
HEIs 56,896 78,381 64,241 135,277 121,137 Plus international
students
0 14,763 11,337 14,763 11,337 Subtotal 56,896 93,143 75,578 150,040 132,474 Plus rest of UK
students
0 13,447 13,447 13,447 13,447 Total**
Combined impact
56,896 106,590 89,024 163,486 145,921
* Because of the wider displacement effects of domestic student expenditure (domestic student expenditure can be relevant to the regional economy but is not additional to the UK economy) the knock-on impact of domestic student expenditure only on the UK as a whole is defined to be identically equal to the estimated impact on the region.
[image:18.595.32.547.523.670.2]The economic impact of the London higher education sector
Figure 14: Total sectoral contribution to London GVA
£ million Regional GVA
Direct Secondary Total HEIs 3,699.22 2,902.42 6,601.64 International students 0 581.93 581.93 Students from rest of UK 0 690.21 690.21 Total contribution to GVA 3,699.22 4,174.56 7,873.78
The economic impact of the London higher education sector
ANNEXE A
METHODOLOGY AND DATA SOURCES
The primary focus of the study was the higher education sector in each region as an industry and the impact generated by sector activity during the academic and financial year 2011–12. The study examined the impact of the off-campus expenditure of international students who were studying at the higher education institutions in that year.36 It also
analysed the additional injection into the regional economy of the expenditure of students from the rest of the UK (i.e. from outside the specific region being analysed). While domestic student expenditure is not additional to the UK economy as a whole, it is legitimate at a regional level to consider the money being attracted into a region from the rest of the UK.
The study utilised a two-stage approach to the estimation of the economic impact of each region’s higher education sector. The impact of the higher education institutions on the UK economy was modelled, using a purpose-designed economic model of the UK. Analysis was then undertaken, using a Location Quotient approach, to estimate the share of the institutional impact on the UK likely to have accrued to the region.
The model used was a ‘Type II’ input-output model based on actual UK data derived from the UK Input-Output Tables (Office for National Statistics) together with Labour Force Survey and Annual Business Inquiry data and the 2008 UK Blue Book. The modelling system was updated in 2013 to reflect productivity increases and related economic changes. Additional data sources include the Producers’ Prices Index, ONS Regional Accounts and Local Area Data from the ONS including the Business Register and Employment Survey and other regional labour market data from
nomisweb.co.uk. The core modelling system is based on SOC 2000 and SIC 2003 classifications and this has been used for the one-digit aggregate presentation of results. The modelling system used was purpose-designed for UK higher education institutions and is the most recent version of the Universities UK modelling system. The technical specification for the model is included in The impact of universities on the UK economy (Kelly, McLellan and McNicoll, Universities UK, 2009).
Other data sources and issues arising
The main source of higher education data is the Higher Education Statistics Agency (HESA) publications on higher education finance, staffing and students. These do not, however, completely disaggregate higher education institutions’ revenue sources (for instance they do not separately
identify EU student fees paid from domestic higher education student fees paid). Hence there needs to be additional analysis to estimate overall proportions of income from public, private and international sources. In these studies estimates were made of the EU student fee component of institutional international earnings on the basis of the average fee paid by the UK and EU student group in each region. Where data was not available from HESA, estimates were made of the pattern of public/private/international split of income based on tacit knowledge and observations from previous detailed studies of the income sources of individual universities (making the assumption that the broad pattern of other income sources, e.g. for residence and catering, is likely to be similar for most
institutions).
ANNEXE B
INSTITUTIONS INCLUDED IN THE STUDIES
East of England
Anglia Ruskin University University of Bedfordshire University of Cambridge Cranfield University University of East Anglia University of Essex
University of Hertfordshire
Norwich University College of the Arts Writtle College
East Midlands
Bishop Grosseteste University College Lincoln De Montfort University
University of Derby University of Leicester University of Lincoln Loughborough University The University of Northampton The University of Nottingham Nottingham Trent University
London
Birkbeck, University of London Brunel University
The Institute of Cancer Research Central School of Speech and Drama City University London
Conservatoire for Dance and Drama Courtauld Institute of Art
University of East London
Goldsmiths, University of London University of Greenwich
Guildhall School of Music and Drama Heythrop College
Imperial College London Institute of Education King’s College London Kingston University
University of the Arts London London Business School
University of London (institutes and activities) London Metropolitan University
London South Bank University
London School of Economics and Political Science London School of Hygiene and Tropical Medicine Middlesex University
Queen Mary, University of London Ravensbourne
University of Roehampton Rose Bruford College Royal Academy of Music Royal College of Art
Royal College of Music Royal Veterinary College
St George’s Hospital Medical School St Mary’s University College, Twickenham SOAS, University of London
Trinity Laban Conservatoire of Music and Dance UCL School of Pharmacy
University College London University of West London University of Westminster
North East
Durham University Newcastle University Northumbria University University of Sunderland Teesside University
North West
University of Bolton
University of Central Lancashire University of Chester
University of Cumbria Edge Hill University Lancaster University Liverpool Hope University
Liverpool John Moores University
The Liverpool Institute for Performing Arts University of Liverpool
Manchester Metropolitan University The University of Manchester Royal Northern College of Music University of Salford
South East
University of Brighton
Buckinghamshire New University The University of Buckingham Canterbury Christ Church University University of Chichester
University for the Creative Arts University of Kent
The Open University Oxford Brookes University University of Oxford University of Portsmouth University of Reading
Royal Holloway, University of London Southampton Solent University University of Southampton University of Surrey University of Sussex University of Winchester
The economic impact of the London higher education sector
South West
Bath Spa University University of Bath
Arts University Bournemouth Bournemouth University University of Bristol University of Exeter
University College Falmouth University of Gloucestershire University of St Mark & St John Plymouth University
Royal Agricultural University
University of the West of England, Bristol
West Midlands
Aston University
Birmingham City University University of Birmingham University College Birmingham Coventry University
Harper Adams University College Keele University
Newman University College Staffordshire University The University of Warwick University of Wolverhampton University of Worcester
Yorkshire and Humberside
University of Bradford University of Huddersfield The University of Hull Leeds College of Art
Leeds Metropolitan University University of Leeds
Leeds Trinity University College Sheffield Hallam University The University of Sheffield York St John University The University of York
ANNEXE C
BIBLIOGRAPHY
Department for Business, Innovation and Skills (2012) No stone unturned: in pursuit of growth – Lord Heseltine review
Department for Business, Innovation and Skills (2013) Universities in their local communities, enabling economic growth: Sir Andrew Witty’s Review
Department for Business, Innovation and Skills (2013) Encouraging a British Invention Revolution: Sir Andrew Witty’s Review of Universities and Growth
Department for Business, Innovation and Skills (2013) Student Income and Expenditure Survey 2011/12
Research Paper Number 115
Goddard J, Vallance P (2013) The University and the City London: Routledge
Higher Education Statistics Agency (HESA) (2013) 2011–12 publications on Finance, Staff and Students
HM Government (2010) Local growth: realising every place’s potential London: TSO
HM Government (2013) International Education: Global Growth and Prosperity London: BIS
Kelly U, McLellan D, McNicoll I (2007) The economic impact of UK higher education institutions London: Universities UK
Kelly U, McLellan D, McNicoll I (2009) The impact of universities on the UK economy London: Universities UK
Nomisweb (www.nomisweb.co.uk)
Office for National Statistics (2008) United Kingdom, Input-Output Analyses
Office for National Statistics (2008) United Kingdom National Accounts: The Blue Book Newport: ONS Office for National Statistics Regional Accounts
Office for National Statistics Regional Summary of Labour Markets Headline Indicators
Office for National Statistics Business Register and Employment Survey (BRES)
Higher education in focus
Universities UK’s Higher education in focus series covers additions to the evidence base to inform higher education policy development, and is the brand of Universities UK’s analytical unit. The series includes the unit’s in-house analysis and research, external research that the unit has commissioned, and data visualisations and infographics by the unit.
Designed by Soapbox
This publication has been produced by Universities UK, the representative organisation for the UK’s universities. Founded in 1918, its mission is to be the definitive voice for all universities in the UK, providing high quality leadership and support to its members to promote a successful and diverse higher education sector. With 134 members and offices in London, Cardiff and Edinburgh, it promotes the strength and success of UK universities nationally and internationally.
Woburn House 20 Tavistock Square London WC1H 9HQ
Tel: +44 (0)20 7419 4111
Email: info@universitiesuk.ac.uk Website: www.universitiesuk.ac.uk Twitter: @UniversitiesUK
ISBN: 978-1-84036-308-1
© Universities UK
April 2014
To download this publication, or for the full list of Universities UK publications, visit www.universitiesuk.ac.uk
Printed by Universities UK Facilities Unit. To discuss your printing needs email