Statistical
First Release
GCSE AND EQUIVALENT ATTAINMENT BY PUPIL CHARACTERISTICS IN ENGLAND, 2012/13
This statistical release provides revised 2012/13 information on key stage 4 attainment by pupil gender, ethnicity, English as a first language, eligibility for free school meals (FSM), disadvantage, special educational needs (SEN) and Income Deprivation Affecting Children Index (IDACI). It covers pupils in state-funded schools in England, including academies and city technology colleges and provides information at national and local authority (LA) level.
HEADLINES
Girls continue to outperform boys
The gap between the percentage of girls and boys achieving 5 or more GCSEs at grade A* to C or equivalent including English and mathematics has widened slightly to 10.1 percentage points from 9.5, with 65.7 per cent of girls achieving this indicator compared to 55.6 per cent of boys.
Chinese pupils remain the highest attaining ethnic group
The percentage of Chinese pupils achieving 5 or more GCSEs at grade A* to C or equivalent including English and mathematics is 17.5 percentage points above the national average.
Pupils of any black background have seen a large improvement
The percentage of black pupils achieving 5 or more GCSEs at grade A* to C or equivalent including English and mathematics has increased by 3.5 percentage points since 2011/12. The gap compared to the national average has narrowed by 1.7 percentage points since 2011/12.
The FSM attainment gap has remained broadly the same
The attainment gap for achieving 5 or more GCSEs at grade A* to C or equivalent including English and mathematics is 26.7 percentage points SFR 05/2014
23 January 2014
Coverage: England
Theme: Children, Education and Skills
Issued by
Department for Education Sanctuary Buildings Great Smith Street London SW1P 3BT
Telephone: Press Office 020 7925 6789 Public Enquiries 0870 000 2288
What does this statistical release cover?
This statistical first release examines attainment gaps for the main attainment indicators listed below for various pupil characteristics including gender, ethnicity, English as a first language, eligibility for free school meals (FSM), disadvantage, special educational needs (SEN) and Income Deprivation Affecting Children Index (IDACI). It looks at how these have changed compared with the previous year and over a longer times series.
The main attainment indicators included in the tables are the percentages of pupils achieving:
5 or more GCSEs at grade A* to C or equivalent;
5 or more GCSEs at grade A* to C or equivalent including English and mathematics GCSEs or iGCSEs;
the English Baccalaureate;
expected progress between key stage 2 and Key Stage 4 in English; expected progress between key stage 2 and Key Stage 4 in mathematics; English and mathematics GCSEs or iGCSEs at grade A* to C;
5 or more GCSEs at grade A* to G or equivalent;
5 or more GCSEs at grade A* to G or equivalent including English and mathematics GCSEs or iGCSEs.
This commentary concentrates on the first five of these indicators.
All gaps and differences have been calculated on unrounded data therefore some figures may not add up in this text
Why monitor the attainment gaps between key disadvantaged groups and what is being done to improve these outcomes?
This statistical release is the main source of information key stage 4 attainment gaps between key disadvantaged groups in England. It is used to inform policy decisions which aim to close these gaps.
Closing the gap between the attainments of key disadvantaged groups remains a high priority of the department. Without this information it would be very difficult for ministers, Parliament, central and local government, pressure groups and the public to monitor
CONTENTS
HEADLINES ... 1
CONTENTS ... 3
AREAS OF INTEREST ... 4
English Baccalaureate ... 4
Disadvantaged pupils ... 5
1. Attainment gaps for main key stage 4 attainment indicators by key characteristics ... 7
1.1 Free School Meal (FSM) Eligibility ... 7
1.2 Gender ... 8
1.3 Ethnicity ... 10
1.4 English as a first language ... 11
1.5 Special Educational Needs (SEN) ... 12
1.6 Income Deprivation Affecting Children Index (IDACI) ... 13
2. Impact indicators at key stage 4. ... 14
2.1 Impact indicator 3.8 ... 14
2.2 Impact indicator 5.18 ... 14
TABLES ... 15
National tables ... 15
Local Authority tables ... 15
Pupil residency-based tables ... 15
School location-based tables ... 16
Parliamentary constituency tables ... 16
AREAS OF INTEREST
This section provides additional analysis on data which are of interest or which are frequently asked about.
English Baccalaureate
The English Baccalaureate (EBacc) was first introduced for the academic year 2009/10. It aims to recognise pupils’ achievements across a core of selected academic subjects including English, mathematics, at least two sciences, a language, and either history or geography. It is compulsory for pupils to study English, mathematics and one science. All of the non-compulsory subjects have shown an increase in entries since 2009/10. Further information and the exact qualifications included in the measure are available here.
There has been a national increase in the English Baccalaureate entries by 12.4 percentage points, with 35.5 per cent of pupils entering the English Baccalaureate in 2012/13.
Chart 1: Percentage of pupils entering the English Baccalaureate by key groups for 2011/12 and 2012/13*
All groups have seen an increase in English Baccalaureate entries from the previous year. Chinese pupils are well above the national level for English Baccalaureate entries with 55.6 per cent entering compared to the national average of 35.5 per cent. Pupils from a white or black background have the lowest percentage of entries, with both having entries slightly below the national level. Pupils with SEN have the lowest percentage of English
Chart 2: Percentage of pupils achieving the English Baccalaureate by key groups, 2011/12 and 2012/13*
All key groups have seen an increase in English Baccalaureate achievement in 2012/13 compared to the previous year. Chinese pupils have seen the largest increase with 46.2 per cent achieving the English Baccalaureate in 2012/13, and increase of 11.0 percentage points. Pupils from any white background have seen the smallest increase with 22.2 per cent achieving the English Baccalaureate; this has increased by 6.2 per cent since 2011/12. Pupils from any white or black background still remain below the national level for English Baccalaureate achievement. There are still more girls achieving the English Baccalaureate compared to boys, with 27.5 per cent of girls achieving the English Baccalaureate compared to only 18.3 per cent of boys. This gap has widened by 3.4 percentage points in 2012/13. Pupils eligible for free school meals, those with SEN, or who are disadvantaged continue to achieve below the national level.
Disadvantaged pupils
Prior to 2012, disadvantaged pupils were defined as those pupils known to be eligible for free school meals (FSM) at the time of the Spring School Census or who were looked after children (CLA) (children looked after by the local authority at any point during the year ending 31 March, who had been looked after continuously for 6 months).
Chart 3: Disadvantaged pupil attainment compared to all other pupils for the main key stage 4 indicators, 2011/12 to 2012/13*
Disadvantaged pupils have seen an improvement in attainment in all of the main key stage 4 indicators since 2011/12.
The percentage of disadvantaged pupils achieving 5 or more A* to C grades including English and mathematics has increased by 5.3 percentage points, with 40.9 per cent of disadvantaged pupils achieving this measure. The gap between the percentage of disadvantaged pupils achieving 5 or more GCSEs at grade A* to C including English and mathematics and all other pupils is 26.9 percentage points; this gap has remained broadly similar to 2011/12.
The gap between disadvantaged pupils and all other pupils has widened by 4.5 percentage points in 2012/13 for achieving the English Baccalaureate.
The attainment gap between disadvantaged pupils making expected progress in English and all other pupils is 18.9 percentage points. The gap is larger for expected progress in mathematics at 22.7 percentage points. Both gaps have remained broadly similar to 2011/12.
1. Attainment gaps for main key stage 4 attainment indicators by key characteristics
1.1 Free School Meal (FSM) Eligibility
Pupils known to be eligible for FSM performed less well as a group in all the main indicators at key stage 4, compared to all other pupils.
Chart 4: Percentage of pupils achieving 5 or more GCSEs at grade A* to C or equivalent, and 5 or more GCSEs at grade A* to C or equivalent including English and mathematics GCSEs or iGCSEs, 2008/09-2012/13* by FSM eligibility
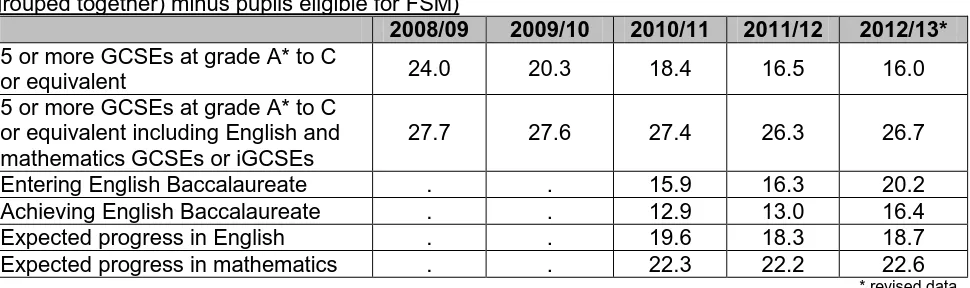
Table 1: FSM attainment gaps 2008/09 to 2012/13*
(All other pupils (pupils known not to be eligible for FSM and pupils with unknown eligibility grouped together) minus pupils eligible for FSM)
2008/09 2009/10 2010/11 2011/12 2012/13* 5 or more GCSEs at grade A* to C
or equivalent 24.0 20.3 18.4 16.5 16.0
5 or more GCSEs at grade A* to C or equivalent including English and mathematics GCSEs or iGCSEs
27.7 27.6 27.4 26.3 26.7
Entering English Baccalaureate . . 15.9 16.3 20.2
Achieving English Baccalaureate . . 12.9 13.0 16.4
Expected progress in English . . 19.6 18.3 18.7
Expected progress in mathematics . . 22.3 22.2 22.6
* revised data
A lower percentage of pupils eligible for FSM made expected progress in English, with 54.4 per cent of pupils eligible for FSM making this, compared with 73.1 per cent of all other pupils – a gap of 18.7 percentage points. For mathematics, the gap is wider at 22.6 percentage points. Both progress gaps have remained broadly the same since 2011/12. There are variations in pupil achievement across key groups of interest. These are illustrated by comparisons with the national average:
27.9 per cent of white British boys eligible for FSM achieved 5 or more GCSEs at grade A* to C or equivalent including English and mathematics GCSEs or iGCSEs, compared with the national average of 60.6 per cent – a gap of 32.7 percentage points, broadly in line with the 2011/12 gap. The gap has widened by 1.0 percentage point since 2008/09
43.1 per cent of black boys eligible for FSM achieved 5 or more GCSEs at grade A* to C or equivalent including English and mathematics GCSEs or iGCSEs an increase of 2.8 percentage points since 2011/12. This compares with the overall national level of 60.6 per cent – an attainment gap of 17.5 percentage points. The gap has narrowed by 1.0 percentage point since last year and by 4.4 percentage points since 2008/09
36.9 per cent of black Caribbean boys with FSM achieved 5 or more GCSEs at grade A* to C or equivalent including English and mathematics GCSEs or iGCSEs an increase of 4.9 percentage points since last year. The gap has narrowed by 3.1 percentage points since 2011/12.
1.2 Gender
Girls continue to outperform boys at all the main attainment indicators at key stage 4.
The gap between the percentage of girls and boys achieving 5 or more GCSEs at grade A* to C or equivalent is 6.9 percentage points, with 86.5 per cent of girls achieving this indicator compared to 79.6 per cent of boys. This gap has steadily decreased from 8.1 percentage points in 2008/09.
2012/13 compared to 55.6 per cent of boys. However, when looking in more detail at the year on year trends, the gap remained relatively stable before widening by 2.2 percentage points between 2010/11 and 2011/12, and then again in 2012/13 due to larger increases in girls’ attainment.
The chart below shows the percentage of girls and boys achieving 5 or more GCSEs at grade A* to C or equivalent, and 5 or more GCSEs at grade A* to C or equivalent including English and mathematics GCSEs or iGCSEs in each year since 2008/09.
Chart 5: Percentage of pupils achieving 5 or more GCSEs at grade A* to C or equivalent, and 5 or more GCSEs at grade A* to C or equivalent including English and mathematics GCSEs or iGCSEs by gender, 2008/09-2012/13*.
In 2012/13 there has been a large increase in those entering the English Baccalaureate, 39.6 per cent of girls were entered for all the subject areas of the English Baccalaureate, compared with 31.5 per cent of boys. This is an increase of 14.0 percentage points for girls and 10.8 percentage points for boys since 2011/12. The gap between the percentage of girls and boys achieving the English Baccalaureate is 9.2 percentage points, with 27.5 per cent of girls achieving the English Baccalaureate, compared with 18.3 per cent of boys. This is an increase in the gender attainment gap by 3.4 percentage points since 2011/12.
1.3 Ethnicity
The percentage of pupils achieving 5 or more GCSEs at grade A* to C or equivalent including English and mathematics GCSEs or iGCSEs continues to vary between different ethnic groups. Within each of these broad ethnic groups, the individual ethnic groups show further variability which can be seen in the chart below.
Chart 6: Percentage of pupils achieving 5 or more GCSEs at grade A* to C or equivalent including English and mathematics GCSEs or iGCSEs by ethnic group, 2008/09 and 2012/13*.
Within the broader ethnic groupings:
Chinese pupils remain the highest attaining ethnic group. The percentage of Chinese pupils achieving 5 or more GCSEs at grade A* to C or equivalent including English and mathematics GCSEs or iGCSEs is 17.5 percentage points above the national average. The percentage of Chinese pupils achieving 5 or more GCSEs at grade A* to C or equivalent including English and mathematics GCSEs or iGCSEs increased by 1.6 percentage points in 2012/13, having decreased by 2.1 percentage points in the previous year. Despite this, the overall attainment gap for this indicator between Chinese pupils and the national average continues to remain at its lowest level, and has narrowed by 3.4 percentage points since 2008/09.
Pupils from any Asian or mixed background continue to perform above the national average – pupils of any Asian background by 3.6 percentage points and pupils from any mixed background by 2.0 percentage points. Pupils from any white background performed broadly in line with the national average.
Chinese pupils remain the highest attaining ethnic group for the English Baccalaureate, with 46.2 per cent of Chinese pupils achieving the English Baccalaureate, 23.4 percentage points higher than the national level, this gap has widened by 4.3 percentage points since 2011/12. Only 19.6 per cent of pupils of any black background achieve the English Baccalaureate, 3.1 percentage points below the national level; however this gap has narrowed by 1.6
percentage points since 2011/12.
The percentage of pupils making expected progress follows similar patterns to 2011/12. Within the broader ethnic groupings:
Chinese pupils made expected progress well above the national average in both English (18.1 percentage points above the national average) and mathematics (24.1 percentage points above the national average). The gap between Chinese pupils and the national average has narrowed for mathematics (by 1.2 percentage points) but has widened for English (by 1.0 percentage points)
Whilst the attainment of pupils of any black background is below the national average, the percentage making expected progress remains above the national average (by 5.8 percentage points for English and 3.5 percentage points for mathematics).
Pupils of any white background were the only ethnic group whose progress was below the national average in both English and mathematics, by 1.3 percentage points for both subjects; this is broadly in line with 2011/12.
1.4 English as a first language
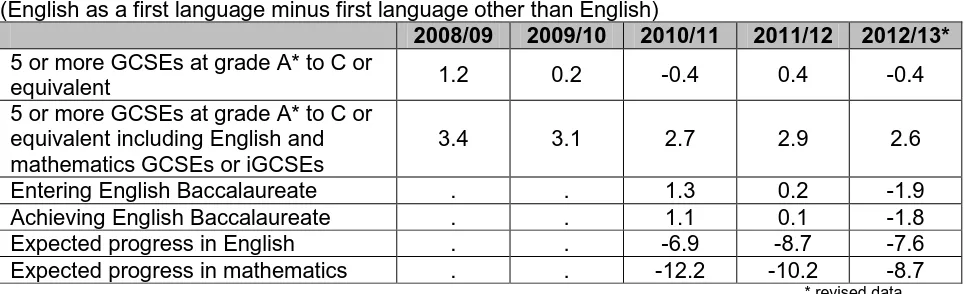
[image:11.595.72.555.564.711.2]When comparing the percentage achieving 5 or more GCSEs at grade A* to C or equivalent including English and mathematics GCSEs or iGCSEs, pupils whose first language is English (60.9 per cent) performed better as a group than pupils whose first language is other than English (58.3 per cent).
Table 2: First Language attainment gaps 2008/09 to 2012/13* (English as a first language minus first language other than English)
2008/09 2009/10 2010/11 2011/12 2012/13*
5 or more GCSEs at grade A* to C or
equivalent 1.2 0.2 -0.4 0.4 -0.4
5 or more GCSEs at grade A* to C or equivalent including English and mathematics GCSEs or iGCSEs
3.4 3.1 2.7 2.9 2.6
Entering English Baccalaureate . . 1.3 0.2 -1.9
Achieving English Baccalaureate . . 1.1 0.1 -1.8
Expected progress in English . . -6.9 -8.7 -7.6
Expected progress in mathematics . . -12.2 -10.2 -8.7
The percentage of pupils in each group achieving the English Baccalaureate has increased however pupils whose first language is other than English are now performing better; 24.4 per cent of pupils whose first language is other than English are now achieving this indicator compared with 22.5 per cent of pupils whose first language is English.
A higher percentage of pupils whose first language is other than English made expected progress in English than those whose first language is English. The gap narrowed by 1.2 percentage points from 8.7 percentage points in 2011/12 to 7.6 percentage points in 2012/13. The gap is wider for mathematics, although the gap continued to narrow in 2012/13, from 10.2 percentage points to 8.7 percentage points.
1.5 Special Educational Needs (SEN)
A higher percentage of pupils without any identified SEN achieved all the main indicators at key stage 4 compared with pupils with SEN (including pupils with a statement of SEN and pupils without a statement of SEN).
[image:12.595.71.551.402.552.2]The attainment gap between the percentage of pupils with and without any identified SEN achieving 5 or more GCSEs at grade A* to C or equivalent including English and mathematics GCSEs or iGCSEs is 47.0 percentage points – 70.4 per cent of pupils with no identified SEN achieved this compared with 23.4 per cent of pupils with SEN. This gap has widened by 2.1 percentage points since 2008/09 but has remained broadly unchanged since 2011/12.
Table 3: SEN attainment gaps 2008/09 to 2012/13* (No identified SEN minus any identified SEN)
2008/09 2009/10 2010/11 2011/12 2012/13*
5 or more GCSEs at grade A* to C or
equivalent 44.0 38.8 35.0 31.8 30.8
5 or more GCSEs at grade A* to C or equivalent including English and mathematics GCSEs or iGCSEs
44.9 46.1 47.4 46.8 47.0
Entering English Baccalaureate . . 21.2 22.0 31.5
Achieving English Baccalaureate . . 16.8 17.0 23.1
Expected progress in English . . 31.2 30.3 30.9
Expected progress in mathematics . . 37.7 36.5 37.0
* revised data
The attainment gap between the percentage of pupils with and without any identified SEN achieving the English Baccalaureate is 23.1 percentage points – 27.6 per cent of pupils with no identified SEN achieved this compared with 4.5 per cent of pupils with SEN. The gap has widened by 6.2 percentage points compared to 2011/12.
A lower percentage of pupils with SEN made expected progress in both English and mathematics. The gap is wider for mathematics at 37.0 percentage points, compared to a gap of 30.9 percentage points for English. Both gaps have widened slightly between 2011/12 and 2012/13 (by 0.6 percentage points for mathematics and 0.7 percentage points for English).
Of pupils with a specified primary need:
GCSEs at grade A* to C or equivalent including English and mathematics GCSEs or iGCSEs. This is below the level achieved by all SEN pupils of 23.4 per cent.
Those with a visual or hearing impairment continue to be the highest performers of pupils with a SEN in all the main attainment indicators at KS4. Compared to 2011/12, the percentage of pupils with a hearing impairment achieving 5 or more GCSEs at grade A* to C or equivalent including English and mathematics GCSEs or iGCSEs increased by 5.3 percentage points to 42.7 per cent, whilst for pupils with a visual impairment there was an decrease of 1.5 percentage points to 45.0 per cent. However, care should be taken in making comparisons due to the low number of pupils in these groups.
1.6 Income Deprivation Affecting Children Index (IDACI)
Deprived areas are defined by the Income Deprivation Affecting Children Index (see the ‘Technical Notes’ section for more details).
Table 4: Attainment gaps for deprivation, 2010/11 to 2012/13* (Least deprived minus most deprived)
2010/11 2011/12 2012/13* 5 or more GCSEs at grade A* to C or
equivalent including English and mathematics GCSEs or iGCSEs
33.7 30.6 29.5
A*-C in English and mathematics
GCSEs 33.7 30.5 29.4
Entering English Baccalaureate 28.6 27.2 27.5 Achieving English Baccalaureate 24.1 23.3 25.0
* revised data
The attainment gap between pupils resident in the most deprived and least deprived areas has narrowed or remained broadly the same for the main attainment indicators in 2012/13. The largest attainment gap between pupils resident in the most deprived and least deprived areas when looking at the main key stage 4 attainment indicators is the percentage
achieving 5 or more GCSEs at grade A* to C or equivalent including English and
mathematics GCSEs or iGCSEs which stands at 29.5 percentage points in 2012/13, this has narrowed by 1.1 percentage points since 2011/12.
2. Impact indicators at key stage 4.
Through the Department’s Business Plan, the Department is committed to publishing information relating to key stage 4 attainment gaps between pupils eligible for FSM and the rest (impact indicator 3.8) and between schools with the greatest and the least proportions of disadvantaged pupils (impact indicator 5.18). The Department’s Business Plan indicators are available here.
2.1 Impact indicator 3.8
The attainment gap for pupils achieving the basics (English and mathematics GCSEs or iGCSEs at grade A* to C) between pupils known to be eligible for FSM and the rest is 26.5 percentage points. This gap has remained broadly similar to 2011/12 where the gap was 26.2 percentage points.
2.2 Impact indicator 5.18
TABLES
National tables
Summary: Achievements at GCSE and equivalent for pupils at the end of Key Stage 4 by pupil characteristics, 2008/09 to 2012/13 (revised)
Table 1: Achievements at GCSE and equivalent for pupils at the end of Key Stage 4 by pupil characteristics, 2008/09 to 2012/13 (revised)
Table 2a: Achievements at GCSE and equivalent for pupils at the end of Key Stage 4 by ethnicity, free school meal eligibility and gender, 2008/09 to 2012/13 (revised)
Table 2b: Achievements at GCSE and equivalent for pupils at the end of Key Stage 4 by SEN provision, free school meal eligibility and gender, 2008/09 to 2012/13 (revised)
Table 2c: Achievements at GCSE and equivalent for pupils at the end of Key Stage 4 by SEN provision, ethnicity and gender, 2008/09 to 2012/13 (revised)
Impact Indicator 3.8: Attainment gap at age 16 between Free School Meal pupils and the rest, 2011/12 to 2012/13 (revised)
Impact Indicator 5.18: Attainment gap between schools with the greatest and the least proportions of disadvantaged pupils, 2011/12 to 2012/13 (revised) Local Authority tables
Table 3: Achievements at GCSE and equivalent for pupils at the end of Key Stage 4 by ethnicity and local authority, 2008/09 to 2012/13 (revised)
Table 4: Achievements at GCSE and equivalent for pupils at the end of Key Stage 4 by English as a first language and local authority, 2008/09 to 2012/13 (revised)
Table 5: Achievements at GCSE and equivalent for pupils at the end of Key Stage 4 by free school meal eligibility and local authority, 2008/09 to 2012/13 (revised) Table 6: Achievements at GCSE and equivalent for pupils at the end of Key Stage 4
by SEN provision and local authority, 2008/09 to 2012/13 (revised) Pupil residency-based tables
Table A1: Achievements at GCSE and equivalent for pupils at the end of Key Stage 4 by IDACI decile of pupil residence, 2008/09 to 2012/13 (revised)
Table A2: Achievements at GCSE and equivalent for pupils at the end of Key Stage 4 by degree of rurality of pupil residence, 2008/09 to 2012/13 (revised)
Table A4: Achievements at GCSE and equivalent for pupils at the end of Key Stage 4 by IDACI decile and degree of rurality of pupil residence, 2008/09 to 2012/13 (revised)
School location-based tables
Table B1: Achievements at GCSE and equivalent for pupils at the end of Key Stage 4 by degree of rurality of school location, 2012/13 (revised)
Table B2: Achievements at GCSE and equivalent for pupils at the end of Key Stage 4 by local authority district and region of school location, 2012/13 (revised) Parliamentary constituency tables
Table C: Achievements at GCSE and equivalent for pupils at the end of key stage 4 by parliamentary constituency of school location, 2012/13
Transparency
As part of a Government drive for data transparency in official publications, supporting data for this publication is published in an open standardised format. This is available at
http://www.education.gov.uk/researchandstatistics/statistics/allstatistics/a00219200/gcse-
and-equivalent-attainment-Related Publications
SFR 01/2014: GCSE and Equivalent Results in England, 2012/13 (Revised)
http://www.education.gov.uk/researchandstatistics/statistics/allstatistics/a00219173/gcse-and-equivalent-results
SFR02/2014: A Level and Other Level 3 Results in England, academic year 2012-13 (Revised)
http://www.education.gov.uk/researchandstatistics/statistics/allstatistics/a00219213/a-level-results-england-2011-12.
SFR04/2013: GCSE and Equivalent Attainment by Pupil Characteristics in England, 2011/12
https://www.gov.uk/government/publications/gcse-and-equivalent-attainment-by-pupil-characteristics-in-england
SFR51/2013: National Curriculum Assessments at Key Stage 2 in England, 2012/13 (Revised)
https://www.gov.uk/government/publications/national-curriculum-assessments-at-key-stage-2-2012-to-2013
SFR37/2013: Phonics Screening Check and National Curriculum Assessments at Key Stage 1 in England, 2013
https://www.gov.uk/government/publications/phonics-screening-check-and-national-curriculum-assessments-at-key-stage-1-in-england-2013
SFR 47/2013: EYFSP attainment by pupil characteristics: 2013
https://www.gov.uk/government/publications/eyfsp-attainment-by-pupil-characteristics-2013
SFR21/2013: Schools, Pupils and their Characteristics, January 2013:
Examination Results in Wales, 2012/13: This publication is produced by the Welsh
Government and provides updated results of external examinations taken by pupils aged 15 or 17 in schools in Wales in 2011/12. It was published on 27 November 2013 and is
available at:
http://wales.gov.uk/topics/statistics/headlines/schools2012/121206/?lang=en
The Department for Education Northern Ireland (DENI) have published GCSE headline statistics 2013 on their website, and is available at: http://www.deni.gov.uk/index/facts-and- figures-new/education-statistics/115-curriculum-and-assessment-qualifications-pg/gcse-headline-statistics-2013.htm
Summary Statistics for Schools in Scotland, No.4: 2013 Edition 11th December, 2013. Annual summary statistics can be found in this bulletin covering pupils, teachers, pre-school children, school attendance, exclusions, examination results, destinations on leaving school and school buildings: http://www.scotland.gov.uk/Publications/2013/12/4199
Parliamentary constituency time series of key attainment indicators at the end of key stage 4 can be found on the “In Your Area” website. http://www.education.gov.uk/inyourarea/
NATIONAL STATISTICS PUBLICATION
The United Kingdom Statistics Authority has designated these statistics as National
Statistics, in accordance with the Statistics and Registration Service Act 2007 and signifying compliance with the Code of Practice for Official Statistics.
Designation can be broadly interpreted to mean that the statistics: meet identified user needs
are well explained and readily accessible are produced according to sound methods, and
are managed impartially and objectively in the public interest
Once statistics have been designated as National Statistics it is a statutory requirement that the Code of Practice shall continue to be observed.
The department has a set of statistical policies in line with the Code of Practice for Official Statistics, these are published at: www.statisticsauthority.gov.uk/assessment/code-of-practice/index.html
CONFIDENTIALITY
The Code of Practice for Official Statistics requires that reasonable steps should be taken to ensure that all published or disseminated statistics produced by the DfE protect
confidentiality.
Every effort has been made to ensure the tables do not allow the identification of individuals. To protect confidentiality, low numbers of entries by either males or females in a particular subject will result in both sets of figures being suppressed. Where the total number of entries is very low, the numbers achieving each grade are suppressed. This suppression is
consistent with the Departmental statistical policy which can be found at:
KEY TO SYMBOLS
The following symbols have been used within this publication: 0 – zero
x – small number suppressed to preserve confidentiality (.)– data not applicable
ROUNDING
Percentages in this SFR are given to 1 decimal place. The rounding convention is as follows: any fractions of 0.05 and above will be rounded up, anything less than 0.05 will be rounded down, e.g. 85.586 will be rounded to 85.6; 85.4283 will be rounded to 85.4.
REVISIONS
2012/13 figures in this publication are based on revised data. There is no plan to re-issue this publication with final 2012/13 figures but final figures for 2012/13 will be made available in next year’s release. Any unplanned revisions will be made in accordance with the
Departmental statistical policy on revisions which can be found at:
www.gov.uk/government/publications/standards-for-official-statistics-published-by-the-department-for-education
PUBLISHED FIGURES
There are two types of figures in this publication: 1. The total number of pupils in a given group.
2. The percentage of this group that attained a certain indicator, for example the percentage achieving 5 or more GCSEs at grade A* to C or equivalent.
Percentages are rounded to 1 decimal place. The underlying figures used to calculate these percentages can be found at:
http://www.education.gov.uk/researchandstatistics/statistics/allstatistics/a00219200/gcse-
and-equivalent-attainment-There are some pupils for whom ethnicity was not obtained, refused or could not be determined. These pupils appear as “unclassified” in the “Summary” table, Table 1, Table 2a and Table 2c. These pupils are not shown explicitly in Table 3 but they are still eligible for the results and contribute to the “All pupils” figures. Therefore, adding together the number of pupils in each ethnic category of Table 3 will not necessarily equal the total number of pupils.
Likewise, there are pupils for whom first language, FSM eligibility or SEN status was not recorded. They appear as “unclassified” in the “Summary” table and Table 1 (excluding unclassified SEN) and contribute to the “All pupils” figures elsewhere.
Worked example
Total Number not achieving 5+ A*-C grades
Number achieving 5+ A*-C grades
Number of pupils on roll 140 N/A N/A
Number of pupils included
in the national results 141 21 120
In the example above there are 140 pupils on roll. The number of pupils included in the national results achieving 5 or more GCSEs at grade A* to C or equivalent is 120. Therefore the percentage achieving 5 or more GCSEs at grade A* to C or equivalent would be calculated as
YOUR FEEDBACK
Please contact Jenny Easby at attainment.statistics@education.gsi.gov.uk if you have comments on the content or presentation of this release so that we can take account of your needs in future editions.
TECHNICAL NOTES
Source of data
The 2012/13 figures in this SFR cover the data collated for the 2012 Secondary School Performance Tables. From 2005 the Performance Tables reported results based on pupils at the end of Key Stage 4. This publication includes tables only for pupils at the end of Key Stage 4.
The final 2008/09 to 2011/12 figures in this SFR are taken from the National Pupil Database (NPD). Please see the ‘Source of data’ section in SFR03/2012
http://www.education.gov.uk/researchandstatistics/statistics/allstatistics/a00202462/gcse-equivalent-attainment-pupil-characteristics for further information about the NPD.
Coverage Information
This SFR covers pupils in state-funded schools including academies, free schools and city technology colleges.
Figures report achievements at GCSE or equivalent for different groups of pupils at the end of Key Stage 4. The general range of qualifications, together with the qualification families into which they fall, is available in the ‘Technical notes’ section of
http://www.education.gov.uk/researchandstatistics/statistics/allstatistics/a00219173/gcse-and-equivalent-results.
iGCSEs
International General Certificate of Secondary Education. A number of these qualifications are now regulated as Level 1/2 Certificates and the ‘legacy’ iGCSEs in those subjects that have been regulated are included and counted in the same way as a GCSE in this publication. Further details, including a list of accredited iGCSEs, can be found in the ‘Technical notes’ section of
http://www.education.gov.uk/researchandstatistics/statistics/allstatistics/a00219173/gcse-and-equivalent-results.
English Baccalaureate (EBacc)
This was introduced into the Performance Tables in 2010 with the aim of recognising pupils’ achievements across a core of selected academic subjects. The EBacc covers achievement in GCSE (or regulated iGCSE) English, mathematics, sciences, a language (including Latin, classical Greek or ancient Hebrew) and a humanities subject (history or geography). Further information and the exact qualifications included in the measures are available here:
http://www.education.gov.uk/schools/performance/secondary_12/documents.html.
English qualifications
Information about the introduction of new GCSEs in English and the methodology for including them in indicators was included in the provisional SFR ‘GCSE and Equivalent Results (Provisional) and National Curriculum Teacher Assessments at Key Stage 3 in England, 2011/12’ published in October 2012. In summary, the following qualifications are counted as English:
Legacy GCSE or iGCSE English (qualifications taken before summer 2012)
One qualification in GCSE English which includes modules in English Language and English Literature
Two qualifications taken together:
- qualifications in English language: the Cambridge International Certificate, the Certificate offered by Edexcel or the new specification GCSE and
- English Literature
Information was also included about the variation in achievement rates across the different GCSE specifications to help explain the overall fall in English A*-C pass rate when averaged across all specifications. The A*-C pass rate for those who entered GCSE English remains at 69 per cent and has not changed from the figure published in the provisional SFR (Table 8). Outcomes using revised data are very similar. The provisional SFR can be found here:
http://www.education.gov.uk/researchandstatistics/statistics/allstatistics/a00214981/gcse-national-curriculum-teacher-assessment-ks3-england
Progress measures
Impact indicators
Through the Department’s Business Plan, the Department committed to publish information relating to Key Stage 4 attainment gaps between pupils eligible for Free School Meals (FSM) and the rest (Impact Indicator 3.8) and between schools with the greatest and the least proportions of disadvantaged pupils (Impact Indicator 5.18) as part of the set of Impact Indicators. The Business Plan, updated in May 2012, is available here:
www.education.gov.uk/aboutdfe/departmentalinformation/business%20plan/a00209692/busi nessplan2012
The Department’s indicators are now available here:
http://www.education.gov.uk/researchandstatistics/statistics/keystatistics
Impact Indicator 3.8 is calculated from the percentage of all other pupils (those known not to be eligible for FSM or with an unclassified status) achieving an A*-C grade in English and mathematics GCSEs minus the percentage of pupils known to be eligible for FSM achieving an A*-C grade in English and mathematics GCSEs.
Impact Indicator 5.18 is calculated from the percentage of the Key Stage 4 cohort achieving an A*-C grade in English and mathematics GCSEs in the 10 per cent of schools with the lowest proportion of disadvantaged pupils minus the percentage of the Key Stage 4 cohort achieving an A*-C grade in English and mathematics GCSEs in the 10 per cent of schools with the highest proportion of disadvantaged pupils. For a definition of disadvantaged pupils please see the section further below.
Special Educational Needs (SEN)
Pupils with special educational needs have learning difficulties or disabilities that make it harder for them to learn than most pupils of the same age.
Pupils with special educational needs comprise those at School Action, School Action Plus or with statements of SEN:
School Action – where extra or different help is given, from that provided as part of the school’s usual curriculum.
School Action Plus – where the class teacher and the SENCO receive advice or support from outside specialists (the specialist teacher, an educational psychologist, a speech and language therapist or other health professionals).
Statement – a pupil has a statement of SEN when a formal assessment has been made. A document setting out the child’s needs and the extra help they should receive is in place.
.
Disadvantaged pupils
Year 1 (i.e. not including nursery or Reception). For Key Stage 4 pupils in 2012, this would mean those eligible for FSM in any of Years 6 to 11.
Attainment measures for disadvantaged pupils have also been revised to include pupils eligible for free school meals at any point in the last 6 years. However only data from the Spring Census is included in the 2011 measure (i.e. it does not include data from other termly, AP or PRU collections). It is not considered that this will have a significant impact on the attainment percentages reported and attainment gaps derived are considered robust. Income Deprivation Affecting Children Index (IDACI)
IDACI is provided by the Department for Communities and Local Government (DCLG). The index is based on Super Output Areas (SOAs) in England. Each SOA is given a rank between 1 and 32,482 where 1 is the most deprived SOA.
IDACI is a subset of the Income Deprivation Domain of the Index of Multiple Deprivation. Each SOA is given a score showing the percentage of pupils aged under 16 that live in families that are income deprived, i.e. they are in receipt of certain benefits and their equalised income is below 60 per cent of median before housing costs. Further information about IDACI can be found at:
https://www.gov.uk/government/publications/english-indices-of-deprivation-2010.
The IDACI bands used in this publication are based on 2010 IDACI scores. Care should be taken when comparing to IDACI band breakdowns for 2008, 2009 and 2010, which are based on 2007 IDACI scores. Care should also be taken when comparing to IDACI tables for 2007 and earlier, which are based on 2004 IDACI scores.
Rural and Urban Area Classification
The Rural and Urban Area Classification is a product of a joint project to produce a single and consistent classification of urban and rural areas. The project was sponsored by a number of Government Departments. The rural and urban definitions classify Output Areas, Wards and Super Output Areas by aggregating the underlying hectare grid squares classifications for the measures of settlement size and sparsity. Up to 8 classes of Output Areas could be distinguished; four settlement types (urban, town and fringe, village, hamlet and isolated dwelling) in either a sparse or less sparse regional setting. Further information about the Rural and Urban Area Classification 2004 can be found on the National Statistics website at:
ENQUIRIES
Enquiries about the figures in this SFR should be addressed to: Jenny Easby
Education Standards Evidence and Dissemination Division Department for Education
Sanctuary Buildings Great Smith Street London SW1P 3BT
Telephone number: 020 7783 8457
E-mail: attainment.statistics@education.gsi.gov.uk
Press enquiries should be made to the Department’s Press Office at: Press Office News Desk
Department for Education Sanctuary Buildings Great Smith Street London SW1P 3BT