0
Chain Effects
The impact of academy chains on low income students
Merryn Hutchings, Becky Francis and Robert De Vries
1
CONTENTS ... 1
FOREWORD ... 3
EXECUTIVE SUMMARY ... 4
RECOMMENDATIONS ... 6
1.
INTRODUCTION ... 7
2.
BACKGROUND ... 8
2.1
What the Government is trying to achieve through the academies programme ... 9
2.2
What the Government is trying to achieve via encouragement of the development of
academy chains ... 10
2.3
Academies and chains: the current picture ... 11
2.4
Aims of the research ... 12
3.1
The academies included in the analysis ... 13
3.
RESEARCH DESIGN ... 13
3.2
The data ... 14
3.3
The survey ... 15
3.4
Limitations... 15
3.5
Structure of the report ... 16
4.
CHAIN CHARACTERISTICS THAT MAY IMPACT ON ATTAINMENT ... 17
5.
OUTCOMES FOR DISADVANTAGED AND UNDER-ATTAINING PUPILS ... 26
5.1
The expected level: five A*-C GCSE or equivalents including English and mathematics ... 28
5.1.1
Disadvantaged pupils reaching the expected level
... 28
5.1.2
Pupils who are NOT disadvantaged reaching the expected level
... 31
5.1.3
The attainment gap between disadvantaged and non-disadvantaged pupils
... 32
5.2
Progress in English and mathematics ... 37
5.3
Average capped point score ... 39
5.3.1
Disadvantaged pupils’ average capped point score
... 39
5.3.2
Non-disadvantaged pupils and the attainment gap using average capped point
score
40
5.4
Average GCSE capped point score ... 40
5.5
EBacc ... 43
5.5.1
Disadvantaged pupils achieving Ebacc
... 43
5.5.2
Non-disadvantaged pupils and the attainment gap using EBacc
... 43
2
5.7
Summary: which chains are the most effective for disadvantaged pupils? ... 47
5.8
Characteristics of chains that are effective for disadvantaged pupils ... 51
5.8.1
Characteristics of effective chains
... 51
5.8.2
Characteristics of ineffective chains
... 52
DISCUSSION ... 53
REFERENCES ... 56
3
When academy schools were first introduced in the UK in 2000, their primary purpose was to turn aroundfailing schools – to ensure that the children these schools served, who were often from disadvantaged backgrounds, got the best education possible.
Since then the academies programme has expanded dramatically and its focus has widened. From around 200 academies in 2010, there are now almost 4,000 – more than two thirds of which are not failing schools, but high performing schools which have chosen to convert to academy status.
However, the original ‘sponsored’ route remains of huge importance. Schools that are failed by Ofsted – both primary and secondary – are expected to acquire a sponsor to provide them with new leadership. Despite comprising less than a third of all academies, these schools are extremely important as a potential engine of social mobility. These previously underperforming schools often educate high proportions of disadvantaged children. The sponsored academy model, if successful, holds the promise of substantially improving the lot of these students.
The central aim of the sponsored academy model is for schools to benefit from the support and expertise of their academy sponsors, who include business leaders, charities, private education companies, and many other types of organisation. Increasingly, and encouraged by the Department for Education, many
academies have banded together into academy chains under the direction of a single sponsor. According to the DfE, more than half of all academies are now part of academy chains, with the largest chains managing upwards of 70 schools.
The success or failure of these chains in driving improvement in their sponsored academies therefore has huge implications for a large number of children. For a disadvantaged child attending a previously failing school, whether their school joins a successful chain or a weaker one could have a dramatic effect on their future chances in life.
This report therefore represents an extremely timely and important in-depth look at the performance of the academy chains. It shows that some chains, including the Harris Federation, ARK Schools, and the City of London Corporation, as well as schools linked to the Mercers Livery Company, are doing particularly well; with attainment scores for disadvantaged pupils substantially above those of the general run of state schools. However, there are other chains which are performing less well than maintained schools on average, and are not doing enough to improve the prospects of their disadvantaged pupils.
Those chains that appear most successful are the ones with the greatest school improvement experience, a clear mission and a sustainable approach to growth. A recent DfE analysis concluded that ‘high
performing sponsors have strong and determined CEOs with a clear moral purpose’. The best chains have used their status effectively to recruit good teachers and leaders. They are clearly fulfilling the original mission of academies. Their students have been given the second chance that they deserve. Other chains, while performing well on the basics, have more work to do to improve results in other academic subjects. But there are also those that could and should do better across the board.
With such a large variation in the success of the various chains, it is vital that Ofsted, in addition to its work with individual schools, is able routinely to assess these groups of schools as a whole. Regular,
transparent, and honest assessment of the performance of the academy chains – which are performing well, which are failing, and why – is essential if we are to prevent the tragedy of children being transferred from a failing school to a failing chain.
I am grateful to Professor Merryn Hutchings and Professor Becky Francis for their work with our research fellow Dr Robert de Vries on this timely and important report.
4
1. The coalition government is pledged to promote the educational achievement of young peoplefrom disadvantaged backgrounds, and to narrow the socio-economic gap for attainment, as part of its strategy for promoting social mobility. One of the ways in which it is attempting to address this issue by encouraging more schools to become academies and arranging for ‘failing’ schools to become sponsored academies.
2. As the academies programme has developed, policymakers have increasingly promoted academy chains as the best method for fostering professionalism, value for money, and school-to school collaboration – and hence the best way of working to improve the performance of previously struggling schools and the educational outcomes of their (often disadvantaged) pupils. However, there has been very little analysis of the success or
otherwise of this policy strategy in positively impacting the attainment of disadvantaged young people.1
3. Our research set out to address this gap. We analysed school performance data to review how well disadvantaged pupils achieve in academy chains. We included chains only if they had at least three academies in 2013, and two sponsored secondary academies for the whole period from September 2010 to July 2013. This means that academies are included in our analysis only when there has been sufficient time for the sponsor chain to have some impact on performance.
4. We reviewed outcomes for disadvantaged pupils in sponsored secondary school academies across a range of measures, including their results in the best 8 GCSE subjects, progress in English and Maths, and the English Baccalaureate, in addition to the main measure of five good GCSE or equivalents including English and mathematics. This is intended to reflect the stronger focus taken by the coalition on academic subjects, and the change in emphasis in the league tables from 2016.
5. The characteristics of the various chains have also been reviewed in order to explore whether there are any common characteristics across the chains that are more or less successful in promoting the attainment of disadvantaged pupils.
6. Our analysis reveals eight key points:
There is very significant variation in outcomes for disadvantaged pupils, both between and within chains; and chains differ significantly in attainment against different measures.
On average, the improvement for disadvantaged pupils in 5A*CEM in sponsored
academies in the analysis group was greater than the average for all mainstream schools between 2011 and 2013. However, there was enormous variation between chains, with only 16 out of 31 exceeding the figure for all mainstream schools in 2013.
Additionally, some sponsor chains are managing to raise attainment significantly for young people with low prior attainment - an important demonstration of value.
There are five chains that are promoting high attainment for disadvantaged pupils – and indeed for pupils of all types - across a whole range of measures.
However, there are also some chains which are highly ineffective across a range of measures, and which are failing to improve the prospects of their disadvantaged pupils.
1
Throughout the report we use disadvantaged to mean those pupils who have been eligible for Free School Meals at any time in the last six years. This is the definition used for the Pupil Premium.
5
Most academy chains in our study have relied heavily on equivalent qualifications, and underperform on the EBacc measure, in comparison to the national average. There are, however, some notable exceptions.
When analysed against a range of Government indicators on attainment, a majority of the chains analysed still underperform the mainstream average on attainment for their disadvantaged pupils. While some of those below the average are continuing to improve, others are not.
The key factors we have identified in the more successful chains are a measured
6
For Policymakers:
Ofsted should be empowered to undertake formal inspections of academy chains, and to make judgements on their provision, based on clear criteria.
The DfE should publish data on chains’ performance, across a range of measures, in addition to that which they publish for individual academies.
The DfE should sharpen and make more transparent its procedures for awarding
sponsorship, including rigorous benchmarks on convincing strategies and capacity for school improvement.
New chains should not be allowed to expand until they have a track record of success in bringing about improvement in their first academies
The DfE should also continue to sharpen and make more transparent its process for issuing warning notices to sponsors, and for capping chains.
Funding agreements for new sponsors should be for five years rather than seven. And the government should not renew funding agreements where improvement has not been demonstrated.
The Government should learn and spread the lessons from successful chains. As the evidence on chains grows, the Government should commission robust research on the practices of those chains that are providing transformational improvement for their disadvantaged pupils, so that lessons of success may be spread throughout the system.
For sponsors and schools:
Sponsor chains – but especially those needing to improve - should seek out successful practice and reflect on what their own chain could learn from it. In particular, they should ensure there are clear lines of responsibility and accountability for school improvement and performance within the chain.
Academies need to do more to ensure that children from low and middle income homes gain good grades in the subjects that will facilitate access to prestigious universities and careers.
There is growing evidence on the most effective strategies for school improvement, including the Sutton Trust/Education Endowment Foundation (EEF) Toolkit, which focuses on effective strategies to improve results for disadvantaged students. Sponsors and schools should make full use of this growing body of evidence to improve pupil outcomes.
The best chains have shown that academies have the potential to transform the lives of young people. But if the academies programme is to achieve its aims, it must learn from effective practice to improve educational outcomes for disadvantaged young people. It must also expect stronger
improvement from those chains that urgently need to improve their results. In these ways, the sponsored academies programme will more effectively realise its intention to transform the educational outcomes of disadvantaged young people.
7
The coalition government is pledged to promote the educational achievement of young people from disadvantaged backgrounds, and to narrow the socio-economic gap for attainment, as part of its strategy for promoting social mobility. One of the ways in which it is attempting to address this issue is by encouraging more schools to become academies and through academy sponsorship of struggling schools.The sponsored academies programme was announced by the New Labour government in 2000, growing in pace during the latter part of the decade, and further accelerated by the Coalition
government since 2010. As the academies programme has developed, policymakers have promoted academy chains (usually Multi Academy Trusts, where a school or other organisation sponsors a group of schools).This arrangement has been seen as best fostering professionalism, value for money and school-to-school collaboration; and hence best working to improve the performance of previously struggling schools, and the educational outcomes of their (often disadvantaged) pupils. However, there has been very little analysis of the success or otherwise of this policy strategy in positively impacting the attainment of disadvantaged young people.2 The research reported here set out to address this gap, asking in particular, ‘Which academy chains have had most success in advancing the outcomes of low income students?’
2
Throughout the report we use disadvantaged to mean those pupils who have been eligible for Free School Meals at any time in the last six years. This is the definition used for the Pupil Premium.
8
Education is key to the Government’s social mobility agenda. The education system is expected to prepare young people with the knowledge and skills they need to secure successful futures as workers and citizens, and to delineate merit through success in exams. Yet the evidence shows that in England, schooling at best replicates and at worst exacerbates existing inequality.
3There are many different social factors shown to impact inequality of experience and outcome in education, including gender, dis/ability, ‘race’ and ethnicity. However, socio-economic background remains the strongest predictor of educational attainment in the English system.4 Children from low socio-economic groups are already behind their more advantaged counterparts when they begin school.5 But far from narrowing this gap, the gap widens through school.6 With the exception of some modest recent narrowing of the gap, educational attainment has increased more rapidly amongst the well-off,7 and educational outcomes remain closely correlated with social class.8
These differentiated outcomes cannot be solely attributed to the education system: family income, job prospects, health, housing, social capital and social culture are all important. But system-level factors are also well documented, including the high levels of social segregation in the UK system,9 with the result that disadvantaged pupils are often concentrated in poorer quality schools.10 Hence those most in need tend to be those least likely to access good educational provision, facing
‘double-disadvantage’.
These problems demand that we:
Ensure that access to the best schools is equally available to all;
Improve poor schools to ensure all provision is of a high standard.
The previous and current governments have sought to address the second point via the establishment of sponsored academies.
3
DfE (2014a, 2014b) 4
Other aspects of inequality intersect with social class; an important point to consider when examining which groups of children are underachieving.
5
Cabinet Office (2011) 6
DfE (2013, 2014a) 7
Lupton et al (2009); Lindley & Machin (2012) 8
Lupton et al (2009); Clifton & Cook (2012) 9
Secretary of State Michael Gove has pledged to transform what he complains is “one of the most segregated and stratified education systems in the world” (Gove, drawing on OECD data, reported in The Telegraph, 2012). 10
As illustrated by work such as that of Lupton (Lupton et al 2009; 2010) and Francis (2011), which demonstrate the over-representation of working class children in poorer quality schools.
2. BACKGROUND
Attainment gaps:
There is a 26 percentage point gap for Free School Meals in the key indicator of 5 A*-C including Maths and English at GCSE.
Only 8% of those eligible for Free School Meals achieved the English Baccalaureate, compared to 25% of all other pupils.
9
2.1 What the Government is trying to achieve through the academies programme
The academies programme was instigated by the last Labour Government in 2000, with the opening of the first ‘City Academies’ in 2002. These academies replaced schools with a history of
underperformance, located in areas of social deprivation. As the Academies Commission summarises of what it refers to as the Academies Programme ‘Mark 1’,
The model and mission were clear: the original and failing school was closed and a new school was opened, sponsored by a philanthropist or business partner, keen to make a difference to the lives of poor children and young people in deprived areas. The ambitious vision and business acumen of the sponsor were seen as key in establishing an ambitious new school, outside any governance by the local authority and in radically transformed buildings with highly paid headteachers. The new academies were considered strategic investments in change. They had start-up funds and freedoms to vary the curriculum, school year, staff pay and conditions of service.11
Arguably, there were other agendas at stake in the early sponsored academies programme: the notion of school autonomy (especially from the local authority) and a faith in the private/business sector to sharpen public sector practice were clearly evident.12 Nevertheless, the commitment to resourcing struggling schools in areas of social deprivation as a means to address social justice was clear.13 This focus on revitalising England’s lowest performing schools was diluted with the Coalition’s drive to turn many of the most successful schools into academies14 through its ‘conversion’
programme. The increased focus on school autonomy arguably trumped the original promotion of social redistribution, as it was now many of the best schools – where more advantaged children tend to be concentrated – that gained as a result of generous funding arrangements and autonomy.15 Nevertheless, the Coalition simultaneously enacted its pledge to maintain and significantly develop the sponsor academy programme; continuing to expect that underperforming schools become academies, and the encouragement of struggling schools to voluntarily join a sponsor.
Outcomes for the sponsored academy programme have been mixed,16 and the impact on pupil achievement remains a topic of controversy and debate;17 although there are emerging positive findings for the early wave of ‘City Academies’.18
There have also been differing findings on the success of sponsored academies in narrowing socio-economic gaps for attainment. The National Audit Office19 found that, although early sponsored academies tended to raise attainment overall, the gap between more disadvantaged pupils and others had grown wider on average in academies than in comparable maintained schools. However, analysis by the DfE20 shows more positive outcomes and a slight narrowing of the gap for pupils on free school meals (FSM), especially in sponsored academies open the longest. Others have expressed concerns about the potential for further social segregation, as academies are their own admissions authorities.21
11
Academies Comission (2013) p.21-22 12
Francis (2013, 2014) 13
Adonis (2012); Mahony and Hextall (2012) 14
Those schools graded by Ofsted as ‘Outstanding’, and later ‘Good’ with Outstanding features. 15
Francis (2010); Academies Commission (2013) 16
NAO (2012) 17
Machin & Vernoit (2010); Machin (2012); Academies Commission, 2013; Wrigley & Kalambuka, (2012) 18
Eyles & Machin (2014) 19
NAO (2012) 20
DfE (2012a) 21
10
2.2 What the Government is trying to achieve via encouragement of the development of
academy chains
Relatively early in the programme it became apparent that ‘stand alone’ academies – those single schools with an individual sponsor – showed mixed success and were more likely to achieve poor outcomes. While there were notable cases of transformative success, such as Mossbourne Academy in Hackney, there were also failures, and there was a risk of isolation impacting detrimentally on practice.22 Such concerns underpinned the policy promotion of academy chains.
The Academies Commission23 identifies three phases of the English academies programme (and asserts the need for a fourth). The Commissioners argue that in the decade following the creation of the first City Academies, during the Labour government’s roll out of these sponsored academies across the country, the original model shifted to Academies Mark II. This model reduced the focus on individual businesspeople and philanthropists as potential sponsors, encouraging substantial
organisations such as universities, charities and even some local authorities to act as sponsors. Sponsor capacity and educational expertise was established as an issue,24 and the potential benefits of sponsor organisations operating as ‘chains’ (with a central organisation sponsoring and applying their model to more than one school) were increasingly identified.25 These organisations, often with substantial existing infrastructure and resources, were seen as bringing expertise and resource to sponsorship, and mitigating some of the risks associated with individual sponsors. Meanwhile, more conditions were specified in academy funding agreements.26
Hill27 asserts the potential benefits of academy chains, but also notes some risks, including lack of a clear mission, introversion and overstretch of capacity. Likewise, there are debates about the role and impact of academy chains on the notion of autonomy at the heart of the academies programme. While chains may instigate innovative practice, their imposition on sponsor schools of a centrally-mandated model can reduce individual school autonomy (the Academies Commission found headteachers in some large chains experiencing the same constraints as they had formerly experienced from the Local Authority). Nevertheless, sponsor chains have been a lynch-pin of Coalition academies policy; first the scale-up of the philanthropic sponsor model facilitated by the DfE’s academy brokers in the early years of the Coalition administration; and later through its encouragement of school-led sponsorship.28 School-led chains are a central feature of the Academies Programme ‘Mark 3’ (since 2010): scaled-up autonomy that seeks to free schools from bureaucracy and unleash a self-improving system via school-to-school collaboration.29
The impact of chains is largely uncharted. While many were actively encouraged to expand rapidly in the early years of the Coalition government, as a result of the enormous increase in numbers of academies, capacity challenges have become evident recently, with 25 academy chains ‘capped’ and prevented from further expansion in 2014.30 This DfE list was subsequently reduced to 14 chains,31 but there have also been well-publicised cases this year of schools being ‘removed’ from chains, due to lack of improvement.32 Nevertheless, Chris Cook’s analysis for the Financial Times in 2013 remains one of the few attempts in the public domain to measure academy chain performance. In spite of the overt intention of the sponsored academies programme to improve educational outcomes for
22
Hill (2010); Academies Commission (2013) 23
Academies Commission (2013) 24
Hill (2010) 25
Hill (2010);Hill et al (2012); O’Shaughnessy (2012). 26
Academies Commission (2013) 27
Hill (2010); Hill et al., (2012) 28
See e.g. DfE (2010) 29
Academies Commission (2013); see also Gilbert (2013) 30
DfE information to the Education Select Committee (2014) 31
Paton (2014) 32
11
disadvantaged young people, there has been little attention to the effectiveness of different chains in raising attainment for disadvantaged pupils.2.3 Academies and chains: the current picture
Academies are publicly funded schools, independent from the local authority. In May 2010, there were 203 academies. There are now almost 4000 (primary, secondary and special schools). The
incentivising of maintained schools to convert to academy status through the offer of autonomy, specific freedoms and a generous funding calculation in the early years of the Coalition
administration33 led to an astonishingly rapid expansion of the programme: 57% of maintained secondary schools in England are now academies or free schools.34 As the Academies Commission35 emphasises, despite policy and media attention focusing on sponsor academies and free schools, the vast majority of academies are now converter academies. In June 2014, the DfE list included almost 4000 academies, of which only 28% (1105 academies) were sponsored. This growth in the number of academies had less impact on the primary sector, although numbers are increasing: 11% of all primary schools are academies.
The Academies Commission36 reported that at the end of 2012 there were 312 academy chains (albeit noting that this figure includes potentially ‘light touch’ ‘collaborative partnerships’); and that 39% of academies were in a chain (28% if ‘collaborative partnerships’ were excluded). However, some of these ‘chains’ were pairs of schools, and the DfE now uses the word chain only for groups of three or more schools. The June 2014 academies list37 includes 192 chains of this sort (that is, groups of academies with a single sponsor). These may be formally linked as multi-academy trusts, but this is not the case for all of these ‘chains’. The chains are extremely varied; the largest has 74 schools (June 2014) but the majority are very much smaller, with half consisting of only three or four schools (Figure 1). A further 139 sponsors have two academies each, and 112 sponsor just a single
academy.
Figure 1: Number of chains by size of chain, 2014
Source: DfE (2014c)
This hints at the complexity involved in any discussion of academies, chains, and other types of schools in the contemporary English system. The level of complexity and fluidity has made it notoriously difficult to analyse the impact of academies (and academy chains) on educational outcomes for young people. For example, there has been a trend for proponents of the academies programme to highlight sponsored academies’ faster-than-average improvement (when of course, this
33
See Bassett et al (2012); Academies Commission (2013) 34
DfE (2014b) 35
Academies Commission (2013) 36
Ibid
37
12
is to be expected given that so many sponsored academies start at a low base);38 whereas opponents cite their lower-than-average attainment (when again, this is to be expected given their low starting points and pupil demographic). Applying measures to schools that have often adopted academy status only very recently, or to chains that have been in very rapid development and contain a mixture of school-types, can lack validity. Nevertheless, it is this terrain that this report attempts to chart. Given the specific intention of the sponsored academies programme to improve the outcomes for disadvantaged young people, and the encouragement of academy chains as a means of best facilitating these outcomes, it is vital to attempt to assess their impact.2.4 Aims of the research
So what has been the impact of sponsored academies on the outcomes for the disadvantaged pupils they were initiated to help? Which academy chains have had most success in advancing the
outcomes of low income students – and how have they achieved this? These are the questions this report seeks to answer.
In doing so, we provide information about the relative impact of different sponsor chains on various facets of pupil progress and attainment, especially for disadvantaged pupils (as indicated primarily by eligibility for Free School Meals). We also attempt to examine what the successful sponsor chains have in common, and what they are doing to achieve their success.
38
13
3.1 The academies included in the analysis
This research is concerned with outcomes for disadvantaged pupils in secondary sponsored academies. We have included as chains all instances where one sponsor is listed for three or more academies (sponsored or converter, following the DfE usage). However, we acknowledge that in some cases these are not organised as chains, and that some schools have multiple sponsors; thus the organisations we include may not all consider themselves to be chains, and may not have primary responsibility for the schools listed against them. This is further discussed in Section 4.
We have analysed the results only of academies that have consistently been part of the chain since September 2010. While this inevitably limits the number of academies and chains included in the analysis, we have done this because the majority of pupils taking GCSEs in 2013 in these academies will have undertaken at least the most recent three years of their secondary education within the chain, and so it seems reasonable to relate their outcomes and progress to the chain. This is the same approach as Cook used in his 2013 analysis of chains’ effectiveness. However, we have not included chains where only one secondary sponsored academy was part of the chain for the whole period since September 2010, because this would result in taking the performance of a single school as representing the chain as a whole. Similarly, we excluded chains where only one academy had pupils taking GCSEs during the period from September 2010.
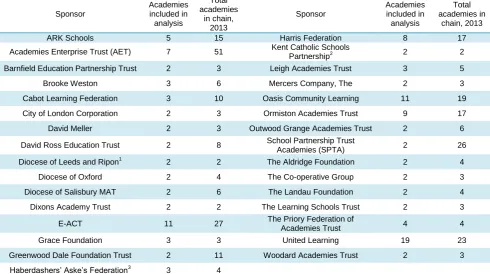
The chains included in the analysis group are listed in Table 1,39 which also shows the number of schools for which we were able to analyse data for the whole period, together with the total number of academies in the chain in 2013 (including convertors, and primary and special schools).40
39
Table 1 uses the chain titles given on the DfE list of academies 2013; throughout the remainder of this report we have shortened these titles by removing words such as ‘Trust’, ‘Federation’, ‘Foundation’, ‘Group’ etc.
40
We have provided the 2013 figure because this matches the end date of the attainment analysis; many chains have grown further since that time. This figure given may still under-represent the total size of some chains, as some include Free Schools, and others, independent schools.
14
Table 1: Chains and numbers of academies included in the analysis
Sponsor Academies included in analysis Total academies in chain, 2013 Sponsor Academies included in analysis Total academies in chain, 2013
ARK Schools 5 15 Harris Federation 8 17
Academies Enterprise Trust (AET) 7 51 Kent Catholic Schools
Partnership2 2 2
Barnfield Education Partnership Trust 2 3 Leigh Academies Trust 3 5
Brooke Weston 3 6 Mercers Company, The 2 3
Cabot Learning Federation 3 10 Oasis Community Learning 11 19
City of London Corporation 2 3 Ormiston Academies Trust 9 17
David Meller 2 3 Outwood Grange Academies Trust 2 6
David Ross Education Trust 2 8 School Partnership Trust
Academies (SPTA) 2 26
Diocese of Leeds and Ripon1 2 2 The Aldridge Foundation 2 4
Diocese of Oxford 2 4 The Co-operative Group 2 3
Diocese of Salisbury MAT 2 6 The Landau Foundation 2 4
Dixons Academy Trust 2 2 The Learning Schools Trust 2 3
E-ACT 11 27 The Priory Federation of
Academies Trust 4 4
Grace Foundation 3 3 United Learning 19 23
Greenwood Dale Foundation Trust 2 11 Woodard Academies Trust 2 3
Haberdashers’ Aske’s Federation3 3 4
1. As a result of diocesan reorganisation, the Diocese of Leeds and Ripon is no longer an academy sponsor, and the
schools they sponsored during the analysis period are now with different sponsors: Leaf Trust and Bradford Diocesan Academies Trust.
2. The schools previously listed by the DfE as Kent Catholic Schools Partnership are identified as sponsored by the
Archdiocese of Southwark on the most recent (June 2014) academies list. On the Kent Catholic Schools Partnership website, the schools in London (which are the ones we were able to analyse) are not included. It is therefore unclear which organisation is the sponsor.
3. The Haberdashers’ Company sponsors a number of academies; while the DfE list identifies them all as
Haberdashers Aske’s Foundation, the Haberdashers’ website makes it clear that this is not the case; one is sponsored by Haberdashers’ Adams Foundation.
3.2 The data
It is important to note that 18 of the 31 chains had only two secondary sponsored academies
throughout the period we are analysing, and this is obviously a limitation. One school having particular difficulties could change the chain’s data substantially. On the other hand if researchers do not
analyse chain performance until a chain has had at least three schools for at least three academic years, very large numbers of pupils would have benefited or been disadvantaged before anyone drew attention to this. Some of the newer chains have already grown substantially yet only two schools have existed long enough to be included in this analysis. We have italicised their names throughout the text of the report and on tables so that readers are clear which they are. On graphs we have the names of the larger chains in capitals to show the distinction.
The data used in this report are mainly derived from the DfE school performance database for schools in England. The figures for chain level performance have been calculated from the relevant attainment measure, such as percentage of students attaining 5A*-C GCSE including English and mathematics (5A*CEM), for each sponsored secondary or all-through academy consistently present in the chain for the three academic years (2010-11, 2011-12, and 2012-13). We have used the average for each academy, weighted by the absolute number of pupils of the relevant type (all pupils, disadvantaged pupils, non-disadvantaged pupils).
15
1) the entire analysis group: sponsored secondary or all-through academies in chains whichhave been consistently in the same chain since September 2010;
2) solo sponsored secondary academies: those not in a chain or pair which were under the same sponsor throughout the period from September 2010, and had attainment data for each year;
3) converter academies: those secondary schools that have consistently been converter academies since January 2011. (Ideally we would have included only converter academies that have had this status throughout the period from Sept 2010, to parallel the selection of sponsored academies, but as this was the first month in which schools could become converter academies, this would have resulted in a very small sample);
4) all London secondary schools: attainment in London is higher than in other regions. In that some academy chains are based entirely in London, their attainment is perhaps more usefully compared to London schools’ attainment rather than that of all mainstream schools;
5) all mainstream secondary schools.
Chain-level characteristics have been collected from published data. These include the composition of the chain (total number and type of schools in 2013); the date the chain acquired its first academy and its subsequent growth; and the characteristics of pupils in the analysis group of academies in the chain (such as percentage of disadvantaged pupils). These are again the average of the figures for each school in the chain. We have also drawn on material published on chain websites.
The main indicator of disadvantage we have used is the DfE definition (pupils who have been eligible for Free School Meals at any time from Year 6 to Year 11).41
3.3 The survey
To supplement the data on chain characteristics, we devised an online survey which was distributed to academy chains. This asked about school improvement strategies; the level of centralisation or school autonomy within the chain, and the extent to which academy freedoms have been used. The response rate was very low, so these data have only been used illustratively rather than as a central part of the analysis.
3.4 Limitations
Research focusing on academy chains is inevitably limited by the ongoing and rapid growth in the number of academies and chains. An analysis of past attainment has to focus on the chains and schools that existed a few years ago. This is necessary so that pupils will have experienced a
sufficient part of their education within the chain, and attainment can fairly be attributed to the work of the academy and the chain (rather than to the predecessor school). While there are now 106 chains with at least three schools including a secondary sponsored academy, there are only 31 that meet these criteria to be part of our analysis group.
This research focuses entirely on secondary sponsored academies. Sponsored academies are deliberately the focus because part of the rationale for creating them was that they would improve the attainment of pupils in deprived areas. We have not included primary sponsored academies simply because few have been in existence long enough. The first primary sponsored academies opened in September 2011, but numbers were very small in the first year, and it is only since 2012 that numbers have increased rapidly. It will be some time before it is possible to identify the long term effect of the chains on primary level attainment.
41
Crawford and Greaves (2013) examined a range of indicators of educational disadvantage, and concluded that the most
effective was eligibility for Free School Meals at any time in the last three years; however, this is not available on the school
16
3.5 Structure of the report
The next section discusses the characteristics of academy chains that may impact on attainment, and the findings of previous research in relation to these. Section 5 analyses the attainment of
17
This section identifies a range of chain characteristics that may impact on attainment, and relates these to previous research and to the chains in the analysis group. When comparing the attainment of pupils in different schools, pupil characteristics have been identified as having a key impact onattainment. As we have observed, these include gender and ethnicity, socio-economic and social class background (as indicated by wealth, level of parental education, and so on), and also birth date within the school year.42
In addition, a pupil’s prior attainment has a considerable impact. DfE figures for 2013 show that 95% of those who had achieved above the expected level in primary school went on to achieve the expected level in secondary school, but this was the case for only 57% of those who achieved the expected level (Level 4) in primary school, and only 7.5% of those who achieved below the expected level. All these pupil characteristic variables interact.
It is important to note, however, that while pupils with certain characteristics tend to attain less well, this is not inevitable. Some schools ‘buck the trend’. A key aspect of the creation of sponsored academies was the assumption that they would ‘break the cycle of disadvantage’.43
The pupil intakes of schools within the analysis group of chains vary considerably. Figure 2 illustrates this for the proportion of disadvantaged pupils, the specific focus of this report. Nationally, 27% of all pupils are defined as ‘disadvantaged’; the figures for the analysis group of chains vary from 23% to almost 70%. However, the DfE analysis of characteristics of high performing sponsors
concluded that there was ‘no evidence that level or diversity of challenge in terms of … pupil intake is relevant’.44
42
For commentary on the impact of some of these factors on pupil attainment, see e.g. Lupton et al (2009); Strand (2014); Education Select Committee (2014b).
43
See Blunkett (2000) 44
DfE (2014e)
18
Figure 2: Mean percentage of Year 11 pupils in schools in analysis group who are
disadvantaged (2013)45
Source: Authors’ analysis based on School Performance Tables
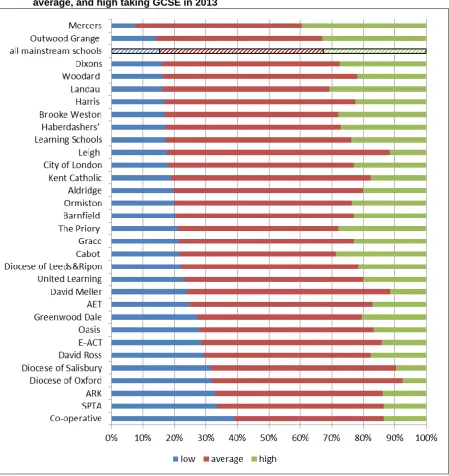
Another important pupil characteristic is prior attainment. The DfE statistics distinguish three groups of pupils; those whose attainment at Key Stage 2 (KS2, normally the end of primary schooling) was average (i.e. they achieved Level 4 in National Curriculum tests); below average (achieved below Level 4) and above average (achieved Level 5). In 2014, the percentages of pupils in each of these groups achieving the expected level at age 16 varied widely:
Low attainers 7.5%
Average attainers 57.6%
High attainers 94.7%46
Figure 3 shows the proportions of low, average and high attainers in each of the chains.
45
The pupil characteristics of chains given in Figure 2 onwards are calculated as the average of the school level proportions given in the DfE School Performance Tables
46
19
Figure 3: Proportions of pupils in each academy chain whose prior attainment was low, average, and high taking GCSE in 2013
Source: Authors’ analysis based on School Performance Tables
We recognise that pupil characteristics are not easily summed up in metrics; there is undoubtedly a difference in outlook and prospects between disadvantaged pupils living in a depressed area where long-term unemployment is endemic and those living in a more affluent area where it is possible to get jobs. The challenges facing schools will differ in each case. Thus we are not suggesting that all disadvantaged pupils, or all those with low prior attainment are the same. But we need to use definitions that enable us to distinguish between groups of pupils; recognising that this may over-simplify reality.
20
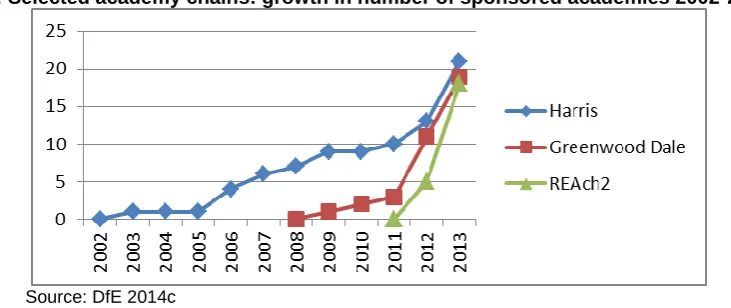
The structural characteristics of a chain (such as its history and composition) may impact on pupil attainment. If sponsored academies are an effective way of raising attainment, one would expect academies that have been in existence for longer to have higher attainment. Thus pupil attainment would be expected to be higher in chains made up of academies that have been open longer. Similarly, one might expect that the long-standing chains would have tried and tested school improvement strategies. These early chains expanded quite slowly in their initial years, and so were able to build up expertise that could be used over a considerable period of time. In contrast, some of the new chains have grown very rapidly, starting with several schools at once so that they have no opportunity to try out strategies on a smaller scale. Figure 4 illustrates the contrasting growth patterns of three chains which had similar numbers of schools by the end of 2013. Harris, which shows the most gradual growth of the three, has in fact developed over an even longer period since its first involvement with a City Technology College created in 1990.Figure 4: Selected academy chains: growth in number of sponsored academies 2002-2013
Source: DfE 2014c
The total number of schools in a chain may also have some impact. It could be argued that a larger chain will have more resources; increased economies of scale; a stronger brand to attract parents; and a greater body of knowledge to apply to turning round new entrants – or alternatively, that a small chain (consisting of three or four schools) will have tighter focus, better communication and less stretched capacity. There may also be an optimum number of schools in a chain: some recent issues have arisen because of concerns that chains were expanding too rapidly.
Structural aspects also include the model and composition of the chain: for example, whether a chain is a multi-academy trust (MAT), an ‘umbrella trust’, or an even looser configuration; and the nature and composition of the trust itself. For example, where some sponsor trusts are created and designed purely to manage the collective of schools concerned, others have grown out of pre-existing organisations, charities and businesses. Sometimes a trust represents the local diocese, or a similar organisation. Many trusts represent a single organisation, but some represent numerous different stakeholders all listed as sponsors, which may impact leadership, direction and accountability. An example is included in our analysis group; the Mercers’ Company did not respond to our survey on the grounds that they do not lead an academy chain. The schools listed on the DfE website as sponsored by the Mercers’ company claim a range of sponsors on their websites:
Madeley academy is sponsored by Thomas Telford School
Sandwell Academy is sponsored by Tarmac plc, the Mercers’ Company, Thomas Telford School, HSBC Education Trust and West Bromwich Albion FC.
Hammersmith Academy is sponsored by the Mercers’ Company and the Information
Technologists’ Company.
21
… many academies – sponsored, converting and those working in collaboration – consider that the definition of a chain being used by the DfE is too broad and makes the term devoid of meaning. Academies working together in loose collaborations do not see or describethemselves as chains, even though they fall within the DfE’s definition. Others that are working in a more structured fashion consider it wrong to equate a multi-academy trust that has an integrated budget and governance framework with a loose collaboration of schools. This is not to make a value judgement about the different types of partnership working: it’s about being clear that different forms of activity each need their own label. (2012: 20)
They argued that it is better to view chains as being along a loose-to-tight spectrum, from the informal collaborative to the ‘pedagogical chain’ typified by integrated governance leadership and resourcing, and the development of a shared pedagogical approach.
While we had a poor response to our survey of chains, the responses we did have illustrated this spectrum. For example, the Diocese of Oxford summarised their strategy for school improvement: ‘Whilst there is a central aspiration in the diocese to achieve certain standards, improvement to academies is delivered on a local level.’ This contrasts with the response from Outwood Grange
which indicates a centrally managed school improvement strategy:
Tried and tested monitoring and intervention systems … Curriculum model that is responsive to all students. Directors of Maths, English, Science etc. work across all schools in the trust and have clear strategies for improvement. Whole day accountability meetings with all Executive Principals, Principals and Directors of subjects held every three weeks with the Chief Executive. Same exam board taught across all academies allow sharing of resources and revision materials e.g. Common 16 week revision course in lead up to first exam. ….
Chains also vary in the nature of the sponsor. Hill et al.47 reported that at the time of their research, the most common form of sponsorship was by successful schools, followed by charitable non-faith based and faith-based organisation, philanthropic individuals, further and higher education
institutions, and corporate sponsors.48 We found it difficult to categorise the sponsors of all the chains in our analysis sample along these lines – partly because of the limited information given on some websites. Some were based around successful schools (Outwood Grange, Leigh, Brooke Weston,
Dixons, The Priory); four were charitable trusts pre-dating academies, and with other activities (Ormiston, ARK, Landau); three were Christian charities (Oasis, Grace, United Learning); four were dioceses; and three were philanthropic individuals with successful businesses (David Ross, David Meller, Harris). While many trusts were created specifically to run academies, and this is their main activity, in other cases, the academies are only a small aspect of the work of the sponsoring organisation (including dioceses, livery companies, the City of London).
The geographical distribution of schools within a chain may also impact on the effectiveness of their school improvement strategies. The DfE’s analysis What does a high performing academy sponsor look like?49 concludes that ‘high performing sponsors plan growth in terms of developing geographical clusters of schools and maximising opportunities for collaboration.’
Hill et al. (2012)50 reported that 22 of the 28 chains responding to their survey identified geographical proximity as important, very important or essential. However, they pointed out that for historical reasons, a number of the long-standing chains had acquired academies scattered across the country; in many cases such chains were aiming to move to a structure of regional clusters.
47
Hill et al. (2012) 48
Largely borne out by the DfE’s Academies Annual Report (2014d), which uses slightly different categories, but again
shows converter academies as the largest sponsor category. 49
DfE (2014e) 50
22
Figure 5 shows the distribution of AET and E-ACT academies; it can be seen that the latter isdeveloping clusters of academies in certain areas; this is highlighted in its 2013-16 Business Plan which sets as an aim the development of regional networks and clusters of academies.
Figure 5: Distribution of AET and E-ACT academies 2014
AET E-ACT
Source: AET and E-ACT websites, June 2014
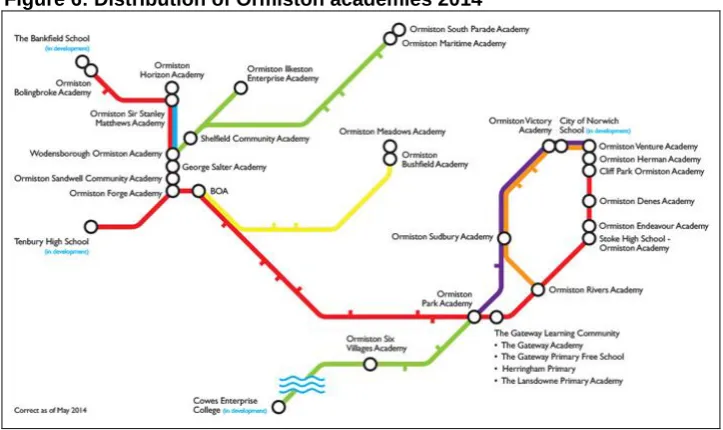
The importance given to creating geographical links is clearly demonstrated on the Ormiston website, which shows their academies in the style of train map (Figure 6), perhaps deflecting attention from the wide geographical spread (including schools in Grimsby, Runcorn, Norwich, the Isle of Wight), and emphasising the close links.
Figure 6: Distribution of Ormiston academies 2014
Source: Ormiston website 2014
[image:23.595.117.479.417.632.2]23
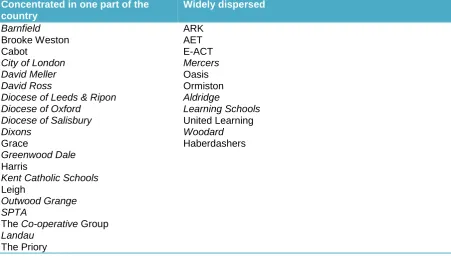
Table 2: Geographical distribution of academies within each chain
Concentrated in one part of the country
Widely dispersed
Barnfield ARK
Brooke Weston AET
Cabot E-ACT
City of London Mercers
David Meller Oasis
David Ross Ormiston
Diocese of Leeds & Ripon Aldridge
Diocese of Oxford Learning Schools Diocese of Salisbury United Learning
Dixons Woodard
Grace Haberdashers
Greenwood Dale
Harris
Kent Catholic Schools
Leigh
Outwood Grange SPTA
The Co-operative Group
Landau
The Priory
Nationally, schools in London out-perform schools in other regions by some considerable margin. Thus one might expect that academy chains located in London would similarly outperform chains in other parts of the country. Harris and City of London are both based in London. Clearly it could be argued that the fact that the early academies were mainly in London is one of the many factors contributing to London’s success, but it is generally agreed that this is not the most important factor.51 Local Authority schools in London are also well above the national average in terms of attainment.
The characteristics of the schools in each chain prior to their becoming academies are also worth noting. Some of the earlier sponsored academies were not ‘failing’ but successful schools. Some were City Technology Colleges and formed the school improvement base of several academy chains including Harris, Cabot, Leigh and Dixons. A small number of sponsored academies were formerly independent schools (such as Bristol Cathedral Choir School). Hill et al. (2012)52 excluded such schools from their analysis of academy attainment data. We have not done so because our interest is in the achievement of the chain in terms of pupil attainment regardless of the schools’ histories.53 Some academy chains created entirely new schools rather than taking on ‘failing’ schools, and so did not have the same challenges of changing ethos and poor practices. For example, two out of three of the Mercers’ Company’s sponsored academies were created as new schools. Of the larger
chains, ARK has the highest proportion of newly created schools (five of its 20 schools, including a third of the sponsored academies taking secondary aged pupils). However, DfE analysis (2014e)54 of characteristics of high performing sponsors concluded that there is ‘no evidence that level or diversity of challenge in terms of historic attainment … is relevant’ to whether a chain performs well.
51
See Hutchings et al (2012), Hutchings and Mansaray (2013), Cook (2013b), CfBT/Centre for London (2014), Greaves et al. (2014).
52
Hill et al. (2012) 53
We have reviewed the data to see how much difference including these schools made. In some chains the difference was negligible, because the former CTC performed only slightly better than the other academies, or because in averaging out data across schools, the CTC had little effect. In only one chain was the data skewed by the high-performing school; however, as this chain’s overall performance was below average, it does not affect our findings about which are the most effective chains.
54
24
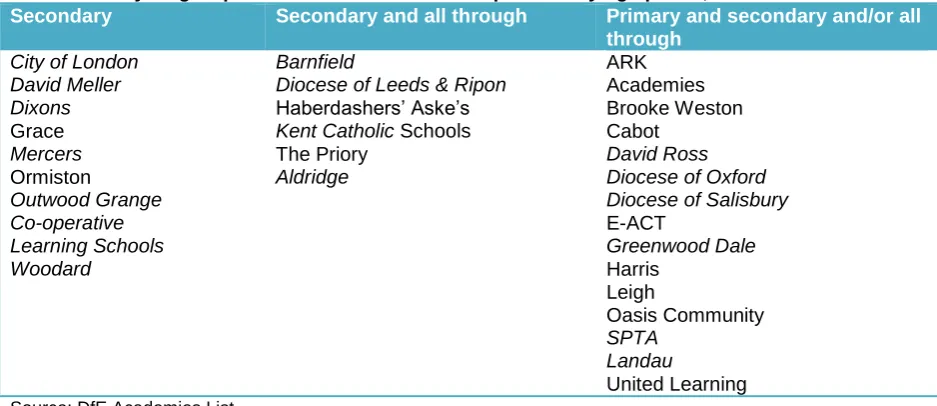
Another chain characteristic that might impact on effectiveness in school improvement is the mix of schools within a chain. All the early sponsored academies were for secondary aged pupils. But now there now more primary sponsored academies than secondary. Some chains, such as REAch2, with 29 academies (June 2014), specialise entirely in the primary sector. Some small chains (such as The [image:25.595.67.536.185.388.2]Aldridge Foundation and the Grace Foundation) have only secondary or all-through academies. But the majority of chains include both primary and secondary schools, and some also have special schools.
Table 3: Analysis group chain characteristics: composition by age phase, 2013
Secondary Secondary and all through Primary and secondary and/or all
through
City of London Barnfield ARK
David Meller Diocese of Leeds & Ripon Academies
Dixons Haberdashers’ Aske’s Brooke Weston
Grace Kent Catholic Schools Cabot
Mercers The Priory David Ross
Ormiston Aldridge Diocese of Oxford
Outwood Grange Diocese of Salisbury
Co-operative E-ACT
Learning Schools Greenwood Dale
Woodard Harris
Leigh
Oasis Community
SPTA Landau
United Learning Source: DfE Academies List
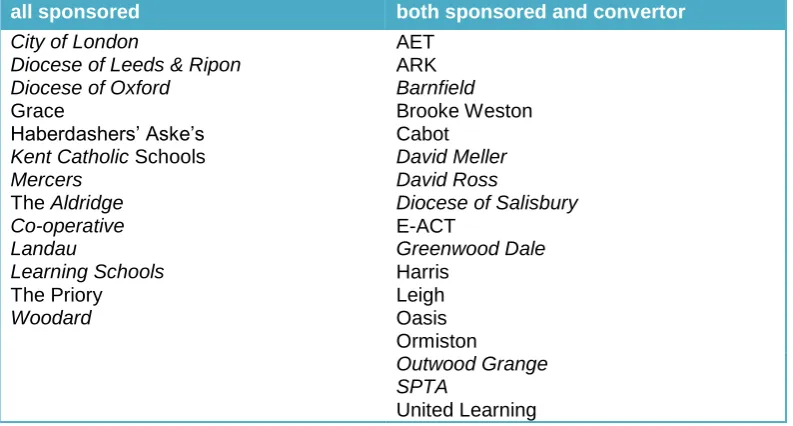
Chains also vary in whether they include both sponsored and converter academies; some additionally include free schools. In 2012, Hill et al. referred to ‘sponsored academy chains’ and ‘converter academy chains’ as two different types of chains (while acknowledging that some chains were becoming more mixed). But in 2014, a third of converter academies are listed as having a sponsor, and they form a significant part of many chains (in addition to those instances where they are themselves the sponsor). Some chains deliberately include a mix of academy types as part of their improvement strategy, using converters to work with struggling schools within the chain.55 The DfE analysis56 concludes that high performing chains are more likely to have a blend of sponsor and converter projects, and states that those with more than 90% sponsored schools do not do as well. Table 4 shows that 13 of our analysis group of chains were made up entirely of sponsored academies between 2010 and 2013 and a further three (E-ACT, Greenwood Dale and Ormiston) had more than 90% sponsored academies.
55
See e.g. RSA Academies:
http://www.thersa.org/action-research-centre/learning,-cognition-and-creativity/education/family-of-academies/4.-rsa-academies-what-the-family-does-together; their arrangements highlighted in their questionnaire response.
56
25
Table 4: Analysis group chain characteristics 2013: mix of sponsored and converter academies
all sponsored both sponsored and convertor
City of London AET
Diocese of Leeds & Ripon ARK
Diocese of Oxford Barnfield
Grace Brooke Weston
Haberdashers’ Aske’s Cabot
Kent Catholic Schools David Meller
Mercers David Ross
The Aldridge Diocese of Salisbury
Co-operative E-ACT
Landau Greenwood Dale
Learning Schools Harris
The Priory Leigh
Woodard Oasis
Ormiston
Outwood Grange SPTA
United Learning
Some chains also include independent schools. Jon Coles, Group Chief Executive of United Learning, argues that this is beneficial for schools in both sectors; independent schools can learn from
academies as well as vice versa (see UL website). Many also now include free schools, identifying this as a key way to expand the chain.
As well as these structural factors, it is clear that the quality of leadership of a chain, and the strategies that are used for staff development and school improvement, are likely to have a strong impact on the effectiveness of the chain. The DfE analysis57 concludes that ‘high-performing sponsors have strong and determined CEOs with a clear moral purpose that is well transmitted to all staff.’ It identifies a range of other working practices linked to high performance, such as provision of cross-school teaching and professional development. We explore some of these ideas in relation to our analysis of more successful chains later in the report.
In academy chains, the extent of individual school autonomy and central direction varies.58 Hill et al. identified three core dimensions:
shared vision (ethos, values, aspiration and ambitions)
shared systems (uniforms, behaviour and discipline, target setting and data tracking, performance management)
shared principles and models (curriculum design, teaching and learning, what an outstanding lesson looks like, intervention strategies).
They argue that ‘in a chain that is functioning well and likely to achieve its educational potential all three of these dimensions would be evident and in balance’, but add they were not suggesting that these factors should all be centrally determined ; there could also be space for local innovation to contribute to the chain’s learning. The DfE notes that high performing sponsors usually have strong partnership with schools in the wider system.’
There is, then, considerable variety in the characteristics of chains that include secondary sponsored academies, and some emerging data about what type of chain is the most effective. We aim to contribute to this.
57
DfE (2014e) 58
26
Disadvantaged pupils include all those who were ever eligible for Free School Meals between Year 6 and Year 11, and looked after children.59 This is a substantially larger group than the alternative measure (eligibility for Free School Meals). It is also the group that is eligible for the Government’s pupil premium. Whereas some 15% of those taking GCSEs in 2013 were eligible for Free School Meals, 27% were disadvantaged. However, the attainment gaps relating to each of these groups are similar in size (Table 5).Table 5: Attainment at GCSE for FSM and disadvantaged pupils, 2013
No of eligible pupils 5+ A*-C grades inc. English & mathematics GCSEs Free School Meals (FSM)
FSM 85,182 37.9
all other pupils 486,152 64.6
Attainment gap 26.7
Disadvantaged Pupils
disadvantaged pupils 154,087 40.9
all other pupils 317,247 67.8
Attainment gap 26.9
Source: DfE 2014a
We review the attainment of disadvantaged pupils on four key measures: attaining 5+ A*-C grades including English and mathematics (5A*CEM); pupil progress in mathematics and English; average (capped) point score (with and without equivalents); and the English Baccalaureate (EBacc). For the last few years, the most important of these measures has been 5A*CEM. Schools which do not reach the floor standard60 set by the government for this measure risk being turned into sponsored
academies, or moved to a different sponsor.
The measure of pupil progress in English and mathematics was published for the first time in 2009. From Key Stage 2 (age 11) to Key Stage 4 (age 16) pupils are expected to make three levels of progress. Thus a pupil who achieved Level 4 (the expected Level) at age 11 would be expected to gain a C grade in GCSE. But a pupil who achieved Level 5 at age 11 would be expected to achieve a B at GCSE, while one who was below Level 4 would have made the expected amount of progress if they achieved a GCSE grade below a C. This measure clearly helps school with low-attaining intakes to demonstrate that they are adding value for their pupils. Thus it may be of particular importance for some sponsored academies.
Attainment based on the other measures (average point score and EBacc) has also been reported, but has had less significance. Average (capped) point score is calculated from the best 8 GCSE or equivalent results a pupil achieves, and therefore encourages schools to ensure that all pupils take eight subjects. The EBacc, introduced in 2010, involves achieving A*-C passes in English, maths, two science subjects, a modern or ancient language and history or geography. Its aim was to create an incentive for schools to offer these subjects, in order to give students ‘a properly rounded
academic education’. Part of the concern was that too many pupils – especially those from
disadvantaged backgrounds - were taking ‘non-academic’ or non-traditional subjects, which would not
59
DfE (2014a) 60
In 2013, a school was below the floor standard if less than 40% of pupils achieve 5+A*-C including English and
mathematics and the expected progress between key stage 2 and key stage 4 is less than the median of 73% in English and less than the median of 73% in mathematics (DfE, 2014b).
27
facilitate access to the most prestigious higher education institutions and/or professions. Hence one of the aims of the EBacc measure is to incentivise practices that support social mobility.61 It was unclear when this measure was introduced how much importance was to be accorded to it, and the extent to which schools have changed their curriculum in response has varied.However, the government has announced that from 2016, a new performance indicator, Progress 8, will be used.
The Progress 8 measure is designed to encourage schools to offer a broad and balanced curriculum at KS4, and reward schools for the teaching of all their pupils. The new measure will be based on students’ progress measured across eight subjects: English; mathematics; three other English Baccalaureate (EBacc) subjects (sciences, computer science, geography, history and languages); and three further subjects, which can be from the range of EBacc subjects, or can be any other approved, high-value arts, academic, or vocational qualification. From 2016, the floor standard will be based on schools’ results on the Progress 8 measure. (DfE, 2014f)
This measure will replace 5A*CEM. Along with performance in English and Maths, it will become the main attainment measure used to assess schools’ performance.62
This new measure was announced in October 2013, and so will have had no impact on the curriculum offered to the pupils who took their GCSEs in that year. However, those schools that changed their curriculum in line with EBacc will already be moving in that direction.
Therefore, while our main focus in this report is on 5A*CEM (the expected level), we also briefly examine attainment figures using both average capped point score and EBacc, to see which academy chains appear to be well positioned to move towards Progress 8.
In this section, we also analyse data relating to pupils whose attainment at primary schools was below the expected level (Level 4). Such pupils are disproportionately from disadvantaged groups.
Nationally, only 7.5% of this group achieve 5A*CEM. We review how successful the analysis group of academy chains have been in producing better outcomes for these pupils. Like the progress measure discussed above, this measure could be useful for sponsored academies with low attaining intakes to demonstrate their effectiveness.
61
See e.g. Michael Gove (2013) 62
28
5.1 The expected level: five A*-C GCSE or equivalents including English and mathematics
5.1.1 Disadvantaged pupils reaching the expected level
Figure 7 shows the mean school percentage of disadvantaged pupils achieving the expected level (5 A*CEM) in 2011 and 2013 in all mainstream schools and in the group of sponsored academies in chains included in this research (the analysis group). While the 2011 figure for the analysis group was lower than for all mainstream schools, by 2013, the academies showed a greater improvement (improving by 7.3% compared with 4.2% for all maintained schools). Solo academies on average had lower attainment for disadvantaged pupils in 2011 and 2013. This pattern of chains of three or more academies doing better than solo academies occurs throughout our analysis and fits with previous findings.63 Converter academies had a higher proportion than sponsored academies of disadvantaged pupils achieving the expected level in 2011, but showed no improvement by 2013.
Figure 7 also includes the equivalent figures for all London schools, where a higher percentage of disadvantaged pupils achieved the expected levels in each year. This indicates the potential for other schools and academies to improve.
Figure 7: Percentage of disadvantaged pupils achieving the expected level (5A*CEM), 2011 and 2013
Source: Authors’ analysis based on School Performance Tables64
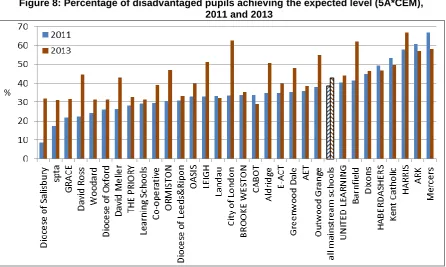
Figure 8 shows the mean percentage of disadvantaged pupils reaching the expected level in each of the chains in the analysis group. In 2011, there was considerable variation across chains. This may relate to the previous history of the schools in the chain, how long they had been academies, attainment in their predecessor schools, or other factors. But the extent to which this figure had increased or decreased by 2013 clearly reflects the effectiveness of the strategies of the chain and the schools that make up the chain in bringing about improvement in the outcomes for disadvantaged pupils.
63
Hill et al, 2012 reported that on average, chains of three or more academies made greater progress between 2008-9 and 2010-11 than ‘standalone’ and ‘two-strong’ academies.
64
29
Figure 8: Percentage of disadvantaged pupils achieving the expected level (5A*CEM), 2011 and 2013
Note: on this and subsequent graphs, those chains shown in capital letters have three or more schools included in the analysis, while those in lower case have only two.
It would be expected that those with the lowest initial attainment would show the greatest improvement, because it is clearly easier to improve from a low baseline, and this is the pattern normally found: on average, low attaining schools always show greater improvement than high attaining schools. This is illustrated in Figure 9. All mainstream schools have been divided into five groups (quintiles) on the basis of the 2011 percentage of disadvantaged pupils achieving 5A*CEM. Figure 8 shows the mean 2011 and 2013 attainment for the schools in each quintile, together with the mean improvement made. While the lowest quintile improved by 13%, the highest achieving quintile of schools in 2011 actually had, on average, results from their disadvantaged pupils that were 6% lower in 2013.
Figure 9: Percentage of disadvantaged pupils in all mainstream schools achieving 5A*CEM, 2011 and 2013, by 2011 quintile
30
this is 10 percentage points more than all mainstream schools in this quintile improved over the same period. On the other hand, academies run by another chain had the same initial mean attainment, but improved by less than ten percentage points – less than the mean for all school in the quintile.Chains that improved less than all
mainstream schools in the same quintile
Chains that improved more than all mainstream schools in the same quintile Grace
Woodard
Diocese of Oxford
The Priory
Learning Schools
Diocese of Leeds &Ripon
Landau
Brooke Weston Cabot
Diocese of Salisbury David Ross
David Meller
Ormiston Leigh
City of London
Aldridge
Greenwood Dale Outwood Grange Barnfield
Harris
Some chains stand out: City of London improved more than any other chain, improving from half way up the rankings in 2011 to second place in 2013.
The chains with the highest proportion of disadvantaged pupils reaching the expected level in 2013 were:
Harris
City of London
Barnfield
Mercers
ARK
Outwood Grange
Previous research about sponsored academies has drawn attention to the extent to which some have relied on alternative ‘equivalent’ qualifications, rather than GCSEs, to boost attainment figures.65
It is clearly important that some vocationally oriented courses are included in the curriculum, and that these may serve to engage less academic pupils. However, it is a concern if pupils are encouraged to take such subjects to enhance their school’s position on the league tables, rather than to benefit the pupils themselves.66 Moreover, the government has expressed concern about the extent to which equivalents are taken, and for the 2014 league tables has vastly reduced the number of equivalent qualifications that will count, leaving only those that demonstrate rigour and have a track records of taking young people into good jobs and higher education.67 Both the EBacc and Progress 8 have a strong focus on G