The Tropical Data Hub
A Virtual Research Environment for Tropical Science Knowledge and
Discovery
Trina Myersa,b, Jarrod Trevathanb and Ian Atkinsonb
a James Cook University, School of Business (IT), Townsville, Queensland,4813, Australia. b James Cook University, e-Research Centre, Townsville, Queensland,4813, Australia.
Tropical regions support some of the world’s most diverse and unique ecosystems. However, these sensitive areas are under increasing pressures that significantly threaten their future sustainability. To help better manage tropical regions, a need exists for more informed environmental monitoring procedures. Currently, data is collected in disjoint repositories that are not visible or accessible for reuse. As data is not being publicized, there are missed opportunities for the holistic discovery of trends that influence tropical ecosystems. This paper presents the Tropical Data Hub as an e-research infrastructure to congregate significant tropical data sets for cross-domain analyses and knowledge discovery. The Hub serves as a focal point for the amalgamation of disparate data sources to facilitate data reuse, integration, searching, and correlation by environmental researchers and government departments for discovery and decision making. More suitable environmental management practices may then be devised via cross-disciplinary data that depicts a more accurate representation of the status. The system automates the data capture process and incorporates semantic technologies to provide knowledge discovery. We present two successful visualisation applications that demonstrate the Hub’s capacity to enhance tropical environmental research. The first assesses land space use, and the second assesses potential impacts of climate change on global biodiversity.
KEYWORDS
:
Virtual Research Environments, Environmental Monitoring, Semantic Technologies,
Tropical Biodiversity, Knowledge Discovery
1. Introduction
The tropical world is an important but often neglected region. A high proportion of the world’s biodiversity is located in the tropics, including up to 80% of animal and plant species and 92% of the world’s coral reefs [1]. Population growth and urbanization have led to the loss of biodiversity on a massive scale in many tropical countries – a process exacerbated by climate change. High population density and growth rates are similarly linked to poor health outcomes and to the emergence of new infectious diseases [2]. There are massive amounts of environmental data generated through experimentation, monitoring and related tropical research. However, scientists have difficultly collating, storing, managing and analyzing this data. Therefore, a need exists for more informed use of environmental monitoring procedures to help better manage tropical regions.
At present, scientists keep data in a series of disparate sources. For example, in a typical institution (such as a university), there exist several levels of, or approaches to data storage. One person might have a series of spreadsheets, whereas another uses flat files stored on an external hard drive. A group may make use of high performance computing resources, and yet others might have a single-user standalone database. However, the problems with these strategies are that:
Data is difficult to share and integrate due to differing data formats and standards;
Business rules are not stringently enforced with limited quality checks;
There is no means to publicly verify the data and the results of experimentation; and
accurate holistic picture of the state of tropical regions and allow for more suitable environmental management practices. The proposed system automates the data capture process through integration with sensor web sources and incorporates semantic technologies to provide knowledge discovery.
We present two visualization tools that model data from the TDH. Each tool serves as a proof of concept for its ability to alleviate the issues with tropical data analysis. The first models sustainable land space across Northern Australia. This application assesses and predicts bird migration patterns in correlation with changes in the hydrological changes in regional catchments. The second is a system to rapidly assess the potential impacts of climate change on global biodiversity. This tool is based on the modeling proposed by the Wallace Initiative which is a mechanism to project the various influential factors that contribute to climate change [3].
This paper is organized as follows: Section 2 provides a brief summary of the components and benefits of a
Virtual Research Environment (VRE). Section 3 describes the tropical research domain and the TDH as an eco-informatics platform to enable tropical science and discovery. Section 4 gives an example of how the TDH can be used as a portal for the visualization and assessment of significant land use and species distribution data in Northern Australia. Section 5 gives an overview of the Wallace Initiative climate change modeling web site. Section 6 provides some concluding remarks.
2. Background - e-Research knowledge systems
To better inform research enquiries on sustainability, more extensive data access is required. Access to the correct data for a line of enquiry is often hindered or deferred by the lack of knowledge of the existence of that data. Data is often collected and not publicized.
The e-Research community is working to develop new methods that offer solutions to the changing requirements of the modern researcher and/or scientist. e-Research is the amalgamation of research techniques, data and people with new and existing technologies to form synergies that improve research methodologies and/or enable new research processes.
Scientific progress increasingly depends on the sharing of resources, ideas, know-how and results [4-6]. Connections between disconnected ideas, domains, people and data can contribute to the creation of new knowledge, and subsequently, its reuse can be instrumental in the development of further knowledge [7,8]. The changing needs of modern researchers include, but are not limited to:
The capability to process large quantities of data from diverse origins and formats;
The facilities to share both tangible and intangible resources;
The facilities to maintain collaborative, dynamic environments;
The ability to simplify data integration and analysis; and
The provision of scalable, flexible automation of the processes [9].
Knowledge systems such as the one described here, is a VRE to assist in fulfilling these five researchers’ needs. The ARCHER project [10] in Australia and the myExperiment project [11] in the UK are examples of VREs. These projects apply current and emerging technologies to promote communication, academic discussion and sharing, and ultimate reuse, of data and information. The tools, technologies and resources available to researchers, via these facilities, include support, access and management of large datasets, enriched with metadata, from distributed repositories. Among other concepts, VREs offer:
Collaborative functionality for sharing documents, publications and data;
Methods for data integration and Knowledge Representation (KR);
Scientific workflows; and
Methods for data visualization derived from the data analysis processes.
2.1. Collaborative research environments and workflows
A VRE is required to support simplicity while simultaneously streamlining the working research environment. The research process includes all facets employed in the research methods or the scientific experiment. Specifically, the initial documentation of the theory or hypothesis to the physical undertaking and through to the final publication of results [9].
A VRE facilitates the sharing of digital/electronic resources in a structured, orderly and secure fashion. These resources include data, digital files, visualizations, publications, computational power and storage, among others, and are transparently combined with all aspects of the workflows in a collaborative working and research environment.
sensor data, satellite images, simulation output, observational data, etc [12]. In many domains experiments are now digitized and performed predominantly in silico, such as simulations, visualizations, data mining and analyses. In silico experimentation conducted and controlled through scientific workflows is now common practice.
2.2. Data integration
The rapid increase in data collection and production is changing data management and processing requirements. To converge or reuse data from different platforms and formats for data synthesis and analysis is imperative to modern research. However, technological developments in data integration and management are not keeping up as the data continues to increase even as the hardware and networking resources that make up the underlying infrastructure perpetually improve [9].
Recent research efforts by the Semantic Web and KR domains focus on the development of automated data synthesis technologies. A key component in these solutions is semantic technologies which involves methods to add contextual information to data through ontologies.
Ontologies are descriptions to represent abstract or specific concepts, such as, intentions, beliefs, objects and feelings. These descriptions contain explicit specifications, terms and relationships with formal definitions, axioms and restrictions that constrain the interpretation to create, share and re-use “computer-understandable” knowledge. Once raw data and information is “understandable” to a computer, logic systems based on inference rules and description logics can be applied to reach conclusions, disclose data anomalies and/or make automated intelligent decisions [13].
2.3. Data visualization
Scientific data visualization is the transformation, selection or representation of data from simulations or experiments used to explore, analyze and understand the data. There are several different techniques to visualize scientific data, with iso-surface reconstruction and direct volume rendering being the more common.
Data visualization is usually done with specialized software to create interactive, animated, abstract or model-based visual media. The abstract visualizations show completely conceptual constructs in 2 or 3 dimensions. The model-based visualizations either make digital compositions of real objects from scientific data or place overlays of data on real or digitally formed images of reality.
3. The Tropical Data Hub
TDH has a unique mix of knowledge discovery functionality in development. The knowledge system is being designed to improve communication with semantic technologies (e.g., linking different terminologies) to bridge disparate data stored across various repositories. Some of the main aims for semantic technologies is to extend the interoperability of databases, integration of data, the provision of new tools for interacting with multimedia and to allow for people and machines to work together interactively [4]. The TDH offers a horizontal cross connect over a flexible range of “vertical” domains for data sharing, synthesis and analysis in a collaborative open environment. The accessibility is made possible via a public web site that allows visitors to search, browse and interact with tropical region-specific data. Here information is generated via data gathering efforts, models and data synthesis methods such as statistical and visualization tools.
The data synthesis outcomes facilitated by the TDH knowledge-base are varied. Interactive maps, charts and reports and direct access to raw data formats and metadata, are made possible via a GeoNetwork portal. The linked data format for all data accessible via the TDH make possible a higher granularity of intelligent search mechanisms. Specifically, semantic correlation and inference capability [14].
3.1. The tropical research domain
There is increasing acknowledgement of the practical role that science, technology, information and innovation can play in the exploration of environmental sustainability, impacts of climate change, industry and infrastructure, health and bio-security.
Minimizing the impacts of climate change on biodiversity will require informed prioritization of adaptation options based on an understanding of biodiversity patterns and processes and the relative vulnerability of species, ecosystems, and processes. Understanding biodiversity requires detailed information on the factors that determine the distribution of each constituent species.
[image:4.612.142.483.66.324.2]One of the most fundamental pieces of information in ecology and conservation biology is knowledge of which species occur in what places. Although conceptually simple, understanding species’ distributions is a complex undertaking that may be the single most important fact underpinning all ecological research and applications in conservation biology [15, 16]. To make informed decisions about conservation management is impossible without some knowledge on distributions. The comprehensive data available describing the biodiversity of the Wet Tropics bioregion makes the TDH knowledge system an ideal case study for many macro-ecological, evolutionary, and climate change questions [15].
The simplest definition of climate change adaptation is a reduction in the vulnerability to climate variability and change. Knowledge on the impacts of climate change is the first step. However, to understand how and why the climate itself is changing is of high importance because it drives climate change effects [17].
Adaptation strategies are difficult to design without knowledge on the degree of vulnerability. The TDH web portals are designed to provide information to practitioners, decision makers and the public to allow them to assess how they are vulnerable to some sectors. Knowing this now allows them to develop strategies to reduce their vulnerability to climate change.
3.2. The TDH architecture
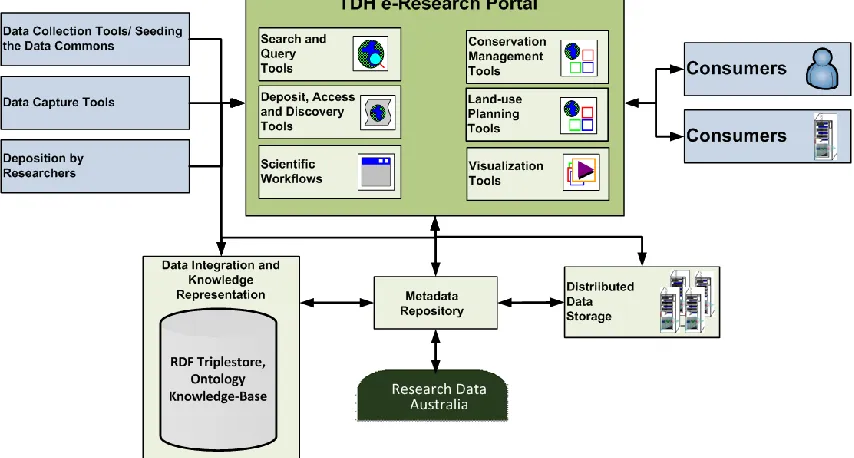
The TDH is intended to complement existing data repositories and stores, and be a banner under which research interests in the tropical world can be concentrated. The hub provides a data hosting infrastructure to congregate key national and international data sets, but significantly, also be a portal through to other primary data sources (Figure 2). Notably, a key function of the portal is the amalgamation of disparate data exposed for the purpose of harvesting metadata, thereby facilitating search across all data sources. Interested parties such as international, Australian state, and university research programs and/or management groups will then benefit from the synthesis of cross-discipline data, information and knowledge available via the TDH.
The TDH architecture includes functionality that enables research endeavors. Functions such as: the integration of disparate data sources from locally stored sources, real-time sensor sources and web available sources; a
Geographical Information System (GIS) facility; visualization capabilities for geospatial and graphical data collections; a VRE to enable or improve the working environment of the researcher by facilitating collaborations and the sharing of knowledge; data analysis and synthesis capabilities; and aggregated data products and services.
The TDH incorporates enabling technologies, methods and functionality in a VRE for tropical research. The goal is to assist researchers in the tropical sciences to more effectively collaborate, manage data and information, integrate data for knowledge discovery and align with current data publication programs. The TDH is a platform to serve data sets related to tropical research from a single virtual location that will enable researchers, managers and decision-makers to collaborate around the data.
Workflows are employed to automatically process raw data and/or web available data via a series of workflow steps, and pass the results to and from the TDH portal. Specifically, the workflows collects both locally and externally stored data from existing data archives and repositories by enlisting Web services.
[image:5.612.89.516.31.260.2]To deploy e-Research experiments and to support endeavors, such as the TDH VRE, a sound, reliable, extensible hardware infrastructure is in place. More specifically, the infrastructure entails high bandwidth communications for data throughput, High Performance Computing (HPC) and the support and tools to automate integration, management, visualization and analysis of the data [12].
4. The development of the TDH infrastructure
The development of the TDH is an evolutionary process due to its overall extensive scope. To support the scalable vision of the VRE it is being built in phases each consisting of separate projects. Currently there are a number of projects in completion or in progress that address requirements for:
The main portal and backend infrastructure;
Data analysis tools; and
Tools to support data and metadata advertisement and discovery (Figure 2).
4.1. The TDH portal and VRE tools
The TDH portal project created an aggregator that forms part of the TDH to provide pointers to collections and tools to explore and exploit tropical data. The portal provides a comprehensive view on data used and produced by researchers with facilities to register, identify, curate, deposit and access tropical data.
The datasets are to be published through searchable data/metadata repositories to ensure maximum exposure of the data to end-users. Specifically, the Australian National Data Service (ANDS) to make available in Research Data Australia (RDA), the TDH portal and the National Climate Change Adaptation Research Facility and Terrestrial Biodiversitynetwork (NCCARF TB).
The TDH requires data analysis tools that will expose data for correlation, querying and visualization across different domains of research. The VRE services in development serve data sets from a single virtual location and include data-integration, visualization and analytical tools to enable researchers, managers and decision-makers to collaborate around the data.
These tools and the comprehensive data available in the TDH will assist in decision-making for many ecological, bio-geographic, evolutionary, and climate change questions. The data can be analyzed and used in diverse applications such as:
Mapping areas for building and structures in the construction industry;
The generation of digital terrain maps for use in geographic information systems;
The generation of digital vegetation maps for use in the forestry and land management industries;
Informing management in diverse industries, from construction to mining to forestry; and
Providing valuable information about vegetation in native and plantation forests.
Currently, two exemplars of the analysis tools for data integration and visualization are described in sections 4 and 5.
4.2. The data capture projects
The support for data and metadata advertisement and discovery is the purpose of two complimentary projects. The first project aims to “seed the commons” and the second focuses on data capture and description software. The “seeding the commons” project identifies and creates collection descriptions for a wide range of existing datasets including:
Queensland Government data, such as light detection and ranging datasets;
Data from the Reef and Rainforest Research Centre;
Data from the Centre for Tropical Biodiversity and Climate Change (CTBCC);
The Australian Centre for Tropical Freshwater Research (ACTFR) data; and
Other significant data collections to be identified, described and managed at James Cook University (JCU). These collections are made available to researchers via the JCU TDH and will be harvestable via the ANDS's RDA.
The second data description and discovery project aims to capture data and metadata from new and existing data sources. Initially, this project will develop software to capture and create collection descriptions for a wide range of data sets.
Importantly, the data capture project will collect new datasets from real-time sensor data from next generation wireless sensor networks. These systems are deployed in both terrestrial and marine environments. Data is captured and described at the point of acquisition. Collected data is relayed back to the end-user via the Internet, and/or is stored in the cloud for multi-party access and reuse.
Initially, real time data being produced at the DRO and via Smart Environmental Measurements and Analysis Technologies (SEMAT) will be the focus use-cases. DRO is one of the best-known natural terrestrial laboratories in the world for research on the impacts of global environmental change. Current developments include the deployment of an advanced sensor network to collect real-time environmental data. This intelligent wireless sensor network was produced by the SEMAT project and was designed to collect data in harsh marine environment locations [18]. SEMAT provides software tools that allow data to be streamed in near real-time from sensors. The data is buffered and on collection converted into a format recognizable by standards bodies (i.e., Sensor Web Enablement [19]) and therefore can be imported into the sophisticated data modeling and visualization tools developed by the TDH.
4.3. Semantic integration
The aim the TDH is the development of an integrated assessment infrastructure for greater breadth of research into tropical environmental issues. Here the scope of investigation and line of enquiry spans across scientific and economic approaches. For example, questions posed by the scientist may involve component models with increasing complexity in the data sources for integrated hypotheses and/or assessment and understanding of how increases and decreases affect ecosystems, while policy makers can receive clearer pictures of the sensitivity of ecological impacts from population growth.
The TDH has a unique mix of knowledge discovery functionality. The TDH offers a horizontal cross connect over a flexible range of “vertical” domains for data sharing, synthesis and analysis in a collaborative open environment (Figure 3). The accessibility is made possible via a public web site that allows visitors to search, browse and interact with tropical region-specific data generated via data gathering efforts, models and synthesis methods. The outcomes of the system are diverse, such as interactive maps, charts and reports, also direct access to raw data formats and metadata are made possible via the portal.
[image:7.612.127.452.86.325.2]The TDH is being developed as a KR platform, so researchers can combine disjoint or unrelated data into a single Knowledge System to pose questions of the data. The internally and externally stored data will be published via the TDH in a form that is conducive to the linked data initiative. The linked data movement defines the processes and best practices for publishing and connecting structured and semi-structured data on the Web [20].
The specified format for linking data through semantic definitions is the Resource Description Framework
(RDF) [21]. The RDF form provides a generic, graph-based data model with which to structure and link data to describe real world “things”. Data that is in RDF form is web available and computer consumable (i.e., understandable) as opposed to the current web of human readable/writable documents.
Domain vocabularies and ontologies are expressed in RDF using terms from the RDF Schema and the Web Ontology Language (OWL) [21, 22]. Inference and logical reasoning for automated classification and inferred conclusions is possible at these levels of semantic conceptual description.
The KB will include a semantic layer of formal and informal ontologies that can generically model the areas of science and the type of hypotheses synonymous with the variety of disciplines within tropical research. For example, to provide an understanding of the diverse types of data held within the TDH, an ontology to define the data has been developed. This “data” ontology describes the purpose and characteristics of the data, the different formats, the metadata standard, etc.
The Semantic level of the TDH will have a dual purpose: To ask questions of the data across disciplines and to find gaps in current data that would be required for a more complete answer to the lines of enquiry.
The ontologies range from informal through to formal and, when coupled to datasets, derive inferences from data to “ask” the KB questions for semantic correlation, synthesis and analysis. The ontology design leverages the scalable and autonomic characteristics of semantic technologies such as modularity, reuse and the ability to link latent connections in data through complex logic systems.
5. Proof of concept – Visualization for different data formats
A use-case implementation of the TDH knowledge system is a portal for the visualization and assessment of different data sources. In this case significant land use and species distribution data in Northern Australia is used for a proof of concept.
A GIS often needs to integrate heterogeneous data sets with a unified logical view. However, it is difficult to integrate and utilize these data sets due to the different schema and semantics of these datasets [23,24]. Currently, the GeoNetwork [25] based service incorporates geo-hydrological data (vector data) and bird species distribution (raster data) in the wet tropics of Northern Australia (Figure 4). The GIS offers search facilities to overlay primary data on river attributes such as stream reaches, sub-catchments and catchment areas. The information derived from these hydrological datasets are essential components in the management and conservation decision-making of stream ecology natural resources [26]. The first purpose of this service is to map the migratory movement and refugia of hundreds of bird species over a period of time in correlation with the changing climate. In addition, visualization over time and space on the topography and land-use of rivers and the surrounding landscapes add a more powerful real-time view of the environment.
[image:8.612.127.470.480.665.2]The outcome of the integration of hydrology and species distribution datasets models potential and on-going threats to both in-stream and downstream habitats and biodiversity for a variety of native bird species. The data
resources entail primary data on river attributes such as stream reaches, sub-catchments and catchment areas and spatial data on the topography, land use and natural assets characterizing rivers and their surrounding landscapes. These datasets are essential components in the exploration of stream ecology and problem-solving endeavors to answer questions about conservation and the management of hydrological natural resources [27].
6. Prototype – The Wallace Initiative
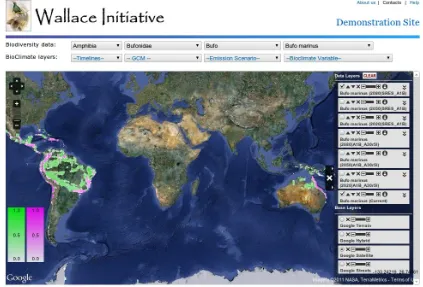
The Wallace Initiative is a global effort to rapidly assess the potential impacts of climate change on global biodiversity [3]. An understanding of the projected magnitude of change and the potential impacts is required to reduce the vulnerability of biodiversity (including agricultural biodiversity) to climate change. The Wallace Initiative brings together experts on climate change (Tyndall Climate Change Centre, UK) and bioclimatic modeling (TDH James Cook University, Australia and Centre for Tropical Agriculture, Colombia), with global datasets on biodiversity (Global Biodiversity Information Facility, Denmark) and high performance computing facilities. This collaborative effort models the potential impacts of climate change and graphic visualization is made available via a TDH web portal. For example, the current model shows the impact on approximately 50,000 terrestrial plant and animal species.
These models are then used to calculate projected changes in percent species richness. The focal areas are likely to be refugia under various degrees of temperature change, and areas likely to undergo the greatest loss. This information can provide guidance to the World Wildlife Foundation and its partners on how they may need to adapt to climate change to avoid biodiversity loss. The web portal allows other practitioners, decision makers, and eventually, the public, to have access to these climate change projections. Figure 5 shows the sample output from this model – the current Bufo cane toad distribution (green) and the predicted distribution (pink) for 2080 using the 3.5 degree Celsius global average temperature rise.
[image:9.612.92.515.67.354.2]This component of the TDH knowledge system is more than just an academic exercise. The results that have been generated are already guiding conservation planning and practice. For example, the first generation of the models, for plants, was used in a conservation planning exercise for the Amazon region. These results identified areas that are potentially refugia (i.e., resilient) to climate change. A comparison was then made between current protected areas and conservation priorities and these refugia to help guide the addition to several new areas
(especially in the Northern Andes) to be conservation priorities. The exercise also identified several areas that are potentially highly vulnerable to climate change.
The TDH web portal for the Wallace Initiative data has been used to help identify refugia for mammals, birds, reptiles, amphibians and plants. This is the first time the full suite of outputs from these models has been used in conservation practice (the Amazon looked only at plants). The map of potential refugia was overlaid with a map of proposed protected areas. These proposed areas were identified as having the highest remaining biodiversity. The exercise identified one proposed protected areas that was a potential refugia for all five taxa, yet no group had championed its preservation. The findings may now not only spur a group to champion the area as protected, but also for it to be proposed for a stricter level for conservation than currently planned. The Wallace Initiative refugia study also identified two areas that had no protected areas (current or proposed) in them. Experts from the field originally said that these areas had little remaining habitat left but a quick download and analysis of satellite data via the TDH web portal showed areas that still had remaining, intact habitat. These areas have now been marked as areas where surveys are required.
Currently, this component of the TDH is a prototype/proof of concept demonstration site. The main task was to allow practitioners and decision makers access to current and predicted biodiversity and climate data to process and visualize various Global Climate Models (GCMs) and C02 emission scenarios. To date the site shows climate predictions across nineteen climate variables for four timelines, seven GCMs and six emission scenarios and biodiversity densities for 50,000 species.
7. Conclusion
This paper presented the TDH as an e-Research platform to serve data sets related to tropical research from a single virtual location. The TDH includes data-integration, visualization and analytical tools to enable researchers, managers and decision-makers to collaborate around the data.
The TDH is initially being established to support data intensive research on the effects of climate change on tropical environments, in particular the discovery of flora and fauna refugia and biodiversity hotspots that can be used as locations of last resort for species under periods of intense climate anomalies (e.g., extended drought or heat waves) [17].
The TDH is proposed as an “open” portal, with contributors submitting data sets and other content in an open and collaborative way. Sophisticated KR and inference are facilitated via semantic technologies to exploit the Linked Data Paradigm. Data from the TDH is being combined with major data repositories and metadata repositories such as ANDS, the Research Data Storage Infrastructure (RDSI) and the Terrestrial Ecosystem Research Network (TERN) among others.
The TDH automates the data capture process by providing a standardized interface for sensor web accessible systems. This means that data can be obtained or indexed in near real-time from environmental sensor networks that comply with Sensor Web Enablement standards (such as those offered by the Commonwealth Scientific and Industrial Research Organization (CSIRO), SEMAT and the DRO. Therefore, the TDH can be updated without user intervention and always reflects the latest in varied environmental data across regions.
Exemplars in data integration and visualization such as the hydrology and species distribution overlay and the Wallace Initiative have been described here. The benefits of merging data sets for analysis and visualization is apparent and is imperative to research on the impact of climate change and other influences on biodiversity and ecology. The prototypes are currently in use for researchers and decision makers to access and visualize climate and land use projection models for conservation and natural recourse management.
The hub will incorporate elements that go beyond research data, and have a role in public dissemination of research to government, industry and the public. Our vision is a tropical hub that will be the centre of a range of e-Research services and outputs from organizations such as ANDS and universities involved in tropical research and development.
References
[1] M. Spalding, C. Ravilious, and E. Green, World atlas of coral reefs. University of California Press: London, England, 2001.
[2] J. A. Patz, D. Campbell-Lendrum, T. Holloway, and J. A. Foley, Impact of regional climate change on human health. Nature 2005; 438(7066): 310-317.
[4] J. Hendler, Science and the Semantic Web. Science 2003; 299(5606): 520-521.
[5] T. Hey and A. E. Trefethen, e-Science and its implications. Philosophical Transactions of the Royal Society 2003; 361(1809): 1809-1825.
[6] A. Thorpe, Environmental eScience. Phil. Trans. R. Soc. A 2009; 367(1890): 801-802.
[7] C. Goble, O. Corcho, P. Alper, and D. De Roure, e-Science and the Semantic Web: a symbiotic relationship, Proceedings of the Proceedings from the 9th International Conference in Discovery Science (DS 2006), Barcelona, Spain, (2006).
[8] W. Hall, D. D. Roure, and N. Shadbolt, The evolution of the Web and implications for eResearch Phil. Trans. R. Soc. A 2009; 367(1890): 991-1001.
[9] Y. Gil, E. Deelman, M. Ellisman, T. Fahringer, G. Fox, D. Gannon, C. Goble, et al., Examining the challenges of scientific workflows. IEEE Computer 2007; 40(12): 24-32.
[10] S. Androulakis, A. M. Buckle, I. Atkinson, D. Groenewegen, N. Nicholas, A. Treloar, and A. Beitz, ARCHER–e-Research Tools for Research Data Management. International Journal of Digital Curation 2009; 4(1): 22-33.
[11] D. De Roure, C. Goble, J. Bhagat, D. Cruickshank, A. Goderis, D. Michaelides, and D. Newman, myExperiment: defining the social virtual research environment, Presented at the 4th IEEE International Conference on eScience (e-Science 08), Indianapolis, IN, USA, 2008.
[12] D. De Roure and C. Goble, Software design for empowering scientists. IEEE Software 2009; 26(1): 88-95. [13] G. Antoniou and F. van Harmelen, A Semantic Web primer (2nd edition), 2nd ed. The MIT Press: Cambridge,
MA, USA, 2008.
[14] T. S. Myers, I. M. Atkinson, and R. Johnstone, Supporting coral reef ecosystems research through modelling a re-usable ontology framework. J. Appl. Artif. Intell 2010; 24(1): 77-101.
[15] S. E. Williams, J. VanDerWal, J. Isaac, L. P. Shoo, C. Storlie, S. Fox, E. E. Bolitho, et al., Distributions, life-history specialization, and phylogeny of the rain forest vertebrates in the Australian Wet Tropics. Ecology 2010; 91(8): 2493-2493.
[16] S. E. Williams, Y. M. Williams, J. VanDerWal, J. L. Isaac, L. P. Shoo, and C. N. Johnson, Ecological specialization and population size in a biodiversity hotspot: How rare species avoid extinction. Proceedings of the National Academy of Sciences 2009; 106(2): 19737-19741.
[17] IPCC, Climate change 2007: the physical basis, Contribution of Working Group I to the Fourth Assessment Report of the Intergovernmental Panel on Climate Change, Cambridge Univ. Press, Cambridge, U. K. 2007. [18] J. Trevathan, I. Atkinson, W. Read, N. Bajema, Y. J. Lee, R. Johnstone, and A. Scarr, Developing Low-Cost
Intelligent Wireless Sensor Networks for Aquatic Environments, Presented at the Proceedings of the International Conference on Intelligent Sensors, Sensor Networks and Information Processing (ISSNIP'10), Brisbane, Australia, 2010.
[19] M. Botts, G. Percivall, C. Reed, and J. Davidson, OGC® Sensor Web Enablement: Overview and High Level Architecture, in: GeoSensor Networks, vol. 4540/2008. Berlin: Springer Berlin / Heidelberg, 2008, pp. 175-190.
[20] C. Bizer, T. Heath, and T. Berners-Lee, Linked data-the story so far. Int. J. Semantic Web Inf. Syst. 2009; 5(3): 1-22.
[21] D. Brickley, R. V. Guha, and B. McBride, RDF vocabulary description language 1.0: RDF Schema, http://www.w3.org/TR/rdf-schema/ [June, 2011].
[22] D. L. McGuinness and F. van Harmelen, OWL: Web Ontology Language overview http://www.w3.org/TR/owl-features/ [August, 2011].
[23] B. Ludäscher, A. Gupta, and M. E. Martone., A Model-Based Mediator System for Scientific Data Management, in: Bioinformatics: Managing Scientific Data, Z. Lacroix and T. Critchlow, Eds.: Morgan Kaufmann, 2003.
[24] B. N. Lawrence, R. Lowry, P. Miller, H. Snaith, and A. Woolf, Information in environmental data grids. Phil. Trans. R. Soc. A 2009; 367(1890): 1003-1014.