This document is downloaded from DR-NTU, Nanyang Technological
University Library, Singapore.
Title
Metabolomic profiling of rhodosporidium toruloides grown
on glycerol for carotenoid production during different
growth phases( Main article )
Author(s)
Lee, Jaslyn Jie Lin; Chen, Liwei; Shi, Jiahua; Trzcinski,
Antoine; Chen, Wei Ning
Citation
Lee, J. J. L., Chen, L., Shi, J., Trzcinski, A., & Chen,
W.-N. (2014). Metabolomic profiling of rhodosporidium
toruloides grown on glycerol for carotenoid production
during different growth phases. Journal of agricultural and
food chemistry, 62(41), 10203-10209.
Date
2014
URL
http://hdl.handle.net/10220/25205
Rights
Edit Trace of Manuscript 10.1021/jf502987q
Metabolomic Profiling of
Rhodosporidium toruloides
—h
R
—o
—d
—o
—s
—p
—o
—r
—i
—d
—i
—u
—m
—
t
—o
—r
—u
—l
—o
—i
—d
—e
—s
—Grown on Glycerol for C
—a
—r
—o
—t
—e
—n
—o
—i
—d
—s
—Carotenoid Production
D
—u
—r
—i
—n
—g
—during Different Growth Phases
Jaslyn Jie LinLee,†LiweiChen,‡JiahuaShi,‡AntoineTrzcinski,†andWei-NingChen*†,‡*—
†Advanced Environmental Biotechnology Centre, Nanyang Environment and Water Research Institute, Nanyang Technological University, 1 Cleantech Loop,Singapore637141 .—
‡School of Chemical and Biomedical Engineering,Nanyang Technological University, 62 Nanyang Drive, Singapore637459
*—oc—r—r—e—s—p—o—n—d—i—n—g—a—u—t—h—o—r—:—T—e—l—.—(W.-N.C.) Phone:+65 63162870. Fax: +65 67947553. E-mail:WNChen@ntu.edu.sg.
C
—a—r—o—t—e—n—o—i—d—s—Carotenoid production from three strains of Rhodosporidium toruloides—hR—o—-— d
—o—s—p—o—r—i—d—i—u—m— t—o—r—u—l—o—i—d—e—s— grown on glycerol was studied. A time d—e—p—e—n—d—a—n—t—-dependent metabolomics approach was used to understand its metabolism on glycerol and mechanism for c
—a—r—o—t—e—n—o—i—d—s—carotenoid production in three strains,—during different growth phases (1—,—4—,—7—1, 4, 7, and 12 d—days). T—h—e—s—t—r—a—i—n—Strain CBS 5490 was the highest c—a—r—o—t—e—n—o—i—d—s—carotenoid producer (2—8—.—5—m—g—28.5 mg/L) and had a unique metabolic profile. In this strain, metabolites belonging to the TCA cycle and amino acids were produced in lower amounts, as compared to the other strains. On the other hand, it produced the highest amounts of c—a—r—o—t—e—n—o—i—d—s—carotenoid and fatty acid metabolites. This indicated that the lower production of the TCA cycle and amino acid metabolites w—a—s— t—o— p—r—o—m—o—t—e—promoted energy and metabolic flux t—o—w—a—r—d—s—toward the c
—a—r—o—t—e—n—o—i—d—s—carotenoid and fatty a—c—i—d—s—acid synthesis metabolic p—a—t—h—w—a—y—pathways. This study shows that metabolomic profiling is a useful tool to gain insight into the metabolic pathways in the cell,—and to shed light on the different molecular m—e—c—h—a—n—i—s—m—mechanisms between strains.
TOC Graphic
Keywords:M—e—t—a—b—o—l—o—m—i—c—s—metabolomics; glycerol; R. toruloides; carotenoids; GC-MS
SI File: jf502987q_si_001.pdf
Introduction
Glycerol is a widely available product due to the i—n—c—r—e—a—s—e—increased demand for biodiesel production w
—o—r—l—d—-—w—i—d—e—worldwide. For every gallon of biodiesel produced, 1.05 pounds of glycerol is produced as a side product. It is predicted that the biodiesel industry would produce 37 billion g—a—l—l—o—n—gallons of biodiesel by 2016. As a result, the price of glycerol has decreased to $0.30 per pound. 1Thus, this has generated a w—i—d—e—s—p—r—e—a—d—widespread interest in using glycerol as a low -cost substrate for microbial fermentation to produce value -added compounds. 2
Rhodosporidium toruloides—hR—o—d—o—s—p—o—r—i—d—i—u—m— t—o—r—u—l—o—i—d—e—s—is a red yeast that is gaining interest for its robust ability to grow on a variety of waste substrates.3−6 3——6-—It is used to produce valuable compounds such as cephalosporin esterase, phenylalanine ammonia -lyase, and epoxide hydrolase.7−9 7——9-—In recent years, there is a growing body of literature on this yeast for its ability to produce the valuable metabolic products carotenoids and fatty acids.6,10,11
supplement and food colorant.12The β-carotene market potential is estimated to be worth over U—S—D—U.S. $280 million in 2015. The current industrial producer of β-carotene is from the m—i—c—r—o—a—l—g—a—e—microalgaDunaliella salina—uD—n—a—l—i—e—l—l—a— s
—a—l—i—n—a—. However c—a—r—o—t—e—n—o—i—d—s—, carotenoid production from algae is generally expensive and requires large areas for cultivation,—; hence, there is increasing demand for studies of other microorganisms and methods of cultivation.13
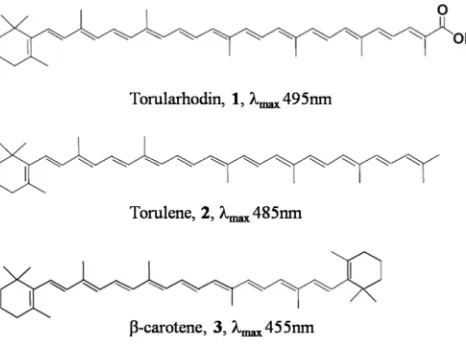
[image:3.612.75.308.244.416.2]R. toruloidesproduces the carotenoids:—torularhodin,1—; torulene,, 2—; and β-carotene,, 3(Figure1).14All three carotenoids have applications as food colorants and poultry feed.15 1—5—Apart from β-carotene, other lesser known carotenoids were also studied for their antioxidant activities. Torulene, 2, was found to have more antioxidant potential than β-carotene, due to its higher number of double bonds. 16,17Torularhodin, 1, may be a more potent singlet oxygen quencher than β-carotene, due to its longer polyene chain.
Figure 1.—hT—e—s—t—r—u—c—t—u—r—e—Structures and absorption maxima (λmax) of the carotenoids:—torularhodin,1—; torulene,, 2—; and, β-carotene,3.
The emerging F—o—o—d—o—m—i—c—s—foodomics trend uses a mass spectrophotometry (MS) based approach to advance food science and nutrition, for its fast and high -throughput nature. 18Under the foodomics field, untargeted metabolomics is an analytical strategy to identify all metabolites in an organism under a given set of conditions. 19 This use of metabolomics r—a—n—g—e—ranges from analyzing wine profiles t—o—d—e—v—e—l—o—p—for the development of a predictive model to aid wine development by nontargeted GC-MS,—20to studying microbial metabolism,—21and is also used to identify the main compound in strawberry responsible for its anti-inflammatory benefits. 22
The ability ofR. toruloidesto use glycerol as a substrate for fermentation has been well explored. 6,23,24Its pro-teomic profile has also been studied in lipid -accumulating conditions using LC-MS-based metabolomic technology.11 1
—1—However, studies on the metabolism of this unique yeast on glycerol, and its mechanism to convert glycerol into carotenoids i—s—are lacking. In this study we analyze the potential of c—a—r—o—t—e—n—o—i—d—s—carotenoid production from three strains grown on glycerol using HPLC,—and a—n—a—l—y—z—e—d—their metabolic changes at four different growth phases via GC-MS. The differential metabolite profile would also be useful to understand the differences in c—a—r—o—t—e—n—o—i—d—s—carotenoid production between the strains.
Materials and Methods
Fermentation ofR. toruloides
0.2 containing 50 mL of fermentation media. Fermentation media contained (per liter) 20 g of peptone, 10 g of yeast extract, and 60 g of glycerol, purity = 99% (Sigma, St. Louis, MO, USA). Fermentation was carried out in an incubator for 12 d—days in 250 mL Erlenmeyer flasks at 30 °C, with shaking at 250 rpm. Three biological replicates were carried out for each strain.
Growth and c—a—r—o—t—e—n—o—i—d—s—e—x—t—r—a—c—t—i—o—n—Carotenoid Extraction
To measure the growth of the yeasts, the OD of the culture media was measured at a wavelength of 600 nm, using a Nano Drop 2000 UV spectrophotometer (Thermo Scientific, Waltham, MA, USA). Dry cell weight was quan-titated by drying 1 mL of washed culture supernatant in an oven set at 70 °C until constant dry cell weight (DCW). Biomass was quantitated by using a standard curve correlating OD at 6—0—0—n—m—600 nm to dry cell weight. To analyze the intracellular c—a—r—o—t—e—n—o—i—d—s—carotenoid content of the cells, 1 mL of culture media was taken. The cells were cen-trifuged at 1—0—,—0—0—0—x—10000g, washed with M—i—l—l—i—Q—Milli-Q water, and broken with glass beads using a Fast Prep bead grinder (MP Biomedicals, Solon, OH, USA). Carotenoids were extracted with acetone until the cell pellet was col-orless. Carotenoids w—a—s—were measured and quantitated using standards from CaroteNature (Ostermundigen, Switzer-land). The spectrophotometric measurement of carotenoids was according to their absorption maxima peak (λmax), which is the middle maximum of their UV/—−vis spectra in acetone. They were measured as follows: torularhodin,1, at 495 nm,—; torulene,2, at 485 nm; and β-carotene,3, at 455 nm.
C
—a—r—o—t—e—n—o—i—d—s—c—h—a—r—a—c—t—e—r—i—z—a—t—i—o—n—Carotenoid Characterization and q—u—a—n—t—i—t—a—t—i—o—n—Quantitation
To confirm the quantitation and characterization of carotenoids extracted in acetone in each strain, high -perfor-mance liquid chromatography (HPLC) equipped with a photodiode array detector was used as it is a validated method.26 The carotenoids torularhodin,—(1), torulene,—(2), and β-carotene,—(3—) were identified b, —a—s—e—d—on the basis of their re-tention t—i—m—e—times using standards from CaroteNature (—O—s—t—e—r—m—u—n—d—i—g—e—n—,—S—w—i—t—z—e—r—l—a—n—d—)—. An Agilent 1100 S—e—r—i—e—s—series instrument was employed, and the column used was a 250 mm x—× 4.6 mm i.d., 5 µ—m—μm, Li-Chrospher 100 RP-18, with a 4 mm x—× 4 mm i.d. guard column of the same material (Merck, Rahway, NJ, USA). A gradient from 70-—to 100% acetone in M—i—l—l—i—Q—Milli-Q water at a flow rate of 0.5 mL/min was used as the mobile phase. Detection was performed at 450 nm, and the UV/—−vis absorption spectra were recorded online with the photodiode array detection system. Extracellular g—l—y—c—e—r—o—l—a—n—a—l—y—s—i—s—Glycerol Analysis
To analyze extracellular glycerol levels in the culture media, 1 mL of culture m—e—d—i—a—medium was taken every 24 h and filtered. Glycerol was quantitated using HPLC equipped with a refractive index detector using a standard of purity of 99% (Sigma,—S—t—.—L—o—u—i—s—,—U—S—A—). The column used was an Aminex HPX-87H column (Bio-Rad, Hercules, CA, USA). M
—i—l—l—i—Q—Milli-Q water was used as the mobile phase at a flow rate of 0.6 mL/min, with temperature controlled at 65 °C, and detection was performed at 210 nm.
Metabolic p—r—o—fi—l—e—Profile of e—a—c—h—s—t—r—a—i—n—Each Strain at d—i—f—f—e—r—e—n—t—g—r—o—w—t—h—p—h—a—s—e—Different Growth Phases and GC-MS a—n—a—l—-— y
—s—i—s—Analysis
The intracellular metabolites were extracted from all three strains at four different time points: early log growth phase on d—day 1, middle of log growth phase on d—day 4, as cells enter stationary phase on d—day 7, and during death phase at the end of fermentation on d—day 12. C—e—l—l—s—Cell suspensions with an OD of 10 were l—y—z—e—d—lysed and quenched in 800 µ—l—μL of ice -cold methanol using glass beads and a bead grinder. 1—0—µ—l—Ten microliters of 2 mg/mL ribitol dissolved in M—i—l—l—i—Q—Milli-Q water was added to each sample as an internal standard to correct for any loss of metabolite during the extraction process. The supernatant was extracted and then air -dried using a heat block set at 30 °C overnight. Next, 50 µ—L—μL of 20 mg/mL solution of methoxyamine hydrochloride in pyridine was added to protect the carbonyl groups and incubated at 37 °C for 1 h. Silylation was then carried out by adding 99 µ—L—μL ofN-methyl-N-(trimethylsilyl)-— t
—r—i—fl—u—o—r—o—a—c—e—t—a—m—i—d—e—trifluoroacetamide (MSTFA) with 1—µ—l—1 μL of trimethylchlorosilane (TMCS) and incubated for 30 min at 70 °C.
Samples were then shaken vigorously for 2 h at room temperature before t—r—a—n—s—f—e—r—r—i—n—g—they were transferred to sample vials,—and covered with Parafilm to prevent evaporation. Metabolite analysis was carried out using gas chro-matography coupled with a mass spectrophotometer (GC-MS). All samples for GC-MS were run within 24 h. 1—µ—l—One microliter of sample was injected using a Shimadzu QP 2010 Plus GC-MS system. The oven temperature was kept at 75 °C for 4 min, a—n—d—w—a—s—raised at 4 °C/min,—to a final temperature of 280 °C, and held for 2 min. Mass spectra were recorded fromm/z35-—to 600 with a scan time of 0.2 s.27The total elution time for mass spectra collected for each sample was 58 min. Data processing and metabolite identification w—a—s—were carried out accordingly.28
Results and Discussion
We have found 60 g/L to be the optimized glycerol concentration to ensure growth and carotenoid production in the three strains (data not shown). Glycerol is able to enter the cell through diffusion and/or active transport.29Extracellular glycerol in the culture media was depleted from the culture media by d—day 3 for s—t—r—a—i—n—strains AC and AS,—and by d—day 4 for strain CBS. This showed that the three strains could assimilate glycerol and grew comparatively well (Figure2). From the biomass curve of the three strains in Figure2, we define that all three strains were in the logarithmic (log) phase of growth from d—days 1 and 6, entered stationary phase on d—day 7, and w—a—s—were in the death phase by d—day 12. Cells underwent division and replication by obtaining energy from glycerol through glycolysis. The best strain to use glycerol as a substrate for cell growth was CBS. The cells produced the highest concentration of biomass (42.3 g/L) during late stationary phase, as compared to 37.2 g/L by AC and 38.4 g/L by AS (Figure2).
Figure 2.Biomass concentration, extracellular glycerol levels, and t—h—e—spectrophotometric quantitation of carotenoids:— torularhodin,—(1), torulene,—(2), and β-carotene,—(3—) of all t, —h—e—three strains. The error bar indicates the SD.
C
—a—r—o—t—e—n—o—i—d—s—q—u—a—n—t—i—t—a—t—i—o—n—Carotenoid Quantitation by UV s—p—e—c—t—r—o—p—h—o—t—o—m—e—t—e—r—Spectrophotometer
Rhodosporidiumyeasts are known to produce the carotenoids:— torularhodin,1—; torulene,, 2—; and β-carotene,, 3.14In the three strains, c—a—r—o—t—e—n—o—i—d—s—carotenoid concentration reached a plateau during stationary growth phase (Figure 2). The strain CBS was the highest c—a—r—o—t—e—n—o—i—d—s—carotenoid producer of all strains,—for the three types of carotenoids: torularhodin,1—; torulene,, 2—; and β-carotene,, 3.
Characterization and q—u—a—n—t—i—t—a—t—i—o—n—Quantitation of c—a—r—o—t—e—n—o—i—d—s—Carotenoids by HPLC
To our knowledge, there has been no report of the characterization of carotenoids in these strains. It was found that the carotenoid values obtained by spectrophotometry and HPLC greatly differed, so the values quantitated by HPLC were taken as it is a more accurate method.30The milli-absorbance units (mAU) obtained from the HPLC profile were quantitated using carotene standards. Our analysis showed that all strains produced torularhodin,—(1), torulene,—(2), and β-carotene,—(3) in different percentages (Figure3), although torularhodin,—(1—) was the most abundant carotenoid, in all three strains. All of the carotenoids eluted within 24 t—o—−28 min as shown in Table1. The HPLC results confirmed the UV spectrophotometer findings that CBS was the highest carotenoid producer. As quantitated from HPLC, at the end of fermentation on d—day 12, it produced 28.5 mg/L, as compared to 18 mg/L by AC and 19.3 mg/L by AS. It also produced the highest amount of the industrially relevant compound β-carotene,3(Figure3).
Table 1. Production of Carotenoids B—y—by the Three Strains Quantitated by HPLC
S
—t—r—a—i—n—strain
C
—a—r—o—t—e—n—o—i—d— R —e—t—t—i—m—e—
(
—m—i—n—)— AC AS CBS
carotenoid ret time (min)
Kmg/LT
m —g—/—L—
(
—% of total carotenoids)—
Kmg/LT
m —g—/—L—
(
—% of total carotenoids)—
Kmg/LT
m —g—/—L—
(
—% of total carotenoids)—
T —o—r—u—-—
l
—a—r—h—o—d—i—n—Kto-—
rularhodin,1
T—1,—
2
—4—.—5—K24.5−2
5.1T—2-—5—.—1—
7.4 41 12.5 65 19.7 69
T —o—r—u—-—
l
—e—n—e—torulene, 2
2
—7—.—3—K27.3−2
7.9T—2-—7—.—9—
7 39 2.5 13 2.0 7
β-carotene,3 —82—.—0—K28.0−2
8.5T—2-—8—.—5—
3.6 20 4.3 22 6.8 24
T
—o—t—a—l—total 18 19.3 28.5
accounting for the different c—a—r—o—t—e—n—o—i—d—s—p—r—o—d—u—c—t—i—o—n—carotenoid productions in the three strains. In total, 13 important differential metabolites were identified, and the changes in their levels are shown in Figures
[image:7.612.71.372.233.471.2]5 and6. The metabolites could be classified into carbohydrates, TCA cycle intermediates, fatty acids, and amino acids. To apply the knowledge of metabolomic changes seen in the cell, we have mapped the changes in relation to biochemical pathways, as depicted in Figure4. This gives a view of the metabolite changes in comparison to the other strains AC and AS, which could help us to understand the reason for higher carotenoid accumulation in strain CBS.
Figure 4. Metabolic changes in t—h—e—strain CBS mapped onto metabolic pathways during the four different growth phases on d—days 1, 4, 7, and 12. C—o—l—o—u—r—e—d—Colored symbols represent an increase, decrease, or no change in the level of the metabolite at each time point, as compared to the other strains AC and AS. Orange arrows represent the general flow of metabolic flux in strain CBS.
Figure 6. Quantitated metabolite profiling in the three strains AC, AS, and CBS during different growth phases by GC-MS.—C—h—a—n—g—e—s—: changes in the TCA cycle intermediate metabolites malic acid and succinic acid, and levels of the total intracellular fatty acids metabolites:—(oleic acid, stearic acid, linoleic acid, and palmitic acid). The error bar indicates the SD of three biological replicates.
C
Glycerol was used as the sole carbon source in this study. In the cell, glycolysis is the pathway w—h—i—c—h—that supplies the cells with energy, by breaking down sugars such as glycerol, to form the final pyruvate molecule. During glycoly-sis, glycerol is converted into glyceraldehyde-3-phosphate, transformed into phosphoenolpyruvate (PEP), and finally into pyruvate (Figure 4). Pyruvate may enter the mitochondria and is converted into acetyl-CoA w—h—e—r—e—i—t—, which enters the citric acid cycle (TCA). Acetyl-CoA is an important molecule as it is the precursor of the fatty acid and c
—a—r—o—t—e—n—o—i—d—s—carotenoid synthesis pathway.31In Figure5, the intracellular metabolite glycerol was found to decrease in all three strains in comparatively the same manner,—as glycolysis took place.
Amino a—c—i—d—s—m—e—t—a—b—o—l—i—t—e—s—Acid Metabolites
Amino acids can be synthesized from compounds in the glycolysis pathway and TCA cycle. The glycolysis path-way provides the substrate glyceraldehyde-3-phosphate,—for the synthesis of threonine, serine, and glycine, which are used to form branched -chain amino acids (Figure4). The amino acid alanine is synthesized from the pyruvate mol-ecule provided by the glycolysis pathway. Glutamate and proline are synthesized from the intermediate of the TCA cycle, α-ketoglutarate (α-KG).
Interestingly, we observe that the strain CBS demonstrated a unique amino acid metabolic profile. In comparison to AC and AS s—t—r—a—i—n—strains, all of the amino acids were generally synthesized in lower amounts (Figure5). This might suggest that the cellular mechanism of the CBS strain preferably synthesized less amino acids, which resulted in more available acetyl-CoA to enter the c—a—r—o—t—e—n—o—i—d—s—carotenoid and fatty acid synthesis p—a—t—h—w—a—y—pathways. This could con-tribute to the higher levels of carotenoids and total intracellular fatty acids observed in strain CBS.
TCA c—y—c—l—e—i—n—t—e—r—m—e—d—i—a—t—e—m—e—t—a—b—o—l—i—t—e—s—Cycle Intermediate Metabolites
The TCA cycle is a key metabolic pathway in all cells. After glycolysis, pyruvate enters the mitochondria,—and is converted into acetyl-CoA, which undergoes oxidative phosphorylation to provide energy for the cell in the form of NADH and NADPH. The TCA cycle contains intermediates such as succinic acid and malic acid.
In strain CBS we also observed a general down -regulation in production of the TCA cycle intermediates, malic acid and succinic acid, as compared to s—t—r—a—i—n—strains AC and AS (Figure6). Therefore, we propose that the TCA cycle was down -regulated,—to enable more acetyl-CoA from glycolysis to enter the carotenoids and fatty acid synthesis pathway. This contributes to higher c—a—r—o—t—e—n—o—i—d—s—carotenoid production in C—B—S—s—t—r—a—i—n—strain CBS. This is also seen in a previous study w—h—e—r—e—in which the decrease of the TCA cycle intermediate malic acid,—enhanced β-carotene production in the yeastBlakeslea trispora—lB—a—k—e—s—l—e—a—t—r—i—s—p—o—r—a—.32
Fatty a—c—i—d—m—e—t—a—b—o—l—i—t—e—s—Acid Metabolites
R. toruloidesis an oleaginous yeast w—h—i—c—h—that has been studied for its ability to accumulate high amounts of lipids. The total intracellular fatty acids synthesized by all three strains was palmitic acid, oleic acid, linoleic acid, and stearic acid, which is in accordance with previous results.23The highest c—a—r—o—t—e—n—o—i—d—s—carotenoid-producing strain, CBS, was also the highest fatty a—c—i—d—s—acid producer, especially the unsaturated oleic acid and linoleic acid (Figure6).
The cell membrane is made up of a p—h—o—s—p—h—o—-—l—i—p—i—d—phospholipid bilayer where many biochemical processes take place. Both fatty acids and carotenoids are localized in the lipid bilayer membrane. Carotenoid-—−lipid interactions play a role in the regulation of membrane fluidity and integrity. β-c—a—r—o—t—e—n—e—Carotene molecules are randomly integrated in the hydrophobic interior of the lipid bilayer. Its ability to penetrate deeper into the membrane is dependent on the fluidity of the membrane. Higher amounts of unsaturated fatty acids in the bilayer result in increased membrane fluidity, thereby allowing more β-carotene to accumulate deeper into the interior of the bilayer.33Therefore, the high content of the unsaturated fatty acids, oleic acid and linoleic acid, in strain CBS s—t—r—a—i—n—,—may have served not to increase the membrane stability,—but i—m—p—r—o—v—e—d—to improve the cell membrane fluidity to enhance the accumulation of all three carotenoids. In support of this, a study by Li et al.34has also shown that oleic acid could help increase membrane fluidity to overcome ethanol stress inSaccharomyces cerevisiae—aS—c—c—h—a—r—o—m—y—c—e—s—c—e—r—e—v—i—s—i—a—e—.
production t—o—c—a—r—o—t—e—n—o—i—d—s—and carotenoid biosynthesis, especially in the unsaturated fatty acids oleic acid, which could help increase membrane fluidity and m—o—r—e—lipid b—o—d—i—e—s—body formation.
C
—a—r—o—t—e—n—o—i—d—s—s—y—n—t—h—e—s—i—s—p—a—t—h—w—a—y—Carotenoid Synthesis Pathway
Isoprenoids such as carotenoids are secondary metabolites produced at highest levels during late log phase to early stationary phase,38 which is consistent with our observations. As seen in Figure4, in the carotenoid synthe-sis pathway, γ-carotene is the metabolic branch point for β-carotene and the torulene/torularhodin pathway. From g
—a—m—m—a—γ-carotene, cyclization forms the dicyclic carotenoid β-carotene, w—h—i—l—e—whereas oxidation takes place to form the monocyclic carotenoid torulene, 2, and further oxidation into torularhodin, 1. 39 In all strains the highly o—x—i—-— d
—i—s—e—d—oxidized end product torularhodin,1, was the major carotenoid formed (Table1). The regulatory mechanisms controlling the carotenoid synthesis pathways are not well understood, and further studies are required.
In summary, the use of a metabolomics strategy to study the metabolic profile at different time points has allowed us to gain insight into the metabolism and biochemical pathways ofR. toruloides. Also, it helped us understand the underlying differences in c—a—r—o—t—e—n—o—i—d—s—carotenoid-producing ability between strains. The results suggested that fatty a
—c—i—d—s—acid synthesis was beneficial to increase c—a—r—o—t—e—n—o—i—d—s—carotenoid production. However, more studies on the rela-tionship between fatty acids and c—a—r—o—t—e—n—o—i—d—s—carotenoid synthesis is needed. Knowledge from this study could aid future work to increase c—a—r—o—t—e—n—o—i—d—s—y—i—e—l—d—carotenoid yields by metabolic engineering in microorganisms.—F—o—r—, for example, to down -regulate the TCA cycle and amino acid synthesis,—and increase the unsaturated fatty a—c—i—d—s—acid production such as oleic acid.
The authors declare no competing financial interest.
Abbreviations Used
S
—t—r—a—i—n—strain ATCC, 10788 strain AC; S—t—r—a—i—n—strain AS, 2.1389 strain AS; S—t—r—a—i—n—strain CBS, 5490 strain CBS; BCAA, branched -chain amino acid; α-KG, α-ketoglutarate; OAA, oxaloacetate; PEP, phosphoenolpyruvate
Acknowledgments
. Strain AS 2.1389 was a kind gift from Professor Zongbao (Kent) Zhao from Dalian Institute of Chemical Physics in China. We thank NEWRI for support.Supporting Information
S
—u—p—p—o—r—t—i—n—g—i—n—f—o—r—m—a—t—i—o—n—
Supplementary Table S1 lists the retention times of all differential metabolites identified using the NIST library. Figure S1 shows the total ion chromatogram from GC-MS analysis of all three strains on d 12. Figure S2 shows the neutral lipid content in each strain at the end of fermentation by Nile red staining. Figure S3 shows the analysis of total nitrogen in the culture media during fermentation. This material is available free of charge via the Internet at
http://pubs.acs.org.
References
(1) Yang, F.; Hanna, M.; Sun, R. Value-added uses for crude glycerol–— − a byproduct of biodiesel production.
Biotechnol. Biofuels2012,5,1310.1186/1754-6834-5-13.
(2) Dobson, R.; Gray, V.; Rumbold, K.Microbial utilization of crude glycerol for the production of value-added products. J. Ind. Microbiol. B—i—o—t—e—c—h—Biotechnol. 2012,39,217–226.
(3)Zhao, X.;Peng,F.; Du,W.;Liu,C.;Liu,D.Effects of some inhibitors on the growth and lipid accumulation of oleaginous yeastRhodosporidium toruloidesand preparation of biodiesel by enzymatic transesterification of the lipid.
B
—i—o—p—r—o—.— B—i—o—s—y—s—Bioprocess Biosyst. Eng. 2012,35,993–1004.
(4) Wang, Q.; Guo, F. J.; Rong, Y. J.; Chi, Z. M. Lipid production from hydrolysate of cassava starch by
Rhodosporidium toruloides21167 for biodiesel making.—eR—n—e—w—.—Renewable Energy2012,46,164–168.
(5) Zhao, X.; Wu, S.; Hu, C.; Wang, Q.; Hua, Y.; Zhao, Z. K. Lipid production from Jerusalem artichoke by
Rhodosporidium toruloidesY4.J. Ind. Microbiol. B—i—o—t—e—c—h—Biotechnol.2010,37,581–585.
(6)Saenge,C.;Cheirsilp,B.;Suksaroge,T. T.;Bourtoom,T.Potential use of oleaginous red yeastRhodotorula glutinis
for the bioconversion of crude glycerol from biodiesel plant to lipids and carotenoids. Process Biochem. 2011,46,
210–218.
(9)Botes,A. L.Affinity purification and characterization of a yeast epoxide hydrolase. Biotechnol. Lett. 1999,21,
511–517.
(10)Li,Y.;Zhao,Z.;Bai,F.High-density cultivation of oleaginous yeastRhodosporidium toruloidesY4 in fed-batch culture. Enzyme M—i—c—r—o—Microb. Technol. 2007,41,312–317.
(11)Zhu,Z.;Zhang,S.;Liu,H.;Shen,H.;Lin,X.;Yang,F.;Zhou,Y. J.;Jin,G.;Ye,M.;Zou,H.;Zhao,Z. K.—A multi-omic map of the lipid-producing yeast, Rhodosporidium toruloides.Nat. C—o—m—m—Commun.2012,3, DOI: 10.1038/ncomms2112 .
(12) Ribeiro, B. D.; Barreto, D. W.; Coelho, M. A. Z. Technological aspects of β-carotene production. Food B
—i—o—p—r—o—.—Bioprocess Technol. 2011,4,693–701.
(13) Guedes, A. C.; Amaro, H. M.; Malcata, F. X. Microalgae as sources of carotenoids. Mar. Drugs 2011, 9,
625–4—4—644.
(14)Buzzini,P.;Innocenti,M.;Turchetti,B.;Libkind,D.;van Broock,M.;Mulinacci,N.Carotenoid profiles of yeasts belonging to the generaRhodotorula,Rhodosporidium,Sporobolomyces, andSporidiobolus.Can. J. Microbiol.2007,
53,1024–3—1—1031.
(15)Buzzini,P.Production of yeast carotenoids by using agro-industrial by-products.Agro Food Ind. Hi-Tech2001,
12,7–10.
(16) Sakaki, H.; Nakanishi, T.; Tada, A.; Miki, W.; Komemushi, S. Activation of torularhodin production by
Rhodotorula glutinisusing weak white light irradiation.J. Biosci. Bioeng. 2001,92,294–297.
(17) Sakaki, H.; Nochide, H.; Komemushi, S.; Miki, W. Effect of active oxygen species on the productivity of torularhodin byRhodotorula glutinisno. 21. J. Biosci. Bioeng. 2002,93,338–340.
(18)Capozzi,F.;Bordoni,A.Foodomics: A—a new comprehensive approach to food and nutrition. Genes N—u—t—r—i—Nutr.
2013,8,1–4.
(19)Herrero,M.;Simõ,C.;García-Canas,̃ V.;Ibáñez,E.;Cifuentes,A.Foodomics: MS-based strategies in modern food science and nutrition. Mass S—p—e—c—t—Spectrom. Rev. 2012,31,49–69.
(20)Schmidtke,L. M.;Blackman,J. W.;Clark,A. C.;Grant-Preece,P.Wine metabolomics: objective measures of sensory properties of s—e—m—i—l—l—o—n—Semillon from GC-MS profiles.J. A—g—r—i—Agric. Food Chem.2013,61,11957–11967. (21)Cevallos-Cevallos,J. M.;Reyes-De-Corcuera,J. I.;Etxeberria,E.;Danyluk,M. D.;Rodrick,G. E.Metabolomic analysis in food science: a review. Trends Food Sci. Technol. 2009,20,557–566.
(22) Lee, J.; Kim, S.; Namgung, H.; Jo, Y.-H.; Bao, C.; Choi, H.-K.; Auh, J.-H.; Lee, H. J. Ellagic acid identified through metabolomic analysis is an active metabolite in strawberry (‘seolhyang’) regulating lipopolysaccharide-induced inflammation. J. Agric. Food Chem.2013,62,3954–3962.
(23) Xu, J.; Zhao, X.; Wang, W.; Du, W.; Liu, D. Microbial conversion of biodiesel byproduct glycerol to triacylglycerols by oleaginous yeastRhodosporidium toruloidesand the individual effect of some impurities on lipid production. Biochem. Eng. J.2012,65,30–36.
(24)Uckun Kiran,E.;Trzcinski,A.;Webb,C.Microbial oil produced from biodiesel by-products could enhance overall production. Bioresour. Technol. 2013,129,650–4—654.
(25)Turcotte,G.;Kosaric,N.The effect of C/N ratio on lipid production byRhodosporidium toruloidesATCC 10788.
Biotechnol. Lett. 1989,11,637–642.
(26)Kimura,M.;Kobori,C. N.;Rodriguez-Amaya,D. B.;Nestel,P.Screening and HPLC methods for carotenoids in sweetpotato, cassava and maize for plant breeding trials. Food Chem.2007,100,1734–1746.
(27)Wang,M.;Bai,J.;Chen,W. N.;Ching,C. B.Metabolomic profiling of cellular responses to carvedilol enantiomers in vascular smooth muscle cells. PLoS O—N—E—One2010,—510.1371/journal.pone.0015441.
(28)Seiber,J. N.;Molyneux,R. J.;Schieberle,P.Targeted metabolomics: a new section in the journal of agricultural and food chemistry. J. Agric. Food Chem. 2013,62,22–23.
(29) Chatzifragkou, A.; Dietz, D.; Komaitis,M.; Zeng, A. P.; Papanikolaou, S. Effect of biodiesel-derived waste glycerol impurities on biomass and 1,3-propanediol production of Clostridium butyricum VPI 1718. Biotechnol. Bioeng. 2010,107,76–84.
(30)Rodriguez-Amaya,D. B.;Kimura,M.—I;—n—s—t—i—t—u—t—e——,—.I—F—.—P—.—R—.—;—T—r—o—p—i—c—a—l——C,—.—I—.—d—.—A—.—,—HarvestPlus Handbook for Carotenoid Analysis—;. International Food Policy Research Institute (IFPRI):Washington, DC, USA, 2004.
(31)—aF—k—a—s—,—S—.——M; —a—k—r—i—,—A—.——B;—e—l—l—o—u—,—S—.——;—gA—g—e—l—i—s—,—G—.—P—a—t—h—w—a—y—s—t—o— a—e—r—o—b—i—c— g—l—y—c—e—r—o—l—c—a—t—a—b—o—l—i—s—m— a—n—d— t—h—e—i—r—r—e—g—u—l—a—t—i—o—n—.—
M
to aerobic glycerol catabolism and their regulation. In Microbial Conversions of Raw Glycerol; Nova Science Publishers: New York, 2009; pp9−18.
(32)Hu,X.;Li,H.;Tang,P.;Sun,J.;Yuan,Q.;Li,C.GC-MS-based metabolomics study of the responses to arachidonic acid inBlakeslea trispora. Fungal Gen. Biol. 2013,57,33–41.
(33)Popova,A. V.;Andreeva,A. S.Carotenoid-L—i—p—i—d—I—n—t—e—r—a—c—t—i—o—n—s—lipid interactions. Adv. Planar Lipid Bilayers a—n—d— Liposomes2013,17,215–236.
(34) Li, Z.; Ma, X.; Li, A.; Zhang, C. A novel potential source of β-carotene: Eustigmatos cf. polyphem
(Eustigmatophyceae) and pilot β-carotene production in bubble column and flat panel photobioreactors. Bioresour. Technol. 2012,117,257–263.
(35)Fujimoto,T.;Ohsaki,Y.;Cheng,J.;Suzuki,M.;Shinohara,Y.Lipid droplets: a classic organelle with new outfits.
Histochem. Cell Biol. 2008,130,263–7—9—279.
(36)Lamers,P. P.;Janssen,M.;De Vos,R. C. H.;Bino,R. J.;Wijffels,R. H.Carotenoid and fatty acid metabolism in nitrogen-starvedDunaliella salina, a unicellular green microalga.J. Biotechnol.2012,162,21–27.
(37) Rabbani, S.; Beyer, P.; Lintig, J. V.; Hugueney, P.; Kleinig, H. Induced β-carotene synthesis driven by triacylglycerol deposition in the unicellular algaDunaliella bardawil.Plant Physiol.1998,116,1239–1248. (38)Siddiqui,M. S.;Thodey,K.;Trenchard,I.;Smolke,C. D.Advancing secondary metabolite biosynthesis in yeast with synthetic biology tools. FEMS Yeast Res. 2012,12,144–170.
(39) Sperstad, S.; Lutnaes, B. F.; Stormo, S. K.; Liaaen-Jensen, S.; Landfald, B. Torularhodin and torulene are the major contributors to the carotenoid pool of marine Rhodosporidium babjevae (Golubev). J. Ind. Microbiol. B