University Of Southern Queensland
Faculty of Health, Engineering and Sciences
Improving Electricity Network Utilisation with
Distributed Energy Storage Systems
A dissertation submitted by Tony Bonaventure Sunzu
In fulfilment of the requirements of
ENG4111 and ENG4112 Research Project
towards the degree of
Bachelor of Engineering (Electrical and Electronic)
Abstract
Network capacity utilisation is the ratio of the average energy demand to the installed capacity required to meet peak demand. Network capacity utilisation is one of the biggest problems faced by network operators in Australia and around the world. As a response to high peak demands, network operators expand the generation and network capacity. This results in large investments in infrastructure that only operates a couple of hours annually. Investment and operation costs of the underutilised infrastructure are passed on to customers through increased energy prices. Accordingly, there is a need to control peak demand, and distributed energy storage systems hold promise for this application.
The immediate objective of this research project is to improve utilisation of network assets in an urban area with distributed energy storage systems. The NSW network was analysed under both winter and summer conditions to determine the size of the peak demand and the unused network capacity during the off peak period that could be used for charging energy storage systems without creating a peak. The minimum number of households required to be programmed to use energy storage systems during peak periods in order to avoid the network peak demand and the maximum number of households that the network could charge in the off peak period without creating a peak demand were determined. A model was developed to evaluate the effectiveness of distributed energy storage systems on the NSW network. A power flow analysis was conducted to analyse the voltage regulation capabilities of distributed energy storage systems at demand nodes on the network.
University of Southern Queensland
Faculty of Health, Engineering & Sciences
ENG4111/ENG4112 Research Project
Limitations of Use
The Council of the University of Southern Queensland, its Faculty of Health, Engineering & Sciences, and the staff of the University of Southern Queensland, do not accept any responsibility for the truth, accuracy or completeness of material contained within or associated with this dissertation.
Persons using all or any part of this material do so at their own risk, and not at the risk of the Council of the University of Southern Queensland, its Faculty of Health, Engineering & Sciences or the staff of the University of Southern Queensland.
This dissertation reports an educational exercise and has no purpose or validity beyond this exercise. The sole purpose of the course pair entitled “Research Project” is to contribute to the overall education within the student’s chosen degree program. This document, the associated hardware, software, drawings, and other material set out in the associated appendices should not be used for any other purpose: if they are so used, it is entirely at the risk of the user.
Dean
Certification of Dissertation
I certify that the ideas, designs and experimental work, results, analyses and conclusions set out in this dissertation are entirely my own effort, except where otherwise indicated and acknowledged.
I further certify that the work is original and has not been previously submitted for assessment in any other course or institution, except where specifically stated.
Tony Bonaventure Sunzu 0061030337
_______________________________ Signature
Acknowledgements
I would like to thank my supervisor Dr Leslie Bowtell for his continuous guidance and support throughout this research project.
I would also like to thank Mr Andreas Helwig for his valuable and constructive suggestions throughout this research project.
Finally, I wish to thank my beautiful girlfriend Grace, my family and friends for their support and encouragement throughout my study.
Tony Bonaventure Sunzu
Table of Contents
Chapter 1: Introduction ... 1
1.1 Electricity Network Capacity Utilisation ... 1
1.2 Project Aim ... 2
1.3 Project Objectives ... 2
1.4 Overview of the Dissertation ... 3
Chapter 2: Literature Review ... 4
2.1 Introduction ... 4
2.2 Network Capacity Utilisation Issues ... 5
2.2.1 Network Capacity Utilisation ... 5
2.2.2 Causes of Peak Demand ... 5
2.2.3 Effects of Extreme Weather Conditions ... 6
2.2.4 Load Curves for Typical Electricity Grid ... 7
2.2.5 Consequences of Peak Demand ... 9
2.3 Energy Demand Management ... 10
2.4 Types and Features of Energy Storage Technologies ... 11
2.4.1 Energy Storage ... 11
2.5 Energy Storage Systems (ESS) ... 11
2.6 Classification of Energy Storage Systems ... 11
2.6.1 Mechanical Energy Storage Systems ... 12
2.6.2 Chemical Energy Storage ... 18
2.6.3 Electrical and Magnetic Field Energy Storage ... 35
2.6.4 Superconducting Magnetic Energy Storage (SMES) ... 37
2.6.5 Thermal Energy Storage ... 40
2.7 Definitions and Terms ... 41
3.1 Chapter Overview ... 43
3.2 Research and Development Methods ... 43
3.3 Task Analysis ... 44
3.4 Software ... 45
3.5 Assessment of consequential effects and ethical responsibilities ... 46
3.5.1 Sustainability ... 46
3.5.2 Ethical Responsibilities ... 46
3.5.3 Safety ... 47
3.5.4 Risk Assessment ... 47
3.6 Chapter summary ... 48
Chapter 4: Analysis ... 49
4.1 Chapter Overview ... 49
4.2 Ideal System Design Setup ... 49
4.3 Power Demand and Energy Consumption for a Typical Household ... 50
4.3.1 Peak Lopping ... 50
4.3.2 Power Demand Analysis for a Typical Household ... 50
4.3.3 Winter Energy Requirement ... 52
4.3.4 Summer Energy Requirement ... 53
4.4 Network Parameter Assessment ... 55
4.4.1 Network Analysis under Winter Conditions ... 56
4.4.2 Network analysis under summer conditions ... 59
4.5 Effectiveness of Distributed ESS on the NSW1 Network ... 62
4.5.1 Effectiveness During Winter ... 62
4.5.2 Effectiveness during summer... 64
4.6 Network Capacity Utilisation Improvement ... 65
4.6.1 Winter Capacity Utilisation Improvement ... 66
4.7 Power Flow Analysis ... 68
4.7.1 Power Flow Under No -load Conditions ... 69
4.7.2 Power flow under load conditions ... 70
4.7.3 Power Flow with Power Generated by ESS ... 70
4.8 Design of an ESS to Meet Peak Demand Energy Requirements ... 74
4.8.1 Sizing Battery Banks ... 74
4.9 Cost Effectiveness Analysis Using HOMER ENERGY Software ... 78
4.9.1 Assumptions and Model Inputs ... 78
4.10 Simulation Results and Discussion ... 83
4.10.1 Results ... 83
4.11 Payback Period ... 85
4.11.1 Storage system without a photovoltaic system ... 85
4.11.2 Storage System With Photovoltaic System ... 86
4.12 Effectiveness of PV Systems as a Secondary Energy ... 87
4.12.1 Effectiveness of PV systems during winter ... 88
4.12.2 Effectiveness of PV Systems During Summer ... 89
Chapter 5: Results and Performance Evaluation ... 90
5.1 Chapter Overview ... 90
5.2 Main Cause of Network Underutilised Network Capacity ... 90
5.3 Energy Storage Technology ... 90
5.4 Energy Requirement ... 91
5.5 Battery Bank Specifications ... 91
5.6 Network Analysis Results ... 92
5.6.1 Effects of PV Systems ... 94
5.7 Voltage Regulation Results ... 94
5.8 Economic Analysis Results ... 95
5.10 Chapter Summary ... 98
Chapter 6: Conclusions ... 99
6.1 Summary ... 99
6.2 Conclusions ... 99
6.3 Recommendations ... 100
6.4 Future Research and Development ... 100
References ... 101
Appendix A ... 104
Appendix B ... 106
List of Figures
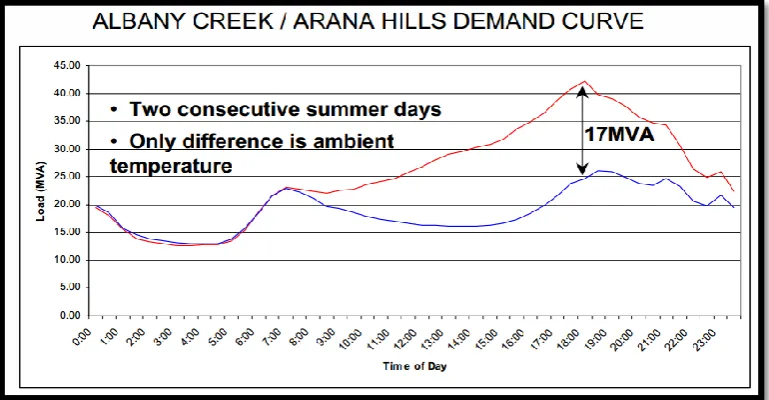
Figure 2.1: Comparison between two consecutive summer days at different ambient
temperatures (Energex, 2014). ... 6
Figure 2.2: Load curves for typical electricity grid... 7
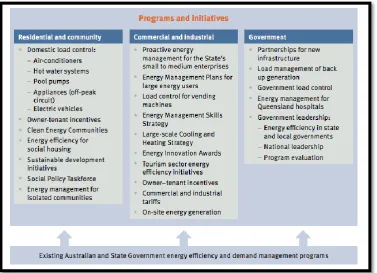
Figure2.3: Existing Australian and State Government energy efficiency and demand management programs (DEEDI, 2011). ... 10
Figure 2.4: Classification of electrical energy storage systems according to energy form ... 12
Figure 2.6: Schematic of an underground CAES ... 14
Figure 2.7: Inside of a flywheel ... 16
Figure 2.8: Flywheel energy storage components... 17
Figure 2.9: The inside of a Lead-Acid battery ... 21
Figure 2.10: Charging and discharging of a lithium-ion battery ... 26
Figure 2.11: Principles of a Li-ion Battery ... 27
Figure 2.12: NaS battery cell design and 50 kW module ... 29
Figure 2-13: Schematic of a Vanadium Redox Flow Battery ... 32
Figure 2.14: Zinc-Bromine cell configuration ... 33
Figure 2.15: Capacitor conduction ... 36
Figure 2.16: Superconducting magnetic energy storage ... 38
Figure 2.17: conceptual design of a superconducting coil ... 38
Figure 2.18: Concentrated Solar Power (CSP) plant with a thermal storage cycle ... 40
Figure 4.1: Ideal set up of an energy storage system ... 49
Figure 4.2: Demand profile for a typical household during winter... 52
Figure 4.3: Demand profile for a typical household during summer ... 54
Figure 4.4: NSW1 Demand on a Typical Winter Day ... 56
Figure 4.5: Winter Network Peak Demand and Available Capacity ... 57
Figure 4.6: NSW1 Demand on a Typical Summer Day ... 59
Figure 4.7: Summer Network Peak Demand and Available Capacity ... 60
Figure 4.9: Effectiveness of Distributed Energy Storage Systems on the NSW
Network during summer. ... 64
Figure 4.10: Voltage regulation by distributed energy storage systems ... 73
Figure 4.11: Hourly Load Profile ... 79
Figure 4.12: Solar Radiation Profile for Sydney (NSW) ... 79
Figure 4.13: System schematic ... 80
Figure 4.14: Simulation results ... 83
Figure 4.15: Simulation results at NSW Solar Bonus Scheme (20c/kWh) ... 84
Figure 4.16: Simulation results under the NSW Solar Bonus Scheme (20c/kWh) .... 85
List of Tables
Table 3.1 : Risk Assessment for a computer ... 47
Table 3.2 : Risk rating. ... 48
Table 4.1 : Power usage for common appliances likely to be used during peak demand times ... 51
Table 4.2 : Network parameters ... 68
Table 4.3 : Node voltages under no load conditions ... 69
Table 4.4 : Node voltages with 100 kVA load ... 70
Table 4.5 : Node voltage with 25 kVA generated by ESS ... 71
Table 4.6 : Node voltages with 40kVA generated by ESS ... 72
Table 4.7 : Node voltages with 50kVA generated by ESS ... 73
Table 4.8 : Battery Bank Specifications ... 78
Table 4.9 : History of feed in Tariff (Ausgrid, 2011) ... 81
Table 4.10 : Grid Input Profile ... 82
Table 5.1 : Energy requirement ... 91
Table 5.2 : Battery Bank Specifications ... 91
Table 5.3 : Summary of the network assessment. ... 93
Table 5.4 : Effects of a 4 kW PV system on the network ... 94
Table 5.5 : Voltage regulation results summary ... 95
Nomenclature
AGM : Absorbed Glass Mat BSS : Battery Storage System
CAES: Compressed Air Energy Storage DLC : Double-Layer Capacitors
DNSPs: Distribution Network Service Providers DoD : Depth Of Discharge
DR : Demand Response
DSM : Demand Side Management ESS : Energy Storage System FES : Flywheel Energy Storage HFB : Hybrid Flow Battery H2 : Hydrogen Storage
LA : Lead Acid Battery Li-Ion : Lithium Ion Batterries
MEPS: Minimum Energy Performance Standards NaNiCl: Sodium Nickel Chloride Battery
NiMH : Nickel Metal Hydride NPC : Net Present Cost
PHS : Pumped Hydroelectric Storage PV : Photovoltaic
RFB : Redox Flow Battery
SMES : Superconducting Magnetic Energy Storage UPS : Uninterruptible Power Supply
Chapter 1:
Introduction
1.1
Electricity Network Capacity Utilisation
Balancing electricity supply and demand is one of the biggest issues faced by power companies in Australia and around the world. The fact that electrical energy is consumed at the same time as it is generated means that supply and demand must be balanced in real time. With an ever increasing peak demand, power electricity suppliers must ensure the grid has the required capacity to meet the demand at all times.
Electricity suppliers use different strategies to ensure energy demand does not exceed supply capacity. This requires installing backup power stations known as peaking power plants, expanding transmission and distribution infrastructure, using demand management strategies etc. This approach solves the problem but leaves power providers with billions of dollars invested in underutilised infrastructure that only operate for a few days a year and energy consumers with increased price of electricity to cover investments and running costs of the underutilised infrastructure . Energy demand varies from time to time and the price of electricity varies accordingly. When energy demand exceeds the average demand, power suppliers are forced to operate peaking power plants or buy more expensive power from other companies to supplement their supply, thus higher price of electricity. During off-peak periods the energy demand is less and the need for costly types of generation is not needed, thus reduced price of electricity.
energy storage systems can be used to store low cost electricity during off-peak periods for use during peak periods when the price of electricity is high.
By reducing the energy demand during peak periods using distributed energy storage systems, the required generation capacity to meet peak demand can be reduced, unnecessary infrastructure expansion can be avoided and the existing network capacity utilisation can be improved.
1.2
Project Aim
The aim of this project is to improve utilisation of network assets in an urban area with distributed energy storage systems.
1.3
Project Objectives
For completion, this project was divided into a number of deliverable outcomes: Research electricity network utilisation issues
Research energy storage technologies
Design an energy Storage System to meet energy requirements Analyse electricity network
Model effectiveness of distributed ESS on the network
Page | 3
1.4
Overview of the Dissertation
This dissertation is organised as follow:
Chapter 2 discusses electricity network capacity utilisation issues and the existing strategies to improve network capacity utilisation. Investigations on existing approaches to peak demand management are to evaluate the effectiveness of these approaches and to recommend a basis to consider a new approach. Types of energy storage technologies are discussed.
Chapter 3 details the methodology used for analysis and simulation required to achieve the goal of this research project.
Chapter 4 discusses, interprets and evaluates the results of this research project. Chapter 5 details the analysis and simulation results of this research project
Page | 4
Chapter 2:
Literature Review
2.1
Introduction
In Australia and around the world, maximising electricity network capacity utilisation is still a big challenge to energy providers. According to Ergon Energy (2013), network utilisation is an important driver of network performance and investment efficiency.
Underutilisation of electricity network capacity is the result of network capacity expansion as response to the increasing peak energy demand. According to DEEDI (2011), the rising network and generation costs affect consumers through higher electricity prices. Despite billions of dollars spent on network capacity expansion, it is still argued not to be the most efficient approach to solve the peak demand problem. According to Productivity commission (2013, p.227), “while much of the recent increase in network capacity appears to be related to peak demand, it is not clear that increased investment was an efficient response”.
According to DEEDI (2011), due to population growth in Queensland, the peak demand capacity is expected to increase from approximately 8,300 MW in 2008/2009 to more than 12,800 MW by 2020 and more than $15 billion in capital infrastructure will be required to be able to keep up with the increase in peak demand.
Different energy management strategies have been used alongside network capacity expansion as response to peak energy demand, however, peak energy demand is still a big threat to energy providers and a financial problem to energy consumers.
Page | 5
2.2
Network Capacity Utilisation Issues
2.2.1 Network Capacity Utilisation
Network capacity utilisation is defined as the ratio of the average demand to the installed capacity required to meet peak demand. Different measures are used to determine network capacity. According to Productivity Commission (2013), network capacity is measured by the product of total installed transformer capacity (in MWA) and the aggregate length of network lines (in circuit km). When comparing network performances, the ratio of network capacity to peak load is used as an indicative measure.
According to Ergon Energy (2013), network capacity utilisation is an important driver of network performance and investment efficiency.
2.2.2 Causes of Peak Demand
The need for energy is not the same throughout the day. There are times of the day when people’s need for energy is higher than other times. According to Energy Action (2014), “peak demand refers to the highest amount of electricity being consumed at any one point in time across the entire network”. Peak demand results from many users using a lot of electricity at the same time. The peak demand varies from hour-to-hour, season to season and year to year.
Daily Peak Demand
Page | 6 Network Peak Demand
Network peak demand occurs only a few times a year. Major spikes in energy demand result from extreme weather conditions when a much higher number of households and offices use high-energy appliances such as air-conditioners to cool down or warm up homes and workplaces at the same time as other daily appliances (Energex, 2014).
2.2.3 Effects of Extreme Weather Conditions
[image:20.595.114.499.375.575.2]When extreme weather conditions occur, energy demand becomes very high and major spikes are observed due excessive use of air conditioners at work places and in households. As indicated on Figure 2.1, the difference between the average demand of three hottest days and the average demand of a full year is very significant.
Page | 7 2.2.4 Load Curves for Typical Electricity Grid
Figure 2.2: Load curves for typical electricity grid (World Nuclear Association, 2014).
Base Load
Base load is the amount of electricity that is demanded and produced at any time. It relates to the minimum level of electricity demand on an electrical supply system over 24 hours. Even though the electricity demand drops during the late evening and early morning, it never goes a certain base level. Grid operators must ensure the grid is able to supply the base load throughout the year, even during the lowest demand periods. Normally base load plants operate continuously and only stop for repair or when maintenance is needed (New York AREA, 2008).
Page | 8 When electricity demand goes beyond the base load level, intermediate or peak power plants are used to supply the additional demand. For most power systems, base load power is usually 35-40 percent of the maximum load during the year (New York AREA, 2008).
Intermediate Load
Intermediate load is the middle load. Intermediate load plants, also known as load following plants, adjust their power outputs as demand for electricity fluctuates throughout the day. These types of plant are easier and faster to regulate. They are in-between base load and peaking plants in efficiency, speed of start-up and shutdown, construction cost, cost of electricity and capacity factor (Global Energy Network Institute, 2012).
Intermediate load plants generally operate 30 to 60 percent. Wind and solar can be considered intermediate power sources. Due to their nature, both sources are intermittent due to their dependency on weather conditions. Even though wind and solar are not always available when needed, they can still play a big role as intermediate sources and help reduce the need for fossil fuel intermediate load plants during high demand days (New York AREA, 2008).
Peak Load
Peak load related to high electricity demand that results from unexpected extreme weather conditions such as very hot days during winter or very cold days during winter. These events lead to excessive use of air conditioners on top of normal appliances. When the system demand is high, peak load power plants are used. These types of plants have faster response times, normally within seconds to a few minutes. They are used as response to changes in electrical demand as they can vary the quantity of electrical output fairy quickly.
Page | 9 15 percent of the time and use more expensive fuel, resulting in a very expensive operational cost (New York AREA, 2008).
2.2.5 Consequences of Peak Demand
According to Government of South Australia (2014), historically, infrastructure expansion such as building additional power stations or upgrading network capacity has been used as the primary response to increasing peak demand.
Productivity Commission (2013) argues that peak demand is the key driver of investment in generation and network capacity.
To avoid damages that may result from energy demand exceeding network capacity such as damage to equipment and loss of network performance, which can result in partial or full system failure, utilities must ensure the network capacity is able to handle the energy demand at all times (Productivity Commission, 2013).
The additional generation and network capacity requires large investments but only operates on maximum peak demand days, which add up to a couple of days annually. According to Productivity Commission (2013), in New South Wales the infrastructure used to support the grid during high peak demand periods only operate for less than 40 hours a year, which is less than 1% of time, but accounts for about 25 percent of retail electricity bills. To cover investment and running costs of these assets, costs are passed on to consumers through increased electricity prices.
Page | 10
2.3
Energy Demand Management
Demand management involves administration of when and how electricity is used to ensure a reliable supply. The purpose of demand management is to offer potential solutions to the problem of peak demand. This is achieved by encouraging energy consumers to reduce their energy usage during peak hours and, where possible, shift some energy consuming activities to off –peak hours such as night times and weekends (Productivity Commission, 2013).
When peak energy demand is lowered, the need to invest in infrastructure expansion for additional generation and network capacity in order to cope with a higher peak demand is also reduced or avoided. Keeping the peak energy demand levels low is important to efficiently expand the network and keep electricity prices reasonable (Western power, 2014).
[image:24.595.114.492.406.679.2]Figure 2.3 shows the existing Australian and Stage Government energy efficiency and demand management programs.
Page | 11
2.4
Types and Features of Energy Storage Technologies
In this section the types of energy storage technologies and their features are discussed. Energy storage technologies are classified according to the form of energy used and an overview of each storage technology is given.
2.4.1 Energy Storage
According to Akhil et al. (2013), energy storage mediates between variable sources and variable loads. If energy is not stored, energy generation must equal energy consumption. Energy storage enables energy generated at one time to be used at another time.
2.5
Energy Storage Systems (ESS)
Energy Storage Systems are devices that store energy when energy production exceeds energy demand and used when energy demand is high. Energy generation and consumption happen in real time. To avoid wastage of the excess energy produced, a storage system is required. Moreover, renewable energy sources such as wind and solar depend on weather conditions and time of the day.
To be able to take full advantage of renewable energy sources, energy produced by renewable sources needs to be stored whenever it is available so that it can be used when it is needed (Carnegie et al., 2013).
2.6
Classification of Energy Storage Systems
Page | 12
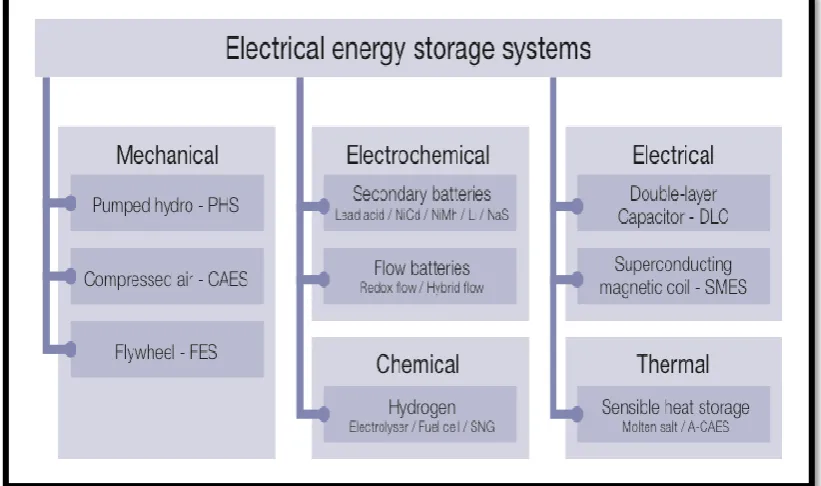
Figure 2.4: Classification of electrical energy storage systems according to energy form (IEC, 2011).
2.6.1 Mechanical Energy Storage Systems
In mechanical energy storage, different methods are used to store energy. According to (IEC, 2011), the most common mechanical storage systems are Pumped Hydroelectric Storage (PHS), Compressed Air Energy Storage (CAES) and Flywheel Energy Storage (FES).
2.6.1.1 Pumped Hydro Storage (PHS)
Lifetime and Efficiency
Page | 13
Advantages
The advantages of pumped hydro storage systems include: very long lifetime, practically unlimited cycle stability of the installation, fast response time, lower emissions than fossil fuel-fired generators, they are considered as renewable energy sources (Carnegie et al. 2013).
Disadvantages
Disadvantages of pumped hydro storage systems include: dependence on topographical condition and large land use, water availability, environmental impact such as forest removal for large systems, disturbance of the surrounding watersheds and ecosystem (Carnegie et al. 2013).
Applications
Pumped hydro storage systems are used for energy management via time shift, control of electrical network frequency; provide reserve generation, and level fluctuating output of intermittent energy sources (Carnegie et al. 2013).
2.6.1.2 Compressed Air Energy Storage (CAES)
Concept
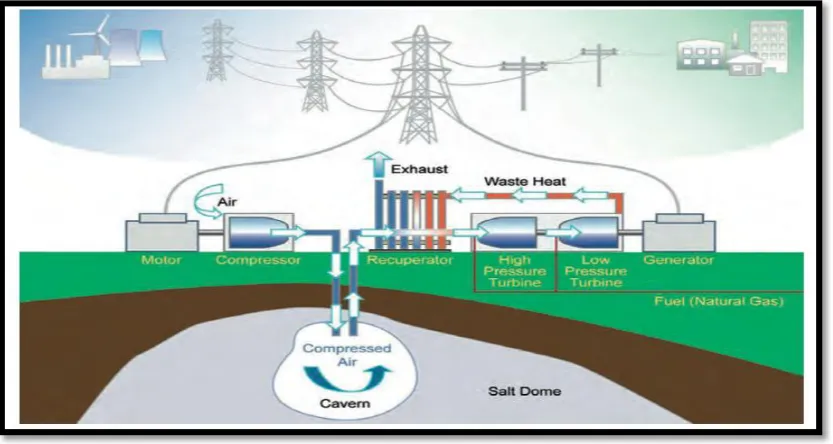
Compressed Air Energy Storage (CAES) is a system used to store energy during peak period for use during-off peak period. The simple version of the system uses a compressor to store energy as compressed air in an air-tight vessel. To covert the stored energy back to electricity, the cool and pressurized air is reheated and mixed with fuel, passed through an expansion turbine where it is combusted to drive an electric generator. Typical underground options for storage include: -caverns and abandoned mines. Compressed Air Energy Storage Systems exist in two different types - bulk and small.
Page | 14 course of 10 to 30 hours. This size of CAES is suitable for regulation control and combination of load shifting, regulation control and spinning reserve.
Smaller CAES are installed above the ground and have capacities in the order of 10 to 20MW with shorter discharge time, which is typically less than 5 hours. This size of CAES is suitable for both short and long duration time shift applications. Depending on different factors such as sitting, construction, and system design, both types of CAES systems’ capacities and discharge time will vary.
[image:28.595.114.531.392.614.2]Three different major technologies are used in compressed air energy storage systems. This includes –diabatic, the most developed of the three and uses heat added during the expansion period in order to increase the system power capacity, adiabatic, which retains the heat produced by compression then returns it to the air when the fair is expanded for power generation, near-isothermal, which keeps the air temperature nearly constant by compressing and expanding slowly (Carnegie et al. 2013).
Figure 2.6: Schematic of an underground CAES (IEC, 2011).
Lifetime and efficiency
Page | 15 energy storage systems, the efficiency is estimated between 73 and 89 percent. For diabatic system, the efficiency drops as the result of using energy in the compression and heating process. Efficiency can also be affected if air escapes into surrounding formations and pressure is lost (Carnegie et al. 2013).
Applications
Compressed Air Storage Systems are mainly used for the following applications: load shifting, regulation control and spinning reserve.
Advantages
Advantages of CAES include: high reliability and large capacity (IEC, 2011).
Disadvantages
Disadvantages of CAES include: geographic limitation for large subterranean CAES, low round-trip efficiency and safety concerns due to high pressures necessary for bulk CAES, the combination of leftover, flammable hydrocarbons, heat from the compression process, and oxygen creates a potential for explosion (Carnegie et al. 2013).
2.6.1.3 Flywheel Energy Storage (FES)
Concept
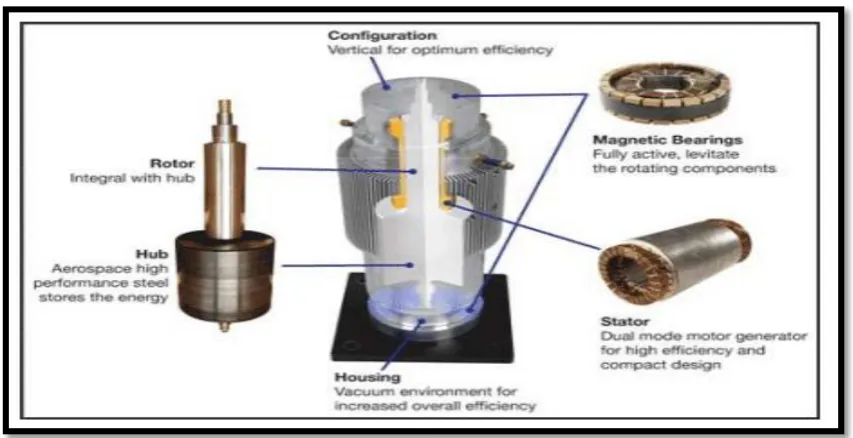
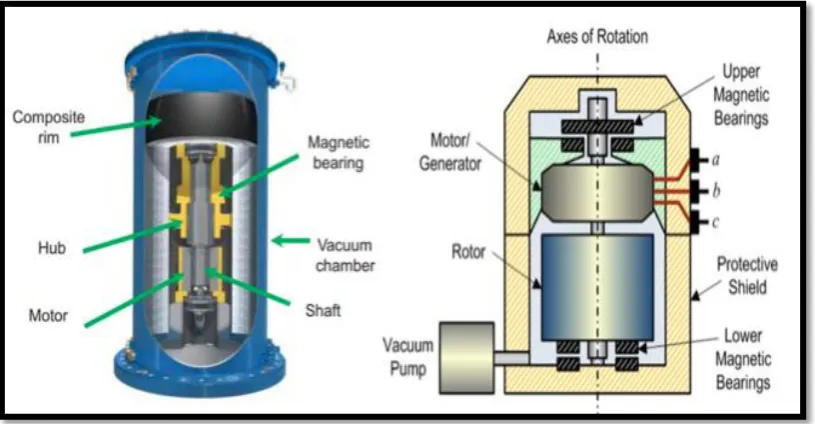
Page | 16 the amount of energy stored in the system. Discharging is achieved by allowing the momentum to power the motor-generator and the rotational energy is converted back to electricity (IEC, 2011). The inside of a flywheel is shown in figure 2.7.
Figure 2.7: Inside of a flywheel (Global Energy Network Institution, 2012).
A modern single flywheel can achieve a spinning speed of up to 16,000 rpm and supply a capacity up to 25kWh, which can be absorbed and injected almost instantly (Global Energy Network Institution, 2012).
Page | 17
Figure 2.8: Flywheel energy storage components (Carnegie et al. 2013).
Lifetime and efficiency
One of the advantages of flywheels is their longer lifetime compared with other energy storage systems. Flywheels can last decades with little or no maintenance. Commercial flywheel energy storage units have a lifecycle of up to 100,000 charge-discharge cycles. On top their long life times, flywheels also have high energy densities (100-130Wh/kg) and large maximum power output. Flywheels have a round trip efficiency ranging between 70 and 80 percent and have standby losses of 1 to 2 percent of the rated power output (Carnegie et al.2013).
Advantages
Page | 18
Disadvantages
Despite all the advantages, flywheels have a high level of self-discharge and suffer from low current efficiency (IEC, 2011). According to Carnegie et al. (2013), operating noise may also be a problem on sitting of a flywheel storage system.
Application
Flywheel energy storage systems were first used to smooth steam engine generation in large power electric power stations. The technology has been used in power supply for power quality maintenance and reliability. The storage system regulates frequency and provides protection against transient interruptions. Flywheels were first considered for energy storage in 1960s.
The flywheel storage system with a capacity of providing 340MW for 30 seconds is the largest and used for f in Japan. Flywheel systems with capacities ranging between 100kW to 2MW with discharge times of between 5 to 10 seconds are used for power applications.
Flywheel systems with the capacity to store between 0.5 to 1kWh of energy are used for energy applications. This technology is a common choice for uninterruptible power supply and power quality applications due to its instantaneous response time (Carnegie et al.2013).
2.6.2 Chemical Energy Storage
Page | 19 2.6.2.1 Hydrogen (H2)
Concept
This technology uses hydrogen as the energy carrier. The production of hydrogen is achieved by using excess electricity to produce hydrogen via water electrolytes. This storage system is made up of a tank, an electrolyser and a fuel cell. The tank is used for hydrogen storage; the electrolyser is an electrochemical converter and is used to split water into hydrogen and oxygen with the help of electricity.
Hydrogen can be stored using different approaches. This can be in the form of a gas under high pressure, a liquid at very low temperature, chemically boded in complex hybrids, or absorbed on metal hybrids. When electricity is needed, hydrogen and oxygen are joined together into the fuel cell for an electrochemical reaction to take place. This reaction produces water and releases heat and electricity is generated (IEC, 2011).
Lifetime and Efficiency
The overall efficiency of AC-AC is about 40 percent (IEC, 2011).
Advantages
Large scale storage, volumetric storage density, scope for expansion (Hydrogen and electricity storage, n.d).
Disadvantages
Expensive, weight and volume, less efficient, inadequate durability, long refuelling times (Fuel from the water, 2014). Other disadvantages include: energy balance, C02
Page | 20
Applications
For peaking plants (for gas and steam turbines with power of up hundreds of MW), could be used as peaking plants, stationary application and industrial applications (IEC, 2011). Other applications include: transportation (Fuel from the water, 2014).
2.6.2.2 Electrochemical energy storage
When charging, electrochemical energy storage systems convert electrical energy into chemical energy. This technology consists of two different technologies- electrochemical batteries and electrochemical capacitors (Carnegie et al. 2013).
2.6.2.3 Electrochemical batteries
According to Carnegie et al. (2013), electrochemical batteries exist in three different extensive categories. This includes: conventional, high temperature, and flow batteries. This section discusses the different categories of electrochemical batteries.
Conventional batteries
Conventional batteries are made of cells with two electrodes and electrolyte which are sealed in a container. This technology includes: Lead acid, Nickel-Cadmium, and Lithium-Ion (Carnegie et al. 2013).
I. Lead-Acid battery (LA)
Concept
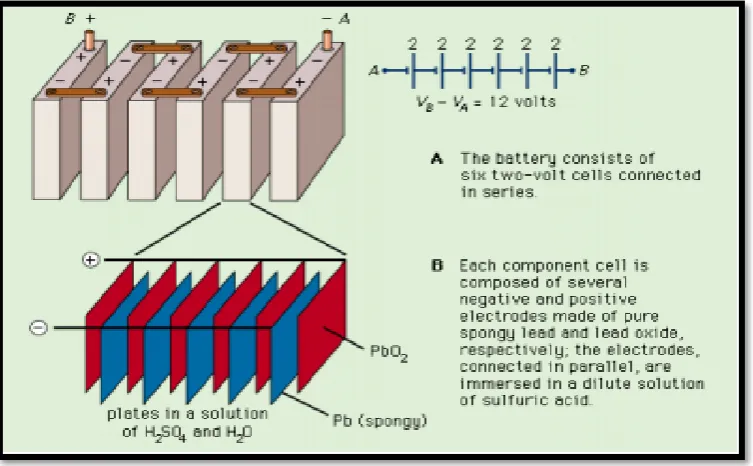
Page | 21 of vented lead acid batteries are: starting, lighting, and ignition (SLI); deep-cycle and stationary. The subcategories of valve-regulated lead acid batteries are: absorbed glass mat (AGM) regulated lead acid batteries and gelled electrolyte valve-regulated lead acid batteries. Lead acid batteries have a nominal voltage of 2V and a round trip efficiency ranging between 75 and 85 percent (Carnegie et al. 2013). The inside of a Lead-Acid is shown in Figure 2.9.
Figure 2.9: The inside of a Lead-Acid battery (Global Energy Network Institution, 2012).
Lifetime and efficiency
The typical lifetime of lead acid batteries varies between 6 to 15 years with a lifecycle of 1500 cycles at 80 percent depth discharge. The cycle efficiency of lead-acid batteries is between 80 percent and 90 percent .The SLI flooded lead lead-acid batteries are not relatively durable and last between 5 and 7 years (IEC, 2011).
Page | 22 flooded lead acid batteries are the strongest in this subcategory with a life expectancy ranging between 15 and 30 years. Absorbed glass mat valve-regulated lead acid batteries and gelled electrolyte valve-regulated lead acid batteries have lifetime ranging between 5 and 10 years (Carnegie et al. 2013).
Advantages
The advantages of lead acid batteries include: low cost, simple to manufacture, reliable and well-understood technology, low self-discharge (among the lowest in rechargeable batteries), low maintenance requirements (no memory, no electrolyte to fill), can provide high discharge rates (Battery University, 2014).
Disadvantages
Lead-acid batteries have low specific energy and power, short lifecycle, high toxicity, self-discharge, sensitivity to temperature, sulfation, hydration, and degradation. Valve-regulated lead acid batteries are sensitive to temperature, overcharge and discharge, corrosion and water loss .Other disadvantages of lead acid batteries include: cannot be stored when discharged, only suitable for standby use where only occasional deep discharge is needed, transportation limitations due to environmental concerns for flooded lead acid batteries regarding spillage in case of an accident (Carnegie et al. 2013).
Application
Lead acid batteries were first used in 1870s in central electric plants for load levelling and peaking (Carnegie et al. 2013).
Page | 23 The SLI subcategory of flooded lead acid batteries is best suited for short term power quality applications, grid angular stability and grid voltage stability. Deep-cycle flooded lead acid batteries are best suited for deep discharge applications. Stationary flooded lead acid batteries are best suitable for power supply for controls and switching operations, for storing standby emergency power in utility substations, for use in power generation plants, for telecommunication systems, for grid frequency stability and for combined applications. Valve-regulated lead acid batteries are best suitable for uninterruptible power supplies (Carnegie et al. 2013).
II. Nickel cadmium (NiCd) and other Nickel electrode batteries
Concept
Nickel cadmium is a type of rechargeable battery that uses nickel oxide hydroxide and metallic cadmium as electrodes. This type of batteries is known as dry cell batteries. Nickel based batteries perform better than lead acid batteries. They have a higher power delivery capabilities, higher energy density, higher lifecycle, more reliable and perform better even at low temperatures (IEC, 2011).
When charging, Nickel cadmium batteries allow conversion of electrical energy to chemical energy. When discharging, the stored chemical energy is converted back to electrical energy (Bellis, 2014).
Nickel cadmium batteries provide a large battery systems version that use vented NiCd batteries and are currently only used for stationary purposes in Europe and are not available for customer use (IEC, 2011).
In the Nickel based batteries, only two have utility scale energy storage demonstrations or commercial installations: Nickel- cadmium and Nickel-iron. Nickel cadmium is still the most preferred for utility energy storage applications (Carnegie et al. 2013).
Page | 24 preferred for use as backup power supply where continuous charging is not a problem (The Nickel Ion Battery Association, 2014).
Nickel metal hydride batteries (NiMH) were developed with the intention to replace Nickel cadmium batteries. They come with all the positive features of Nickel cadmium batteries except a much lower maximum nominal capacity compared to other battery types such as lead acid and nickel cadmium batteries (IEC,2011).
Lifetime and efficiency
Nickel cadmium batteries have a lifecycle of up to 1000 charge/discharge cycles (Battery University, 2014). Nickel ion batteries have a lifetime of 30-100 years and charge/discharge efficiency ranging between 65 percent and 85 percent (The Nickel Ion Battery Association, 2014). According to Carnegie et al.( 2013), pocket plate industrial nickel cadmium batteries have lifecycle ranging between 800 and 1,000 cycles, sintered-plate nickel cadmium batteries can stand up to3,500 both at 80 percent depth of discharge.
Advantage
The advantages of Nickel cadmium batteries include: higher energy density, and high power delivery capabilities, hardness, reliable, longer lifecycle, fast and simple charge can be recharged even at low temperatures, easy to store and transport and exist in different sizes and performance options (Battery University, 2014). Nickel ion batteries are robust, can be overcharged for decades without damage, can be left discharged for years and ready for reuse whenever needed, ability to withstand vibrations, high temperatures and physical stress.
Disadvantage
Page | 25 newer systems, memory effect and high self-discharge rate (Battery University, 2014).
Applications
Nickel cadmium batteries are more suitable where long lifetime, high discharge rate, and economical price are important. The main applications are for: two-way radios, biomedical equipment, professional video cameras and power tools (Battery University, 2014).
Nickel ion batteries have been used in European mining operations and are being reviewed for possible use in modern electric vehicle applications; wind and solar power systems .They are also being used in Australia for solar homes (The Nickel Ion Battery Association, 2014).
III. Lithium ion batteries (Li-Ion)
Concept
Lithium-ion batteries store energy by allowing lithium ion to flow from the positive oxide electrode to the negative graphite electrode. Energy is released by reversing the flow of lithium ions (Carnegie et al. 2013).
Page | 26 During the charging process, the lithium ions pass through the micro-porous separator into spaces between the graphite, which allows them to gain an electron from the external power source. During the discharging process, a current is produced as the lithium atoms situated between graphite release their electrons again, which moves over the external circuit to the anode (Global Energy Network Institution, 2012).
[image:40.595.114.533.263.500.2]The charging and discharging processes of a lithium battery is shown in figure 2-10.
Figure 2.10: Charging and discharging of a lithium-ion battery (Global Energy Network
Institution, 2012).
Although this technology began in 1912, with the first commercially available non-rechargeable lithium ion battery released in early 1970s, it was not until around 2000 that lithium ion batteries made big changes. Despite being a much less mature technology compared to lead acid batteries, it has become the most important when it comes to portable and mobile applications due to considerable advantages over competing technologies.
Page | 27 three times that of the NiCd. Lithium ion battery technology is the fastest growing and the most promising battery chemistry (Battery University, 2014).
Li-ion battery cells have a nominal voltage of 3.7V.This means less cells are needed to produce the same power output as many other batteries. Multiple demonstrations are being carried out for utility functions (Carnegie et al. 2013).
Figure 2.11: Principles of a Li-ion Battery (Akhil et al., 2013).
Lifetime and Efficiency
Li-Ion batteries have a round trip efficiency ranging between 85 and 95 percent. The lifetime of Li-Ion is expected to range between 2,000 and 3,000 cycles or 10 to 15 years (Carnegie et al. 2013).
Page | 28
Advantages
Advantages of Li-Ion batteries include: high energy density, higher voltages per cell (3.7 V compared with 2V for Lead-Acid), low energy loss (about 5% per month), lithium and graphite are available in large amounts, cycling tolerance, low weight, and low maintenance requirements (Global Energy Network Institution, 2012).
Disadvantages
Advantages of Lithium batteries include: fragile, requires a protection circuit to maintain safe operation, subject to ageing even if it is not in use, transportation restrictions for large quantities, expensive to manufacture, not fully mature, very sensitive to high temperatures (Battery University, 2014).
Other disadvantages include: very expensive, full discharge affects the lifetime (Global Energy Network Institution, 2012).
Applications
Lithium ion batteries are mostly used in consumer electronics such as laptops, mobile phones, electric cars and electric bicycles (IEC, 2011).
IV. Sodium Sulfur Batteries (NaS)
Concept
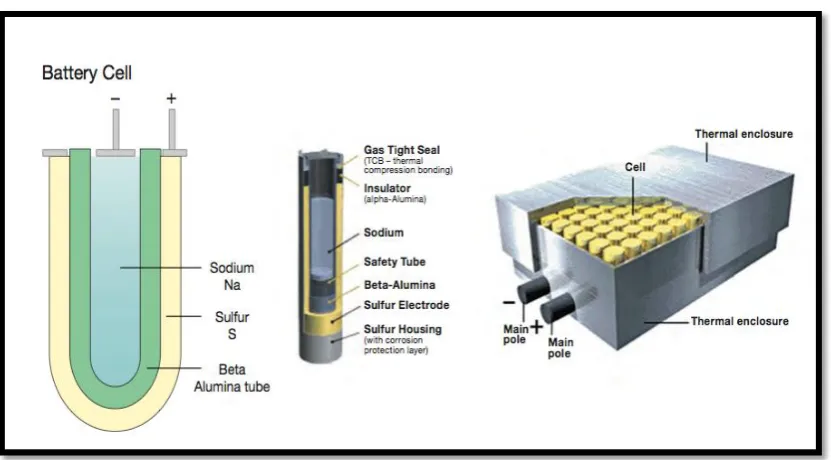
Sodium Sulfur Batteries were developed in the 1960s. The technology uses molten sulphur as the positive electrode and molten sodium as the negative electrode (Energy Storage Association, 2014).
Page | 29 been carried out. According to NGK (2014), the prospect of commercial utilisation has now been finalised.
Figure 2.12: NaS battery cell design and 50 kW module (Akhil et al., 2013).
Lifetime and Efficiency
NaS batteries normally have lifecycle of about 4,500 cycles and a round trip efficiency of about 75 percent. NaS batteries have discharge time ranging between 6 to7.2 hours (IEC, 2011). According to NGK (2014), the life expectancy of NaS batteries is 15 years. NaS batteries have power out ranging from 360kW to tens of MWh. The nominal discharge power of NaS batteries ranges from 50 kW to 100MW.
Advantages
Page | 30
Disadvantages
According to IEC (2014), heat source is required to maintain operation temperatures. Carnegie et al. (2013), argue that NaS batteries must operate at extremely high temperatures and this makes them a safety hazard because they can explode when in contact with water, and they are toxic and relatively expensive for grid-scale batteries.
Applications
NaS batteries are used in: combined power quality and time shift applications with high energy density, peak shaving, grid stabilisation (IEC, 2011). According to Carnegie et al.(2013), NaS batteries can be used for long duration energy storage, load levelling, arbitrage, emergency power supply, and renewable output smoothing. According to NGK (2014), grid-scale NaS batteries are expected to function as a power station to charge electric power in the base power source at low demand and discharge it at peak demand.
V. Sodium Nickel Chloride Batteries (NaNiCl)
Concept
Sodium Nickel Batteries are also known as the ZEBRA (Zero Emission Battery Research). The technology used in NaNiCl batteries is quite similar to NaS batteries. Both technologies are molten sodium based. The positive electrode is nickel chloride and the negative electrode is molten sodium (Carnegie et al. 2013).
Page | 31
Lifetime and Efficiency
According to Eurobat (2013), NaNiCl batteries have a lifecycle of up to 2,000 cycles at a depth of discharge of 80 percent and have a lifetime of 15 years. The round trip efficiency of ZEBRA batteries ranges between 85 and 90 percent.
Advantages
Advances of NaNiCl batteries include: no needs of air conditioning, high energy density, long lifecycle, long calendar life, no need for maintenance, remote monitoring of the systems, zero emission, not toxic, easily recyclable (Eurobat, 2014). Other advantages include: quick response time, tolerance of overcharge/discharge and high tolerance of short circuit (Carnegie et al. 2013).
Disadvantages
Disadvantages of ZEBRA batteries include: expensive, suitable for large capacity batteries only (>20kWh), limited size and capacity choices, only produced by one company in the world, high operating temperature, and needs preheating to raise the temperature up to 270 degrees Celsius for operation, which takes up to 24 hours if the battery is cold, uses up to 14 percent of its own capacity daily to keep the temperature at a good level when not in use (Electropaedia, 2014).
Applications
Page | 32 VI. Flow Batteries
Concept
[image:46.595.115.530.408.637.2]A flow battery is an electrochemical storage device that can be recharged by putting in fresh electrolyte to replace the used electrolyte if no power source is available. According to Carnegie et al. (2013), flow batteries consist of two external electrolyte tanks that are used to store electrolyte material. Flow batteries have the ability to separate power and energy, which is a special function that separates flow batteries from other electrochemical storage systems (Energy Storage Association, 2014). According to IEC (2011), the capacity of flow batteries depends on the size of the storage tanks. Flow batteries exist in different classes: redox, hybrid and membraneless (Energy without Carbon, 2014). Redox flow batteries (RFB) hold the ability to separate special function of separating power and energy.
Page | 33 According to Energy Storage Association (2014), the name Redox refers to chemical reduction and oxidation reactions that are used to store energy in liquid electrolyte solutions. Recharging can be easily achieved by pumping out the discharged electrolyte and replacing it with charged electrolyte. The easy charging of a redox battery has allowed it to put under consideration for mobile applications (IEC, 2011). Vanadium redox flow battery differs from other redox flow batteries as it uses vanadium in both tanks, preventing it from cross-contamination degradation, which is a big problem with other redox flow batteries (Wang, 2012).
Figure 2.14: Zinc-Bromine cell configuration (Akhil et al., 2013).
Hybrid flow batteries (HFB) contain a single or a number of electro-active components placed as a solid layer. The battery cell of hybrid flow batteries encloses one battery electrode and one fuel cell electrode (Carnegie et al. 2013). Examples of hybrid flow batteries include: Zinc-Bromine (Zn-Br) flow battery and Zinc-Cerium (Zn-Ce) flow battery (IEC, 2011).
Page | 34 volts and operates at room temperature, ranging between 25 and 50 degrees Celsius (Carnegie et al. 2013).
Lifetime and Efficiency
At 1,000 cycles a year, a vanadium redox battery is expected to last between 10 to 15 years and can be extended up over 20 years through pump and stack replacement. The round efficiency of a vanadium redox battery ranges between 70 and 90 percent. Depending on the system design, Zinc Bromine flow batteries energy efficiency can be between 70 and 80 percent with a lifetime of around 6,000 hours, which is about 2,000 cycles when the system is continuously operated at 100 percent depth of discharge (Carnegie et al. 2013).
Advantages
The advantages of a Redox battery includes its very high power output (tens of kilowatts), fast recharge by replacing spent electrolyte, long life due to replacement of electrolyte, can be fully discharged , uses non toxic materials, very quick response time (Carnegie et al.2013). Other advantages include: the capacity can be easily increased by adding more solution, cost per kWh decreases as storage capacity increases, underground electrolyte tanks can be used to reduce space requirement (NewSouth Innovations, 2014).
Disadvantages
Page | 35
Applications
Flow batteries are a good choice for applications that require energy for more than 5 hours due to cost efficiencies with large amounts of fairly inexpensive electrolyte material. Vanadium redox batteries are suitable for utility applications where long discharge durations with rated power ranging from 100 kW to 10MW is required. This includes: load shifting, renewable time shifting, fluctuation suppression, forecast hedging, spinning reserve and power quality. Zn-Br flow batteries are suitable for both energy and power applications such as peak shaving, load following and renewable time shifting (Carnegie et al. 2013).
Table2- 9 indicates capital and operating costs of a Vanadium redox battery.
2.6.3 Electrical and Magnetic Field Energy Storage
In Electrical energy storage, energy is stored using electric field. This technology uses capacitors, super capacitors and superconducting magnetic energy storage to store energy (Wu, 2012). Unlike battery storage systems, electrical and magnetic field energy storage systems store energy by generating an electrical field between two parallel conductor plates. According to Carnegie et al. (2013), the surface area of the conductor plates and gap between them are the determining factors of how much energy can be stored in a capacitor.
2.6.3.1 Double-layer capacitors (DLC)
Concept
Page | 36
Figure 2.15: Capacitor conduction (Carnegie et al. 2013).
Lifetime and Efficiency
Double-layer capacitors have a lifetime of up to 1,000,000 cycles or 10 years of operation. The efficiency of double-layer capacitors is typically around 90 percent.
Advantages
Advantages of double-layer capacitors include: nearly unlimited cycle stability, extremely high power capability, higher energy storage capability, very fast charging and discharging rates, durable, no maintenance required, long lifetime, can operate over a range of temperatures, resilient to climate changes (IEC,2011).
Disadvantages
Page | 37
Application
Double-layer capacitor is suitable for applications with a large number of fast charge and discharge cycles. They are not suitable for long-term storage due to high self-discharge rate, low energy density and high investment costs. They have been used in consumer electronics, power electronics, uninterruptible power supply to bridge short voltage failures, as a buffer system for acceleration and process and regression braking in electric vehicle (potential) (IEC,2011). Other applications include: power quality, intermittent renewable fluctuation suppression (Carnegie et al. 2013).
2.6.4 Superconducting Magnetic Energy Storage (SMES)
Concept
Superconducting Magnetic Energy Storage uses a superconducting coil to store energy in the form of a magnetic field surrounding the coil, which is made of a superconductor. This type of storage system consists of three main components: a coil, a power conditioning system (PCS) and a cooling system. Generally, some materials lose their electric resistance at very low temperatures and become superconducting. This is the principle used in superconducting magnetic energy storage systems. In this case, energy can be stored with very minimum loss (practically 90-95 percent efficiency).
Page | 38
Figure 2-16: Superconducting magnetic energy storage (Carnegie et al. 2013).
For energy storage, the superconducting coil temperature is kept at a temperature below its superconducting critical temperature. In principal, a superconducting magnetic energy storage system can be able to stored energy independently as long as the cooling system is operational, but longer storage times are limited by the energy demand of the refrigeration system (IEC, 2011). Figure 2.17 shows the conceptual design of a superconducting coil.
Page | 39
Lifetime and Efficiency
The round-trip efficiency of superconducting magnetic energy storage is above 95 percent. The life expectancy does not depend on the number of cycles (Carnegie et al. 2013).
Advantages
The advantages of super magnetic energy storage include: very quick response time (power is available almost instantaneously), high overall round-trip efficiency (85%-90%), very high power output (IEC, 2011). According to Carnegie et al. (2013), other advantages include: life expectancy is independent of duty cycle, high reliability, permanent storage (no standby loss), lifetime is not affected by depth of discharge.
Disadvantages
Disadvantages of superconducting magnetic storage include: refrigeration energy requirements, requires large magnetic field (Carnegie et al. 2013). According to Global Energy Network Institute (2012), SMES) have high energy losses (~12% per day), very expensive in production and maintenance, reduced efficiency due to the required cooling process.
Applications
Page | 40 2.6.5 Thermal Energy Storage
Concept
Thermal energy storage involves different technologies. Thermal energy storage technologies allow temporary storage or removal of heat for use at a different time (Energy Storage Association, 2014).
Technologies used in thermal energy storage include: storage of sensible heat, storage of latent heat, and thermo-chemical and absorption storage. Liquid or solid materials can be used as storage medium. This includes: water, thermal oil, concrete or ground, which are the determining factors of the capacity of the storage system (IEC, 2011).
[image:54.595.115.526.482.692.2]The system uses a receiver to reflect the sunlight onto a heating chamber used to heat liquid molten salt. Heated liquid molten salt is then stored into the heated fluid storage tank. When electricity is needed, the stored heated salt is then pumped out to a steam-generator to produce superheated steam which is used to power a steam turbine or generator (IEC, 2011).
Figure 2.18: Concentrated Solar Power (CSP) plant with a thermal storage cycle (Global Energy
Page | 41 The most common form of thermal energy storage is ice energy storage, where off-peak electricity is used to freeze water into ice and the frozen ice is used during off-peak period for air conditioning system cooling as a way to avoid the need for grid power for air conditioning during peak demand periods. In this document, the focus will be on the molten salt thermal energy storage technology. Molten Salt thermal energy storage technology allows the use of thermal energy retained using a solar tower to generate electricity when the sunlight is not available. The system uses two tanks: a cool tank and a heated fluid tank (Carnegie et al. 2013).
Applications
Disadvantages include: risk of liquid salt freezing at low temperatures, risk of salt decomposition at higher temperatures (Carnegie et al. 2013).
Applications
Thermal energy storage is used for space heating or cooling, hot water production, electricity generation, helps overcome mismatch between demand and supply of thermal energy (IEC, 2011).
2.7
Definitions and Terms
Response time and Discharge duration
Response time relates to how fast a storage system can discharge energy when it is needed.
Page | 42 Although for most applications the rated power (the power output of a device) and the discharge duration are the biggest concern, in some applications where energy is needed for emergency, the response time is also very important (Carnegie et al. 2013).
Depth of discharge and frequency of discharge
Depth of discharge relates to the percentage of the full storage capacity of a system discharged before the storage system is recharged (Carnegie et al. 2013).
Frequency of discharge relates to how many times a storage system power is discharged.
Depending on the type of the storage technology, the depth of discharge can be something to worry about. Deep discharge can reduce the lifetime of some electromechanical batteries and cause damage to the battery cells. Other technologies operate best under full or 100 percent depth of discharge (Carnegie et al. 2013).
Efficiency
Efficiencyrelates to the energy ratio of the input to the output for a charge-discharge cycle.
Page | 43
Chapter 3:
Methodology
3.1
Chapter Overview
This chapter describes the design adopted by this research to achieve the aims and objectives as stated in chapter 1. The first section of this chapter discusses the research and development methodology used in this research project, the stages by which the methodology was implemented, and the research design; the second section details the task analysis; the third section details the software used in this research project; finally, the last section discusses the assessment of consequential effects and ethical responsibilities.
3.2
Research and Development MethodsThe research and development methodology used in this design project was based on various literatures. The aim of the design project was achieved based on knowledge from previous work. Different methodologies were used to achieve the goal of this research project.
Page | 44 power and energy requirements for a typical household over the course of the peak period.
At utilities level, an analysis was conducted on the NSW network to determine the size of the peak demand and the available capacity to charge energy storage systems in the off peak period without creating a peak demand during both summer and winter. NSW demand data was retrieved from the Australian Energy Market Operator (AEMO) network demand database. The retrieved demand data was used to determine the network average load, the size of the peak demand under winter and summer conditions, the available capacity to charge energy storage systems in the off peak period without creating a peak demand.
A MATLAB algorithm was used to analyse network power flow under different conditions. This enabled analysis of voltage levels at different nodes of the network to evaluate voltage regulation capability of distributed energy storage systems. Cost effectiveness of energy storage systems was simulated using HOMER ENERGY software in order to determine whether using energy storage systems is beneficial to energy consumers compared with purchasing energy from the electricity grid.
3.3
Task Analysis
The project methodology was simplified into the following major steps. Determine energy required to run a typical household over the course of the
peak demand period.
Design an energy storage system to meet power and energy requirements for a typical household.
Page | 45 Determine network available capacity to charge energy storage systems
without creating a peak demand in the off peak period.
Determine the maximum number of households that the network can charge during the off peak period.
Determine the minimum number of households required to use energy storage systems during peak periods in order to avoid the network peak demand.
Model the effectiveness of distributed energy storage systems on the NSW network.
Analyse power flow within the network to evaluate voltage regulation capability of distributed energy storage systems.
Simulate cost effectiveness of energy storage systems.
The tasks identified above were set as major sections of the project design and used to assess the progress of the design project.
3.4
Software
The software used in this research project includes: Microsoft Excel for data processing
MATLAB for power flow analysis
Page | 46
3.5
Assessment of consequential effects and ethical responsibilities
3.5.1 Sustainability
In this project, no manufacturing is required other than using the available resources. The use of this system is reflective of the current sustainability regulations and guidelines.
3.5.2 Ethical Responsibilities
According to Engineers Australia (2010), all members of Engineers must commit to practice in accordance with the following four Code of Ethics.
1. Demonstrate integrity: Act on the basis of a well-informed conscience, be honest and trustworthy, respect the dignity of all persons.
2. Practise competency: Maintain and develop knowledge and skills, represent areas of competence objectively, act on the basis of adequate knowledge.
3. Exercise leadership: Uphold the reputation and trustworthiness of the practice of engineering, support and encourage diversity, communicate honestly and effectively, taking into account the reliance of others on engineering expertise.
Page | 47 3.5.3 Safety
In this research project, prolonged use of a personal computer was involved. When using a computer, it is recommended that proper use of a computer is followed to avoid any stress related injury, degenerative eye problem or back and posture problems.
3.5.4 Risk Assessment
[image:61.595.120.516.402.739.2]This research project involved prolonged use of a computer. The activity required risk assessment of a computer. The risk assessment induction was conducted to identify risks involved with prolonged use of a computer. In this case, factors that can affect a computer user were assessed.
Table 3.1 : Risk Assessment for a computer
Problem Existing control Consequences Probability
Eye strain General Precautions
-Visual fatigue
-Blurred or double vision
-Burning and watering eyes
-Headaches and frequent changes in prescription glasses
Rare
Musculoskeletal General precautions
-Upper limb disorder -Back and neck pain and discomfort
-Tension stress headaches and related ailments
Page | 48
Table 3-2 : Risk rating.
Using a computer for a prolonged period of time involves potential stress related injury, degenerative eye problem, back and posture problems.
3.6
Chapter summary
Page | 49
Chapter 4:
Analysis
4.1
Chapter Overview
This chapter discusses the details of the design approach based on the knowledge from the literature reviewed in chapter 2 and the details provided in methodology chapter 3. The discussion in this section is based on the use of distributed energy storage systems to avoid the network peak demand. This was achieved by developing an energy storage system that, when used to store the extra electricity available in the off peak period and discharging it during the peak period in an urban area, can help improve utilisation of network assets.
4.2
Ideal System Design Setup
The system design setup below is a model of a practical energy storage system design that could be implemented in a practical setting.
Page | 50
4.3
Power Demand and Energy Consumption for a Typical
Household
4.3.1 Peak Lopping
This approach looks at the storage capacity required to help maintain energy consumption below the base load over the course of peak demand. In this case, the base load is supplied from the grid while the