i
“MORBIDITY PATTERN AMONG WOMEN
DURING PUERPERIUM AND ITS RISK
FACTORS – A CONCURRENT COHORT
STUDY”
DISSERTATION SUBMITTED IN PARTIAL FULFILMENT OF
THE REQUIREMENT OF THE TAMILNADU DR.M.G.R.
MEDICAL UNIVERSITY, CHENNAI, FOR THE DEGREE OF
MD BRANCH XV (COMMUNITY MEDICINE) EXAMINATION
TO BE HELD IN MAY 2018
THE TAMILNADU DR. M.G.R. MEDICAL UNIVERSITY
CHENNAI
vi
ACKNOWLEDGEMENTS
I am grateful to the lord almighty for giving me an opportunity to carry out this study. The journey through this study has been a great learning experience and I wouldn’t have been able to complete it without the support and blessings of the following people.
Dr. Kuryan George , Professor, Community health department. My mentor who has encouraged and helped me steer my way through and has been supportive to all my queries. I have learnt a lot just by building on the ideas he suggests.
Dr .Jasmin Prasad , HOD and co investigator in this study who has helped me with her valuable inputs on the study tools, process of data collection, data analysis and results.
The department of community health, CMC Vellore for giving me this opportunity and teaching me the basics of a research study.
Faculty of department of community health- Dr. Vinod Abraham, Dr. Shanthidhani Minz. Dr. Venkataragahva, Dr. Anu alexander, Dr. Anuradha Rose, Dr. Divya Muliyil, Dr. Sam Marconi for their valuable inputs in the design and results of the study.
Dr. Anne George Cherian and Dr. Suja Kurian , who are co investigator in this study who have been very approachable and helped with expert advise whenever required.
Mrs Salomi Rakesh who had helped in obtaining participant list. Mr. Augustine, Mrs. Gifta Augustine, Mrs. Thabitha and my friend Rachel who had helped in the process of translation.
Health aides of CHAD programme, who were vital members of this study as well. This study would not be possible without their help and cooperation.
Mr. Balaji and team in laboratory of CHAD hospital for their help.
My friends- Ananthram V, Swathi Krishna, Shalini J, Nirmala Joseph, Sandeep Thacker, Deepak Varughese, Kusum Moray, Sumanto Pal, Mohanraaj PK, Riya Mathew, Bincy Mary.
vii
My parents Mr. Kunnath Sriramanarayanan, Mrs. Geeta Sriramanarayanan, Mr. Krishnakumaran K, Mrs K C Pushpalatha who have been my pillar of support. They have been very understanding and helpful during various stages of the study and have always been there for me.
My siblings Anand S, Shreya Anand, Akhil C for their love and encouragement.
Anoop Chundarathil, my husband and friend who has always encouraged me to work harder. Without his support, completing this study would have been difficult.
viii
Glossary of Abbreviations
CDC- Center for Disease Control
CHAD- Community Health and Development
CMC- Christian Medical College
DALY- Disability Adjusted Life Years
DSM- Diagnostic and Statistical Manual
PHC- Primary Health Centre
PHN- Public Health Nurse
PNC- Postnatal Care
PTCHW- Part Time Community Health Worker
NFHS-National Family Health Survey
UTI- Urinary Tract Infection
ix
Table of Contents
1 Introduction ... 1
2 Justification ... 4
3 Aim and Objectives ... 6
3.1 Aim ... 6
3.2 Objective ... 6
4 Literature review ... 7
4.1 Introduction ... 7
4.2 Postpartum infections ... 9
4.2.1 Urinary Tract Infection ... 10
4.2.2 Mastitis ... 11
4.2.3 Wound infection ... 13
4.2.4 Puerperal Sepsis ... 15
4.3 Postpartum Anaemia ... 16
4.4 Postpartum depression... 19
5 Methodology ... 23
5.1 Study Setting ... 23
5.2 Study design ... 25
5.3 Duration of the study ... 25
5.4 Materials and methods ... 25
5.5 Informed consent ... 25
5.6 Study procedure... 26
5.7 Data entry ... 29
5.8 Data analysis ... 29
5.8.1 Descriptive statistics ... 29
5.8.2 Risk factor analysis ... 29
5.8.3 Exposure variables ... 30
5.8.4 Outcome variables: ... 32
6 Results ... 35
6.1 Socio demographic characteristics ... 35
6.2 Obstetric history and past history of illness ... 43
6.3 Characteristics of current pregnancy and delivery ... 45
6.4 Outcome variables ... 52
6.5 Risk factor analysis ... 57
7 Discussion ... 66
7.1 Sociodemographic related risk factors ... 66
x
7.3 Overall magnitude of morbidity ... 70
8 Conclusions ... 73
9 Limitations ... 74
10 Recommendations ... 75
11 Bibliography ... 76
Annexures
1. Study Proforma
2. B G Prasad Scale 2017 3. Informed Consent
4. Informed Consent- Tamil 5. Information Sheet
6. Information Sheet- Tamil
7. Edinburgh Postpartum depression scale – Tamil 8. Diagnostic criteria of symptoms- Tamil
xi
Tables:
Table 4.3.1 WHO Haemoglobin Cut-off Values ... 17
Table 6.1.1 Age distribution (n=202) ... 35
Table 6.1.2 Age at marriage (n=202) ... 36
Table 6.1.3 Family type (n=202) ... 37
Table 6.1.4 Literacy status (n=202) ... 37
Table 6.1.5 Educational status of the participant (n=202) ... 37
Table 6.1.6 Educational status of the participant’s husband (n=202) ... 38
Table 6.1.7 Occupation of the participants (n=202) ... 39
Table 6.1.8 Occupation of the participant’s husband (n=202) ... 40
Table 6.1.9 Socioeconomic class of participants (n=202) ... 40
Table 6.1.10Summary table of Sociodemographic characteristics (n= 202) ... 42
Table 6.2.1. Gravida (n =202) ... 43
Table 6.2.2 Parity (n=202) ... 43
Table 6.2.3 Number of living children (n=202) ... 43
Table 6.2.4 Distribution of previous poor outcomes (n=147)* ... 44
Table 6.2.5 History of chronic illness (n =202) ... 44
Table 6.2.6 Type of chronic illness (n =202) ... 44
Table 6.2.7 Family history of psychiatric illness (n=202) ... 45
Table 6.3.1 Risk factors in current pregnancy (n = 202) ... 45
Table 6.3.2 Type and frequency of risk factors (n = 202) ... 45
Table 6.3.3 Supplementation during pregnancy (n=202) ... 46
Table 6.3.4 History Suggestive of Urinary Tract Infection in antenatal period (n=202) .... 47
Table 6.3.5 Fears experienced during pregnancy and immediate postpartum period (n=202) ... 47
Table 6.3.6 Interventions during delivery (n=202) ... 48
xii
Table 6.3.8 Mode of delivery (n =202) ... 49
Table 6.3.9 Place of delivery (n=202) ... 50
Table 6.3.10 Newborn Characteristics (n=205)* ... 50
Table 6.3.11 Family and Spouse Support (n=202) ... 51
Table 6.3.12 Haemoglobin levels during antenatal period (n=199)* ... 51
Table 6.4.1 Infections by the respective follow up period: ... 52
Table 6.4.2 Cumulative probability of infection. ... 53
Table 6.4.3 Postpartum Haemoglobin among the participants (n=173)* ... 53
Table 6.4.4 Postnatal Anaemia among the participants (n=172)* ... 54
Table 6.4.5 Change in Haemoglobin value (n=172)* ... 55
Table 6.4.6 Prevalence of postpartum depression (n=173*) ... 55
Table 6.4.7 Summary of morbidity in puerperal period ... 56
Table 6.5.1 Association between risk factors and development of Postpartum infection (n=202) ... 57
Table 6.5.2 Association between risk factors and development of postpartum depression (n = 173) ... 59
Table 6.5.3 Multivariate analysis of risk factors on developing postpartum depression using binary logistic regression method ... 61
Table 6.5.4 Multivariate analysis of risk factors on developing postpartum depression using binary logistic regression method ... 62
Table 6.5.5 Association of risk factors and the development of postpartum anaemia (n=202) ... 63
xiii
Figure 6.1 Age of Participant (n=202) ... 36
Figure 6.2 Age at marriage (n=202) ... 36
Figure 6.3 Educational status (n=202) ... 39
1
1
Introduction
Postpartum period also known as puerperium is the period up to 6 weeks (42 days)
after childbirth and is a crucial period for ensuring the health and survival of a woman
and her newborn. Routine post-partum care is integral to ensuring holistic maternal
care and is still largely neglected. This period poses a special challenge in providing
good quality care to both the mother and child. Suitable measures during puerperium
can have a positive impact in enhancing the health of women. However, lack of care
during this period can have a huge impact in the form of disability or death to both.
Currently in India, the postpartum checkup for the mother is limited to vaginal
examination and contraceptive education. In a national survey it was found that
around one third of mothers who received postpartum care, were of the opinion that
their felt needs were unaddressed. Women were interested about the diet to be
followed, exercise to be done in order to gain back original body size, ways of
tackling fatigue and resuming normal activities apart from child care information.
The maternal health status is assessed by indicators during each of the antepartum,
peripartum and postpartum periods. The most important among them is the maternal
mortality ratio. Globally India ranks 53rd among 182 countries for having the highest
maternal mortality ratio.(1)Maternal death is the death of a woman while pregnant or
within 42 days of termination of pregnancy, irrespective of the duration and site of
the pregnancy, from any cause related to or aggravated by the pregnancy or its
management but not from accidental or incidental causes.(2) Maternal mortality ratio
2
period. As of 2013, maternal mortality ratio in India was found to be 167 per 100,000
live births.(3)99% of maternal deaths occur in developing countries and there is a
large disparity in maternal mortality among developed and developing countries. A
systematic analysis of the various studies assessing the causes of maternal death
globally between 2003-2012 showed that hemorrhage accounted for 27.1%of deaths
hypertensive disorders for 14%, sepsis for 10.7%, abortion for 7.9%, embolism for
3.2% and all other direct causes for 9.6% of maternal deaths.(4) A similar distribution
was seen in the national representative survey for the causes of maternal death from
2001-2003 with hemorrhage contributing to 27%, sepsis to 17%, abortion to 10%,
hypertensive disorders of pregnancy to 7%,indirect causes to 16% and other causes
to 23% of maternal deaths.(5)
The issue of the alarming rise in maternal mortality rates globally was discussed first
in 1987. Since then, many initiatives have been taken to reduce the burden worldwide.
The safe motherhood initiative was among the first to be established after which this
issue was taken up in the International conference on population and development as
well as fourth world conference on women. The millennium development goals were
established in the year 2000 which aimed at reducing maternal mortality by 75% by
the year 2015. (6) This is now currently followed by the Sustainable development
goals which aims at reducing the global maternal mortality ratio to less than 70 per
1,00,000 live births.(7)
The burden of maternal illness in a large part is contributed by morbidity experienced
by postpartum women. The standard for postpartum care recommended by WHO is
3
newborns are expected to be seen by a health care worker on day 3 (48- 72 hours) ,
between 7-14 days after birth and six weeks after birth .(8)There are national
indicators to assess for the quality of postpartum care . The standards include a visit
within 48 hours of delivery. However, in India, the proportion of women who
received a postpartum visit within 48 hours irrespective of their place of delivery was
67.2%. A multilevel analysis performed in 9 states of India assessing the factors
associated with maternal healthcare service utilization revealed that women with a
birth order of 3 and above, lower education level and lower socioeconomic status
were less likely to utilize postnatal care services. At the community and district levels,
type of residence, average population covered per PHC, availability of PHC with
labour room facility and percentage of registered pregnancies were significantly
associated with the utilization of PNC services.(9) Postpartum visits to the mother as
recommended by WHO helps the health workers assess the physical and psychosocial
wellbeing of the mother. However currently there are no concrete national strategies
in place to ensure optimum postpartum health. Maternal morbidity especially during
the postpartum period is still difficult to measure. More studies are required to look
at the relationship between different types of morbidity and their potentially adverse
4
2
Justification
Maternal morbidity is defined as any illness or injury caused by, aggravated by or
associated with pregnancy or an additional of childbirth.(10) In 1993 WHO estimated
that around 42% of women among the 129 million who gave birth annually
experienced at least mild complications of pregnancy and around 15 million women
among them develop pregnancy related complications with long term effects. In
addition to the acute complications, health during pregnancy and childbirth has a
further impact on health and wellbeing of the family and can lead to adverse situations
like broken families, divorce, isolation etc. Mental health problems of women apart
from family instability and loss of community status has possible effects have been
reported. Such studies have shown that the loss is not easily quantified and hence an
area that needs to focused upon. Majority of the adverse effects experienced by the
woman and her family due to morbidity arising from pregnancy and childbirth are
preventable if identified early. This will benefit them and reduce the illness burden
on the healthcare system. Cash incentive schemes like Janani suraksha yojana have
definitely improved the institutional care received by the woman through her
pregnancy and after but there is still a long way to go.
Currently in the United Kingdom, routine surveillance systems to assess uncommon
but severe pregnancy complications nationally based on the WHO near miss approach
which has 25 severe markers for maternal morbidity is in use. The success of this
initiative has now encouraged other countries like New Zealand, Australia and
5
community based initiative to identify such potential morbidity and its interrelated
socioeconomic and obstetric risk factors. Results from similar studies across the
country would further help in developing a strategy relevant to the Indian context of
identifying women who develop morbidity and potential near misses. Such a strategy
will also help us identify women who are at risk and hence make targeted
6
3
Aim and Objectives
3.1
Aim
To study the morbidity profile among women in postnatal period up to 6 weeks after
childbirth and to determine risk factors for the identified morbidity.
3.2
Objective
1. To determine the magnitude of morbidity experienced among women in postpartum
period up to 6 weeks after childbirth in a rural bock of southern India.
7
4
Literature review
4.1
Introduction
Maternal morbidity among women after childbirth varies from minor to very severe
illnesses. Fatigue, headache, backache, constipation and sexual problems are the
typical symptoms during this period. However postpartum hemorrhage, infections
like urinary tract infection, mastitis, infection at surgical wound site, puerperal sepsis,
infection at episiotomy site, anemia, depression, other complications like breast
abscess, breast engorgement, uterine prolapse, urinary and fecal incontinence,
dyspareunia, hypertension, hemorrhoids, perineal tears, fistula and pulmonary
embolism can also develop.(12) Many of these conditions develop during child birth
and can be managed at the hospital itself before getting discharged. However, these
can manifest among the women who have had a home delivery. The illnesses with
the potential of developing after discharge from hospital contribute to a significant
proportion and the magnitude depends on the socio-demographic factors like literacy,
socioeconomic status etc. A study done in Lusaka, Zambia analyzing the postpartum
morbidity requiring hospital admission showed that women are subject to both
obstetric morbidity like puerperal sepsis and non-obstetric morbidity like infections
such as pneumonia, malaria etc.(13) A cohort study done in Maharashtra, India
reported the incidence of maternal obstetric morbidity as 52.6% of which 17.7% was
during labour and 42.9% was during puerperium. The common problems encountered
during puerperium included breast problems which was 18.4%, puerperal genital
infections which was 10.2%, secondary postpartum hemorrhage was 15.2% and
8
The most dominant model in safe motherhood is the ‘3 delay model’. (15) This model
is based on the time elapsed from :-
Onset of symptoms of complications to recognition of the need to visit a health
facility,
Leaving the home to reaching the facility,
Presentation at the facility to provision of appropriate services.
All of the above possible lapses are dependent on multiple factors such as poverty,
education levels, geographical accessibility, adequate functioning of the referral
systems, presence of appropriate infrastructure and trained personnel and provision
of good quality care at the service centers. The disadvantage of this model is the lack
of the possible fourth delay which is the delay to seek care after childbirth once the
woman has been discharged from the hospital or after home delivery. Although there
has been an improvement in the global attention to maternal mortality due to the
increase in number of studies done, we still largely depend on research. Paucity of
data on morbidity only worsens the present state. Furthermore, community based data
is almost nonexistent.
Investigation of the magnitude of morbidity experienced by women during
postpartum period can reduce the gap in knowledge regarding the association of
maternal morbidity with various factors. This can ensure that appropriate policies can
9
4.2
Postpartum infections
A significant proportion of maternal deaths occur in postpartum period. A systematic
analysis done by WHO showed that pregnancy related infections contributed to 9 %
of maternal deaths. during 2003-2009.(16) However, in most of the developing
countries the entire focus of the maternal and child health programs shifts on to the
neonate after childbirth.
The term postpartum infection refers to the various bacterial infections that occur
during the first 6 weeks after childbirth. Common postpartum infections include
endometritis or puerperal sepsis, postsurgical wound infections, mastitis, urinary tract
infections and respiratory complications from anesthesia. Premature rupture of
membranes, history of caesarean delivery, frequent vaginal examinations are the most
common risk factors for developing postpartum infections. Moreover, presence of
diabetes, obesity and pre-existing pelvic infection predisposes a woman to a higher
risk of infection postpartum.(17) Most studies tend to underestimate the incidence
of infections in the postpartum period . This is primarily because most of the
identified episodes are self-reported. The estimate of deaths due to infections are
based on verbal autopsies. In reality the larger proportion of infections during
postpartum period remain unidentified and unreported. According to a national study
of the causes of maternal mortality from 2001-2003, 16% of women died during that
period due to pregnancy related infection.(18)Infections contribute significantly to
the burden of illness in the post-partum period , and are entirely preventable. Our
study aims at estimating the magnitude and to study the relationship between
10
help reduce infections in postpartum period paving the way to a better quality of life
to the mother and her baby.
4.2.1
Urinary Tract Infection
Urinary tract infections are the most common bacterial infection affecting pregnant
women. It generally presents as either asymptomatic bacteriuria, acute cystitis or
acute pyelonephritis. Among them, acute pyelonephritis is the one that is most
associated with morbidity to the mother and fetus. Asymptomatic bacteriuria occurs
in 2 to 7 percent of pregnant women.(19)Pregnant women are at a risk for urinary
infection starting from 6 weeks and peaking during 22- 24 weeks of gestation.(20)
Screening during antenatal period for urinary infection is not routinely done. Factors
associated with a higher risk of bacteriuria include a history of prior urinary tract
infection, pre-existing diabetes mellitus, increased parity, and low socioeconomic
status.(21)
Urinary tract infection in pregnancy can lead to serious consequences in both the
mother and the growing fetus. Once the mother develops a urinary infection she is
more prone to have a premature delivery, develop chorioamnionitis and
complications like hypertension or preeclampsia and anemia. The neonate of a
mother infected with urinary infection is more prone to infections like pneumonia and
sepsis ,low birth weight and prematurity.(20) Instrumentation, catheterization and
surgical procedures during delivery increases her risk of urinary tract infection in
11
a caesarean section, tocolysis and being induced for labour as risk factors for
developing urinary tract infection postpartum.(19)
Through this study we aim to identify the proportion of urinary tract infection among
the other infections seen in women postpartum.
4.2.2
Mastitis
Breast milk is the best source of nutrition for babies before they are able to digest
other semi solid foods. WHO recommends exclusive breast feeds for infants up to 6
months of age followed by complementary feeds alongside breast milk thereafter in
order to achieve optimal growth and development and to prevent common childhood
illnesses.(19) In spite of the many advantages of breast milk, the proportion of infants
who are exclusively breast fed is far from acceptable levels. NFHS 4 (2015- 2016)
data suggests that only 57.2% of babies aged 0- 6months are exclusively breast fed
indicating that we need to still focus on the importance of breast feeding and work
towards achieving optimal goals.(22) One of the common problems women face is
the development of breast related infections which hinder them from breast feeding
and therefore resorting to commercially available milk products for the infant’s
nutrition.
Mastitis is an inflammatory condition of the breast which may or may not be
associated with infection. However, when associated with infection the most common
causative organism is Staphylococcus aureus. It almost always occurs during
lactational period and hence is also known as lactational mastitis. WHO estimates
12
incidence may vary between 2.6% and 33%.(21) It typically presents as firm, red,
tender, swollen area of one breast associated with fever in a nursing mother. Systemic
complaints may include myalgia, chills and flu like symptoms.(20)The pain can be
debilitating for the feeding mother causing her to discontinue breast feeding
prematurely. If inadequately managed it can lead to complications like breast
engorgement, breast abscess or even inflammatory breast cancer.(20) The most
common causes of lactational mastitis are milk stasis and underlying infection. Milk
stasis occurs if the mother is unable to feed for reasons such as illness, stress, fatigue
or practices inadequate breast feeding techniques with delayed timings or has
problems in the nipples like sore nipples or plugged ducts. Many a times women
are wrongly advised by health workers to discontinue breast feeding once mastitis
develops which has only led to further worsening of the condition. Mastitis occurs
mostly during the first 12 weeks after delivery. In a study done in Glasgow, 18 % of
the women experienced postpartum at least one episode of mastitis with almost 53%
of them in the first four weeks.(23) A multi-centric cross sectional study done across
three hospitals in Cameroon identified poor breast hygiene, less number of feeds in a
day, poor awareness of breast feeding techniques and ample supply of milk possibly
due to voluntary discontinuation of breast feeding before completion of 6 months as
recommended by WHO as the predictors for development of mastitis in postpartum
13
4.2.3
Wound infection
With an alarming increase in the rates of caesarean sections and episiotomy
procedures in both the developed and developing worlds, the proportion of women
developing postpartum wound infection has shown a rising trend. Postpartum wound
infections which include incision site of caesarean section, episiotomy incision site,
tear and laceration contribute to a significant morbidity and at times can progress into
sepsis and turn out to be fatal. It has led to prolonged hospital stay after delivery
posing a risk to both the mother and infant leading to increased burden on the health
care system. Most of the research focuses only on infections arising from post
caesarean section and episiotomy and the tears and lacerations go unaccounted for.
It commonly presents with increasing pain, discharge, edema, localized erythema and
tenderness along with occasional systemic symptoms of infection.
WHO recommends that no more than 10-15% of births should be by caesarean
section.(24) In 2014 caesarean section rates were analyzed in 150 countries and a
18.6% of births were by caesarean section.(25) A case control study in Brazil reported
an post caesarean section infection rate of 1.44%.(24) Another hospital based study
done in south India found the prevalence of post caesarean section wound infection
to be 4.1%.(26) Studies have shown that pregnancy related factors like hypertensive
disorder, gestational diabetes mellitus, twin pregnancy, preterm rupture of
membranes, greater number of vaginal examinations, prolonged trial of labour prior
to surgery, use of epidural analgesia, use of internal fetal monitoring and
chorioamnionitis are risk factors for developing infection. Performing caesarean
14
caesarean hysterectomy and longer duration of surgical procedures are risk factors
for developing infection.(27)
Episiotomy is a surgical incision made in the perineum during the second stage of
labour to expand the vaginal opening when hastening vaginal delivery of the baby is
warranted. Previously it was routinely in use and had increased complications. Hence
it was recommended to perform it on an individualized basis.
The incidence of infections varies worldwide. Women seek treatment from multiple
care providers making it difficult to obtain information from different sources.
Furthermore, the follow up may be incomplete since most of the women are
discharged from the hospital early. Finally, there is a huge variability in the
environment in which maternity care is provided globally and high infection rates can
be attributed to poor hygiene, lack of adequate health care, and poverty. The Royal
College of obstetricians and gynecologists and the national institute of health and
clinical excellence have recommended guidelines to be followed by health
professionals during intra-partum and postpartum care. Methods of identifying signs
of infection and maternal education on perineal hygiene, diet and pelvic floor
exercises have also been highlighted. A study done in the United states suggested that
one in ten women who sustained a perineal tear at vaginal delivery that required
suturing developed perineal wound infection with instrumental deliveries and
prolonged rupture of membranes predisposing women to it.(28) This study aims to
highlight the need for post discharge surveillance based programs to prevent and
actively manage infections among women having a surgical wound attained during
15
4.2.4
Puerperal Sepsis
Puerperal sepsis is defined as infection of the genital tract occurring any time between
the rupture of membranes or labour, and the 42nd day postpartum. The diagnosis is
made in the presence of 2 or more of the following clinical signs and symptoms
namely pelvic pain, fever, abnormal vaginal discharge with foul odour and delay in
the rate of reduction of the size of the uterus.(29) In spite of the surge in antibiotic
prophylaxis, puerperal sepsis is still currently widely present in developing
countries and can eventually lead to shock or even death. It usually occurs 24 hours
after delivery, is largely undiagnosed and unreported due to the poor postpartum
follow up.(29) According to Global burden of disease 1990, maternal sepsis ranked
46th in terms of DALY’s and attributed for 18% of the total burden of conditions and
15% of all maternal deaths.(29) Studies have shown prolonged labour, frequent
vaginal examinations in labour and premature rupture of membranes to be strong
predictors of developing postpartum sepsis. However, there are many other factors
such as delivery being conducted by an untrained birth attendant, inaccessibility of
health facilities, long distances to travel in labour, low socioeconomic status, lack of
adequate hygiene, unavailability of postpartum care, illiteracy, poor support and lack
of awareness of symptoms and signs of puerperal sepsis which also indirectly
contribute to the increasing burden. In a study done in Delhi, the incidence of
puerperal sepsis was 2.5% over a 4 year follow up period.(30) In India, many health
facilities lack the basic infrastructure and are staffed by untrained professionals
handling the delivery and surgeries, and consequent poor practice of safe surgical
16
the rise in number of women affected by puerperal sepsis. A lack of awareness among
women about contraceptive measures leading to higher proportions of unwanted
pregnancy and hence unsafe abortion methods could lead to increased infections.
Unnecessary delay in diagnosis due to shortcomings in the established health system
such as poorly functioning laboratories, wrong practice of overprescribing antibiotics
and hence leading to resistance could contribute to the rising infections.
The need of the hour is community based studies to help identify such at risk women
and aggressive measures to educate women of such occurrences during antepartum
period itself. This will also help develop better institutional protocols which will in
turn be instrumental in planning preventive strategies at higher levels.
4.3
Postpartum Anaemia
Anaemia refers to a low concentration of haemoglobin in the body. The oxygen
carrying capacity is insufficient to meet the physiologic needs which may vary by
age, sex, altitude, pregnancy status etc. The pathophysiology of anaemia is quite
diverse and it most typically presents as generalized fatigue, light headedness,
palpitations or shortness of breath. Anaemia is considered to be one of the most
debilitating nutritional deficiencies that is often undertreated and its burden
underestimated. In India, inadequate iron and folate levels either due to poor dietary
intake or poor bioavailability and chronic blood loss during infections like malaria
and hookworm infestations have been stated as the causes for anaemia.(31) Among
the various types, iron deficiency anaemia is the most common with women and
children being more vulnerable and has a high prevalence in the developed world as
17
A study done in 2013 which estimated the global burden of anaemia from 1990- 2013
identified that 27% of the world’s population had anaemia with developing countries
bearing more than 89 % of the burden. Women of the reproductive age group and
pre-school children were at the highest risk of developing the disease as per the
study.(32) According to NFHS 3 statistics (2005-2006), 59 % of pregnant women in
India are anaemic.(33) Anaemia is said to directly cause around 20% of the maternal
deaths and indirectly cause another 20% of maternal deaths in India.(34) Apart from
its contribution to maternal mortality, anaemia in pregnancy is also known to be
associated with preterm labour, fetal growth restriction, low birth weight and infant
mortality. It also impairs the lactation and causes postpartum depression and poor
maternal/infant interactions.(35) Infants of mothers who are anaemic are prone to
develop anaemia as well in their growing years making them more susceptible to
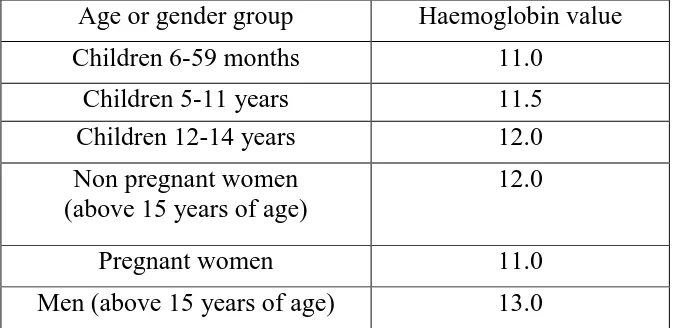
developmental delay and infections. WHO has given cut off Haemoglobin values for
various age and gender groups below which anaemia is diagnosed, the values of
[image:30.595.137.474.565.729.2]which are mentioned in the table below.(36)
Table 4.3.1 WHO Haemoglobin Cut-off Values
Age or gender group Haemoglobin value Children 6-59 months 11.0
Children 5-11 years 11.5 Children 12-14 years 12.0 Non pregnant women
(above 15 years of age)
12.0
Pregnant women 11.0
18
In India, the Ministry of health and family welfare has implemented supplementation
strategies apart from diet diversification and food fortification techniques to combat
the growing burden of anaemia. All pregnant and lactating women are given 100 mg
of elemental iron and 500 mcg of folic acid for a minimum of 100 days during both
pregnancy and postpartum.(37) Blood loss during delivery poses an important risk to
developing postpartum anaemia. The postpartum phase is a critical period for a
woman and her newborn. The presence of anaemia decreases the quality of life and
delays her ability to resume daily activities.
Studies show that almost 82-88% of deaths occurred within first 2 weeks after
delivery of which the first 24 hours was the most crucial time.(38) A community
based study in Rajasthan identified anaemia as the most common morbidity during
postpartum period with 7.4% of women suffering from severe anaemia and 46% from
moderate anaemia.(39) Anaemia during postpartum period can contribute to low
milk supply, delayed wound healing, low immunity and increased susceptibility to
infections.(40) (41) Studies have shown antenatal anaemia as the single most
important risk factor for developing postpartum anaemia.(42) In addition to this, a
study done in South India showed that lower maternal age, poor compliance to
supplementation, perceived higher blood loss and presence of anaemia at 36 weeks
of gestation are risk factors for developing postpartum anaemia.(43) Another study
done in Mangalore, South India described illiteracy of mothers, parity of 3 and more
and inter-pregnancy interval of less than 3 years as contributing factors for
19
measures are taken to reduce its burden. However postpartum anaemia is not
routinely screened for and its burden underestimated.
The objective of this study is to determine the prevalence of postpartum anaemia and
its determinants among women of a rural block so that a focused approach towards
reducing its burden can be planned alongside other targeted interventions to enhance
quality of life in the postpartum period of a woman.
4.4
Postpartum depression
Postpartum period has been a time of increased risk for developing serious mood
disorders. Despite the launch of the national mental health program in 1982, mental
health problems of a woman during her pregnancy and postpartum period has not
been given much attention. A lack of training of health workers to screen and assess
these conditions during their routine care has only elevated their burden.
Unfortunately, mental illness affecting a woman during peripartum and postpartum
period is not taken into consideration much during the overall maternal mortality and
morbidity assessment of the country. Hence there is currently no active screening tool
in use to determine the burden of mental illness in the community. There is very
limited availability of mental health specialists in the country and utilization of the
existing services is also very poor mainly due to the stigma associated with it.
However, the number of studies done across the country has increased in the last
decade which suggests that maternal mental illness is being considered as a
20
Postpartum affective illness comprises of postpartum blues, postpartum depression
and postpartum psychosis. Postpartum blues also known as baby blues or maternity
blues. It is the most commonly observed mood disturbance during puerperium with
symptoms beginning within a few days and can persist up to several days after
delivery. Studies have shown that the prevalence of postpartum blues ranges from 30-
75%.(45) Its symptoms include brief crying spells, irritability, nervousness, poor
sleep and emotional reactivity.(46) It is generally a mild form of the illness and
requires only reassurance. However up to 20 % of these women will develop major
depression in the first postpartum year.(45) The second component among the
affective illness is postpartum depression which lasts for a longer time. As per DSM
– IV criteria an episode of major depression after delivery is defined as two weeks or
more of persistent depressed mood or loss of interest in daily activities plus any four
associated symptoms like fatigue, feeling of worthlessness or inappropriate guilt,
poor concentration, suicidal ideation, sleep disturbance, loss of appetite, psychomotor
agitation or slowing that onset within 4 weeks after childbirth.(46) A meta-analysis
of studies done on postpartum depression in India revealed that the overall prevalence
of postpartum depression among Indian mothers was 22%.(47) The risk factors
identified consistently among the various studies included presence of recent stressful
life events, previous history and antenatal history of depression, financial difficulties
and poor social support. Factors such as stress related to care of the child and low
self-esteem were moderate predictors and poor relationship with partner, lower
socioeconomic status, single parent and presence of any complications during
21
community based study done in South India identified problems with in- laws and
birth of a female child when a son was desired as contributory factors to postpartum
depression.(48) On the other hand being satisfied with the pregnancy, being
multiparous and perceived adequate support from family and friends were associated
with a decreased likelihood of depression based on a study done in South Asia.(49)
The third and the most serious component of postpartum affective illness is
postpartum psychosis. It presents with rapid onset of symptoms presenting as early
as first 48 to 72 hours postpartum with the majority of these episodes developing
within the first 2 weeks after delivery.(50) Symptoms include typically depressed or
elated mood, disorganized behavior, mood lability, delusions and hallucinations.(50)
Mothers who have developed depression or psychosis are at a risk of injuring their
children and generally have strained relationship with their infant and if not
intervened into can have a long term effect on their growth and development.
A variety of tools like the Centre for epidemiologic studies of depression instrument,
patient health questionnaire 9, postpartum depression scale, beck depression
inventory and Edinburgh postpartum depression scale have been used to assess
postpartum depression.(46) However the most common among them is the
Edinburgh postpartum depression scale which is an easy to use, self-administered
instrument containing 10 items ranked from 0 to 3 which reflects the experience over
the past week and has been extensively validated.
In our study with the help of this tool, we aim to screen for depression postpartum
22
seek care or who are unaware of their condition will be identified and hence be a
23
5
Methodology
5.1
Study Setting
The study was conducted in Kaniyambadi block of Vellore district, Tamil Nadu. The
Kaniyambadi block has 82 villages and a population of 1,15,384. The community
health department of Christian medical college, Vellore has established an integral
health and development programme in Kaniyambadi block (CHAD). The health care
is delivered through a 3 tier system. The first tier consists of a part time community
health worker (PTCHW). She is a woman from the village selected by the community
and covers a population of 1500. Many of the PTCHW's are trained birth attendants
and have received a month's training in basic concepts of maternal and child health,
immunization, nutrition, environmental sanitation and the importance of surveillance
and their role in the same. PTCHWs are supervised by the health aide who is also a
resident of the village and serves a population of 5000. One health aide supervises
3-4 PTCHWs. She has a minimum education up to high school and is trained for a year
before recruitment. She visits each village at least once a week. The next tier consists
of a public health nurse(PHN) who is a graduate nurse and covers a population of
20,000. She supervises 3-4 health aides and visits each village once fortnightly along
with the health aide. The doctors are responsible for a population of 30,000. A doctor
along with the nurse and health aide visits every village once a month to conduct the
mobile clinic. The services provided at the clinic include curative services, antenatal
care, management of chronic diseases such as hypertension, diabetes mellitus,
bronchial asthma, dyslipidemia, psychiatric disease etc. If any person requires a
24
The base hospital is a 135 bedded hospital with out- patient department, labour room,
surgical theatre and laboratory facilities.
The health information system of CHAD programme registers all health related
events like all marriages, pregnancies, births, deaths and outbreaks of disease. These
events are informed orally by the PTCHW to the health aide. The health aide visits
each village at least once a week and during the visits verifies the information
obtained by the PTCHW. Additionally, the health aide does home visits to follow up
pregnant women, postpartum mothers and their babies, confirms immunization
details and also documents the information provided by the PTCHW. The
information obtained is validated by the PHN. Registration of deaths are done by the
health aide and the cause of death is assigned by the doctor after verifying the verbal
autopsy. When in doubt, a home visit is done to clarify the course of events. All the
documentation is computerized with weekly entry made in the pregnancies and
outcomes of registered pregnancies. Health aide receives a printout of women
monthly who are 24, 30, 36, 42 and 48 weeks of gestation to help her plan her visits
accordingly. Every week, the information is submitted to the statistician who
compiles and analyses the information. The information generated is reviewed by the
25
5.2
Study design
The study was a concurrent cohort study which studied the morbidity among women
during puerperium. The association of each morbidity with various risk factors was
also studied.
5.3
Duration of the study
The study was conducted over a period of 21 months from January 2016 to September
2017.
5.4
Materials and methods
The study proposal was approved by the Institutional Review board and ethics
committee of Christian medical college, Vellore
Sample size calculation
Sample size = (1.96)2 * P * Q --- d2
Taking the prevalence of postpartum anaemia (being the most common among postpartum
morbidity) as 47% with d being 7% : (51)
n = (1.96)² * 47 * 53 7
= 203
5.5
Informed consent
Informed consent was obtained after explaining in detail in the local language about
the study objectives, benefits to the participants and community and possible risks
26
along with contact details of the principal investigator. The consent was obtained in
a written form in the form of a signature or a left thumb impression in cases where
the participant was illiterate. Refer to Annexure 3 and 4.
5.6
Study procedure
Antenatal women in the third trimester of their pregnancy (>28 weeks of gestation)
were chosen as the eligible population. These women were identified from the list
maintained by the Health Information System of CHAD programme. A new list was
sought monthly to account for the late registrations and the new entrants into the third
trimester of pregnancy.
The inclusion criteria were:
Only permanent residents of Kaniyambadi block
Who were planning to reside in the study area during both recruitment and follow up
visits.
The exclusion criteria were:
Among the permanent residents, Women who were planning to move out of
study area after delivery and hence unavailable for follow up
The obtained list of women was given to the health aides in charge of the area and
the subject’s contact number was obtained. The women were then contacted over
telephone and after confirming their eligibility they were approached by home visits
27
first, the health aides were requested to obtain the number during the subject’s
subsequent visit to the mobile clinic for antenatal check-up. During the first home
visit by the principal investigator, the details of study were explained and their
willingness to participate confirmed. The participants were requested to inform the
principal investigator as soon as she delivered. They were provided with a home
based record book. This book consisted of symptoms of the conditions looked for in
the study written in the local language(Tamil). The conditions studied included
puerperal sepsis, mastitis, urinary tract infection, surgical wound site infection,
episiotomy site infection, anaemia and postpartum depression. The diagnostic criteria
of these conditions are described in detail in Annexure 8. The participants were
advised to inform the investigator if any of the listed symptoms were experienced
during the follow up period. Additionally, they were advised to document details of
management if any visit to a health facility was sought during the same.
The principal investigator maintained a diary with the expected delivery date of each
participant in the study. Participants were called two weeks prior, one week prior and
immediately after the expected delivery date to follow on the delivery date. The health
aide in charge was approached in case any participant was not contactable over
telephone. Meanwhile the base hospital birth register was reviewed twice weekly in
case any participant delivered at same hospital. The first home visit by the principal
investigator was made 7-10 days after delivery. During this visit, a semi structured
questionnaire was administered in the local language. Refer Annexure 1. The
questionnaire had information regarding socio-demographic details, previous
28
details and details on associated risk factors. Certain antenatal details were also noted
from the antenatal record of the patient maintained by her at home. If the record was
unavailable, the details were then obtained from the hospital record. Any symptoms
experienced from the provided checklist were also asked for. Breast and abdominal
examination was conducted ensuring privacy. However, for any perineal or pelvic
complaints, subjects were referred to the base hospital for further management. Each
health aide was provided with a list of study participants and their proposed home
visit date (28 days after delivery) which was constantly being updated on a weekly
basis as and when the subjects delivered. Simultaneously details regarding their own
visits to the study subjects were updated as well. The final home visit was done by
the principal investigator at 6-8 weeks after delivery. During this visit the participant
was once again examined and asked for any symptoms experienced as it was done in
the first visit after childbirth. In addition to that, the Edinburgh postpartum depression
scale was explained to the subject. It is a self-administered questionnaire written in
the local language(Tamil). If the participant was illiterate the questions were read out
to them by the investigator and answered based on their replies. It consisted of 10
questions with each question having four answer options with scores ranging from 0
to 3. The total was out of 30 and a score greater than or equal to 9 was taken as testing
screen positive.(52) Participants who screened positive were referred to the base
hospital for further management. A 2 ml blood sample was taken to test for
haemoglobin which was processed at the laboratory in the base hospital. A value of
12 and above was considered as normal, 11- 11.9 as mild anaemia, 8-10.9 as moderate
29
The women who had already delivered when approached by the investigator, who
were not contactable, who refused home visits after obtaining informed consent and
whose expected delivery date was out of the time frame decided for recruitment were
excluded from the study.
5.7
Data entry
Data entry was done using Epidata version 3.1. Data analysis was done using
Statistical Package of Social Sciences (SPSS 20.0), licensed for use by the
Department of Community Health, Christian medical college, Vellore.
5.8
Data analysis
5.8.1
Descriptive statistics
The sociodemographic characteristics and various other factors of the study
population have been presented using frequency and percentages of categorical
variables and mean for continuous variables The exposure factors are similarly
described.
5.8.2
Risk factor analysis
Bivariate analysis was done to know the association between categorical variables
using Chi square to determine statistical significance. Risk factors with p values less
30
5.8.3
Exposure variables
Baseline sociodemographic correlates, antenatal and birth details, details of
comorbidity, antenatal haemoglobin, postpartum haemoglobin and score obtained on
Edinburgh postpartum depression scale were categorized and analysed to ensure
comparability.
Age of the participants was classified as following groups for analysis,
a. 18-20 years
b. 21-23 years
c. 24-26 years
d. 27-29years
e. 30-32 years
f. 33-35 years
g. >=36 years
The median age of the participants which was 24 was used to categorize the
participants for bivariate analysis.
Age at marriage of the participants was classified as
a. <18 years
b. 18-21 years
c. 22-25 years
d. >=26 years
The median age of 21 years was used to categorize the participants for
bivariate analysis.
31 a. No schooling
b. Primary school
c. Middle school
d. High school
e. Intermediate/ Post high school diploma
f. Graduate/ Post graduate
g. Professional or Honours
For bivariate analysis it was categorized as High school and below and
above high school
Occupation of the participant and husband was classified as
a. Homemaker (participant), Unemployed (Husband)
b. Unskilled worker
c. Semiskilled worker
d. Skilled worker
e. Semi professional
f. Professional
For the purpose of bivariate analysis participant’s occupation was
categorized as homemaker and others and participant’s husband’s
occupation was categorized as semiskilled worker and below and
skilled worker and above.
Socioeconomic classification was done based on B G Prasad scale with
income levels updated as of 2017.It was classified as
32 b. Lower middle
c. Middle
d. Upper middle
e. Upper
For the purpose of bivariate analysis, it was categorized into lower and
lower middle and others.
Family type for bivariate analysis was categorized into
a. Joint
b. Nuclear and extended
Parity for bivariate analysis was categorized into
a. Primi
b. Multi
5.8.4
Outcome variables:
Antepartum and postpartum anaemia was classified based on the WHO cut
off of Haemoglobin and categorized as
a. <12 gm/dl- Anaemia present
b. >12 gm/dl- Anaemia absent
Postpartum depression was scored based on Edinburgh postpartum
depression scale cut off score of 9 and was categorized as
a. Score of <8- Depression absent
b. Score of >9- Depression present
Urinary tract infection was taken as infection present if the participant had a
33
Surgical wound site infection, Infection at the episiotomy site, mastitis and
puerperal sepsis were self-reported.
Infections for the purpose of bivariate analysis were categorized as presence
34
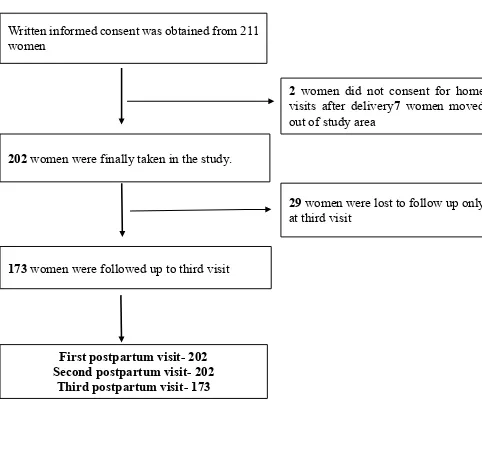
Figure 5.1 Flow Chart showing selection of participants
Written informed consent was obtained from 211 women
202 women were finally taken in the study.
173 women were followed up to third visit
2 women did not consent for home visits after delivery7 women moved out of study area
29 women were lost to follow up only at third visit
First postpartum visit- 202 Second postpartum visit- 202
35
6
Results
A total of 211 women were approached to participate in the study. From which 2
women refused home visits after giving consent and 7 women moved out of the study
area immediately after delivery. The remaining 202 women were followed at 7 days
and 28 days postpartum At the third visit 29 women were not available and hence
173 women were followed up to 42 days.
6.1
Socio demographic characteristics
All the women (100%) recruited into the study were married. None were separated,
divorced or a widow.
Table 6.1.1 Age distribution (n=202)
Age Number Percentage
18-20 20 9.9
21-23 63 31.2
24-26 59 29.2
27-29 34 16.8
30-32 16 7.9
33-35 4 2.0
>36 6 3.0
All the participants were between 18 to 40 years. The median age was found to be 24
36 Figure 6.1 Age of Participant (n=202)
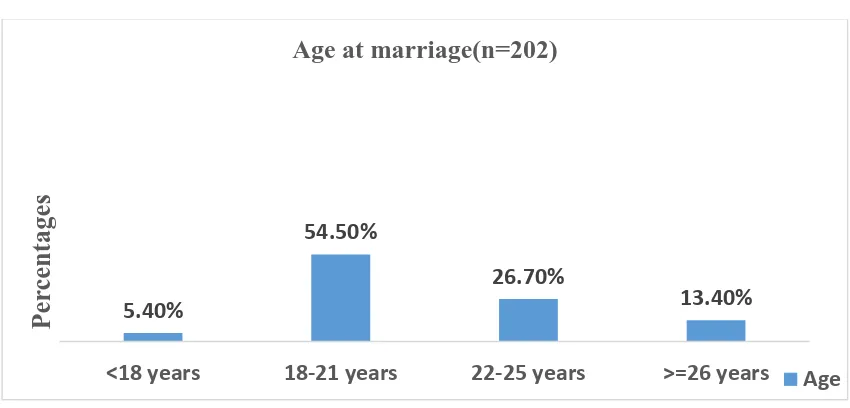
Table 6.1.2 Age at marriage (n=202)
Age at marriage Number Percentage
<18 11 5.4
18-21 110 54.5
22-25 54 26.7
>26 27 13.4
The age at marriage ranged from 15- 30 years with 11(5.4%) women being married
at an age lesser than the legal age of eighteen. The remaining 7 (13.4%) women were
[image:49.595.84.509.569.773.2]married at 26 years and above. The median age at marriage was found to be 21 years.
Figure 6.2 Age at marriage (n=202) 9.90% 31.20% 29.20% 16.80% 7.90% 2.00% 3.00% 18-20 years 21-23 years 24-26 years 27-29 years 30-32 years 33-35 years >=36 years Per ce nta g es
Age ( n = 202)
Age
5.40%
54.50%
26.70%
13.40%
<18 years 18-21 years 22-25 years >=26 years
Per
ce
nta
g
es
Age at marriage(n=202)
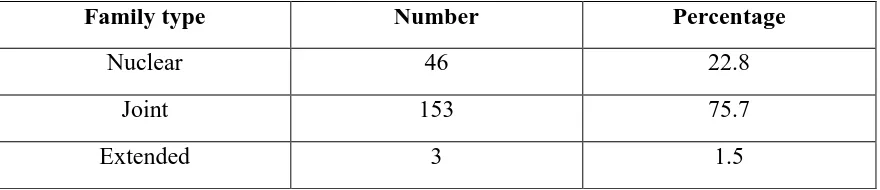
37 Table 6.1.3 Family type (n=202)
Family type Number Percentage
Nuclear 46 22.8
Joint 153 75.7
Extended 3 1.5
Among 202 women, 153 (75.7%) of the participants belonged to joint family. The
[image:50.595.86.528.314.386.2]median family size was found to be 6.
Table 6.1.4 Literacy status (n=202)
Literacy status Number Percentage
Illiterate 4 2.0
Read and write 198 98.0
Among 202 women, 198 (98%) of the women could both read and write. However,4
(2%) of them were illiterate.
Table 6.1.5 Educational status of the participant (n=202)
Education Number Percentage
No schooling 4 2.0
Primary school 7 3.5
Middle school 35 17.3
High school 83 41.1
Intermediate/Post high
school diploma 27 13.4
Graduate/Postgraduate 44 21.8
[image:50.595.85.526.496.694.2]38
The education qualification of the participant was based on the groupings as provided
by the modified Kuppuswamy classification scale. Out of the total participants, 4 (2
%) of them did not receive any formal schooling. The highest education attained was
high school by 83 women (41.1%), 35 (17.3%) had attained up to middle school and
7 (3.5%) up to primary school. There were women who were educated above high
school with a post high school diploma being 27(13.4%), up to graduate/ postgraduate
[image:51.595.83.526.321.523.2]level being 44(21.8%) and professional/honours of 2 (1%).
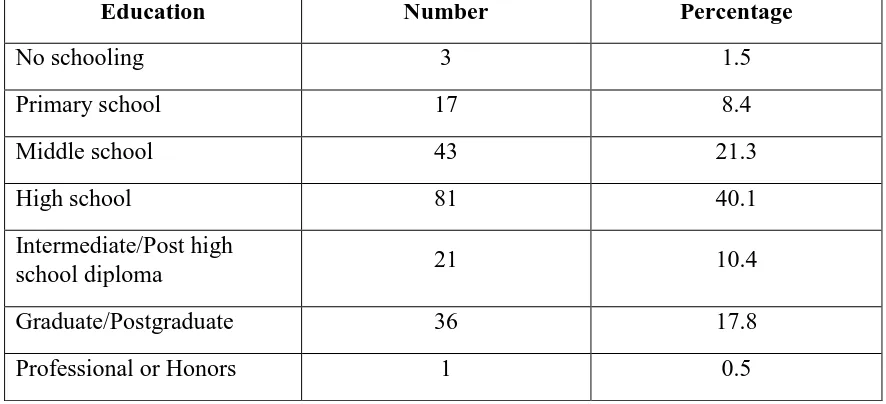
Table 6.1.6 Educational status of the participant’s husband (n=202)
Education Number Percentage
No schooling 3 1.5
Primary school 17 8.4
Middle school 43 21.3
High school 81 40.1
Intermediate/Post high
school diploma 21 10.4
Graduate/Postgraduate 36 17.8
Professional or Honors 1 0.5
The education qualification of the participant’s husband was based on the groupings
as provided by the modified Kuppuswamy classification scale. This showed a similar
distribution pattern as that of the participants with 3 (1.5 %) of them not receiving
any formal schooling,17 (8.4%) attained up to primary school,43 (21.3%) had
attained up to middle school and remaining 81 (40.1%) had attained high school.
Women whose husbands were educated above high school with a post high school
diploma were a total of 21 (10.4%), up to graduate or postgraduate level were 36
39 Figure 6.3 Educational status (n=202)
Table 6.1.7 Occupation of the participants (n=202)
Occupation Number Percentage
Homemaker 185 91.6
Unskilled worker 3 1.5
Semiskilled worker 1 0.5
Skilled worker 2 1.0
Semi professional 5 2.5
Professional 6 3.0
Occupation of the participants was based on the classification provided by modified
Kuppuswamy classification scale. Most women were homemakers 185 (91.6%). 1.50%
8.40%
21.30%
40.10%
10.40%
17.80%
0.50%
2% 3.50%
17.30%
41.10%
13.40%
21.80%
1.00%
Per
ce
nta
g
es
Educational status(n=202)
40
Table 6.1.8 Occupation of the participant’s husband (n=202)
Occupation Number Percentage
Unemployed 1 0.5
Unskilled worker 39 19.3
Semiskilled worker 39 19.3
Skilled worker 51 25.2
Clerical/Shop
owner/Farmer 30 14.9
Semi professional 21 10.4
Professional 21 10.4
Occupation of the participant’s husband was based on the classification provided
modified Kuppuswamy classification scale. Only 1(0.5%) of the men was
unemployed. The highest proportion of 51 (25.2%) men were skilled workers, 78
(38.6%) men were unskilled and semiskilled workers and 30 (14.9%) men were either
shop owners or farmers. Remaining 21 (10.4%) were professionally and
semi-professionally employed.
Table 6.1.9 Socioeconomic class of participants (n=202)
SES class Number Percentage
Lower 29 14.4
Lower middle 90 44.6
Middle 42 20.8
Upper middle 30 14.9
Upper 11 5.4
Socioeconomic scores of the study participants were calculated based on B G Prasad
2017 classification, which takes into account per capita income. The per capita
41
found to be Rs. 1,666. Among the participants, 29 (14.4%) belonged to lower class ,
90 (44.6%) belonged to lower middle class , 42 (20.8%) belonged to middle class, 30
(14.9%) belonged to upper middle and rest 11 (5.4%) belonged to upper class. The
[image:54.595.86.534.217.519.2]highest proportion was seen among those of lower middle class.
Figure 6.4 Socioeconomic class (n=202)
14.40%
44.60% 20.80%
14.90% 5.40%
Socioeconomic class(n =202)
42
Table 6.1.10Summary table of Sociodemographic characteristics (n= 202)
Characteristic Number Percentage
Marital Status Married 202 100
Age
< 24 Years 83 41.1 >24 Years 119 58.9
Age at marriage
< 21 Years 96 47.5 >21 Years 106 52.5
Type of family
Joint 153 75.7
Nuclear and Extended 49 24.3
Literary Status
Illiterate 4 2.0
Literate 98 98.0
Education of participant
High School and below 129 63.9 Above High School 73 36.1
Education of
participant’s husband
High School and below 144 71.3
Above High School 58 28.7
Occupation of participant
Homemaker 185 91.6
Others 17 8.4
Occupation of
participant’s husband
Semi-skilled worker and below
79 39.1
Skilled worker and above 123 60.9
Socioeconomic Status
Lower class 29 14.4
43
[image:56.595.85.525.140.536.2]6.2
Obstetric history and past history of illness
Table 6.2.1. Gravida (n =202)
Gravida Number Percentage
1 55 27.2
2-3 132 65.3
>3 15 7.4
Table 6.2.2 Parity (n=202)
Parity Number Percentage
0 72 35.6
1 99 49.0
2-3 30 14.9
>3 1 0.5
Table 6.2.3 Number of living children (n=202)
Living children Number Percentage
0 72 35.6
1 103 51.0
2-3 27 13.4
There were 55 (27.2%.) women who had conceived for the first time. Total of 72
(35.6%.) were primiparous and remaining 130 (64.4%) were multiparous.
Among the multiparous women, 103 (51.0%) had only one living child and 27
44
Table 6.2.4 Distribution of previous poor outcomes (n=147)*
Outcome Number Percentage
No previous poor outcome* 82 55.7
Abortion 57 32.8
Still birth 4 2.7
Early neonatal death 4 2.7
Under 5 death 4 2.7
*Gravida 1= 55 women had conceived for the first time, hence were excluded from the analysis
Out of the 147 women, 82 (55.7%) had no previous poor outcome, 57 (32.8%) women
had abortions in the past, 4 (2.7%) had a previous still birth, 4 (2.7%) had a previous
early neonatal death and remaining 4 (1.9%) had under 5 child death.
Table 6.2.5 History of chronic illness (n =202)
Number Percentage
Present 11 5.4
Absent 191 94.6
Table 6.2.6 Type of chronic illness (n =202)
Chronic illness Number Percentage
Hypothyroidism 8 4.0
Bronchial Asthma 2 1.0
Heart disease 1 0.5
Total of 191 (94.6%) did not have any comorbidity. Among the rest ,11 (5.4%) had a
coexisting comorbidity from which 8(4%) had hypothyroidism, 2 (1 %) had bronchial
asthma and 1 (0.5%) had history of heart disease. None of the participants had more
45
Table 6.2.7 Family history of psychiatric illness (n=202)
Psychiatric illness Number Percentage
Present 7 3.5
Absent 195 96.5
Family history of psychiatric illness was enquired. Only 7 (3.5%) women had a
family history of psychiatric illness.
[image:58.595.82.529.322.417.2]6.3
Characteristics of current pregnancy and delivery
Table 6.3.1 Risk factors in current pregnancy (n = 202)
Risk factors Number Percentage
Absent 103 50.9
Only1 risk factor 80 39.6
>1 risk factor 19 9.4
Table 6.3.2 Type and frequency of risk factors (n = 202)
Risk factor Number Percentage
Anaemia(n=199)* 105 52.7
Gestational diabetes
mellitus 23 11.4
Gestational hypertension 8 4.0
Polyhydramnios 8 2.0
Oligohydramnios 7 3.5
Hepatitis B positive 4 2.0