A STUDY ON ASSOCIATION OF THYROID
FUNCTION AND FRAILTY IN ELDERLY
submitted in partial fulfillment of the regulations
M.D., IN GERIATRIC MEDICINE
THE TAMILNADU DR.M.G.R. MEDICAL UNIVERSITY
DEPARTMENT OF GERIATRIC MEDICINE
MADRAS MEDICAL COLLEGE
DISSERTATION ON
A STUDY ON ASSOCIATION OF THYROID
FUNCTION AND FRAILTY IN ELDERLY
submitted in partial fulfillment of the regulations
for the award of the degree of
M.D., IN GERIATRIC MEDICINE
BRANCH – XVI
THE TAMILNADU DR.M.G.R. MEDICAL UNIVERSITY
CHENNAI
DEPARTMENT OF GERIATRIC MEDICINE
MADRAS MEDICAL COLLEGE
CHENNAI – 600003
MAY 2018
A STUDY ON ASSOCIATION OF THYROID
FUNCTION AND FRAILTY IN ELDERLY
submitted in partial fulfillment of the regulations
M.D., IN GERIATRIC MEDICINE
THE TAMILNADU DR.M.G.R. MEDICAL UNIVERSITY
CERTIFICATE
This is to certify that the dissertation titled “A STUDY ON
ASSOCIATION OF THYROID FUNCTION AND FRAILTY
IN ELDERLY” is the bonafide work done by
Dr. ARULMOZHISELVAN.V, Post Graduate Student, Department of
Geriatric Medicine, Madras Medical College, Chennai – 600003, in
partial fulfilment of the University rules and regulations for the award of
MD DEGREE in GERIATRIC MEDICINE BRANCH – XVI, under
our guidance and supervision, for the examination to be held on
May 2018.
Prof. Dr.G.S.SHANTHI, M.D.(Geriatrics), Professor and Head,
Department of Geriatric Medicine,
Madras medical college,
Rajiv Gandhi Govt. General Hospital
Chennai – 600003
Prof. Dr. R.NARAYANABABU, M.D., D.C.H., Dean
Madras medical college,
Rajiv Gandhi Govt. General Hospital
DECLARATION
I solemnly declare that this dissertation titled “A STUDY ON
ASSOCIATION OF THYROID FUNCTION AND FRAILTY IN
ELDERLY” was done by me at Madras Medical College, Chennai –
600003,during the period February 2017 to July 2017 under the guidance
and supervision of Prof. Dr.G.S.SHANTHI, M.D.(Geriatrics), to be
submitted to the The TamilnaduDr.M.G.R. Medical University, towards
the partial fulfilment of requirements for the award of MD DEGREE IN
GERIATRIC MEDICINE BRANCH – XVI.
Place : Chennai Dr. ARULMOZHISELVAN.V,
Date : MD GERIATRIC MEDICINE,
Post Graduate Student,
Department of Geriatric Medicine,
Madras Medical College,
Rajiv Gandhi Govt. General Hospital
ACKNOWLEDGEMENT
I thank Prof. Dr.R.NARAYANABABU, M.D., D.C.H., Dean, Madras
Medical College, for permitting me to conduct the study and use the hospital
resources in the study.
I express my heartfelt gratitude to Prof. Dr.G.S.SHANTHI,
M.D.(Geriatrics), Professor and Head, Department of Geriatric Medicine, for her inspiration, advice and guidance in making this work complete.
I also extend my sincere thanks to Prof. Dr.S.DEEPA, M.D., Associate
Professor, Department of Geriatric Medicine for guiding me duringthe study
period.
I am extremely thankful to Dr.K.UMA KALYANI, M.D., D.Diab.,
Assistant Professor, Dr.M.SENTHIL KUMAR, M.D., AssistantProfessor,
Dr.D.THANGAM, M.D., Assistant Professor and Dr.C.PRIYA MALINI, M.D., D.Diab., Assistant Professor, Department of GeriatricMedicine, for guiding me during the study period.
I thank my friend Dr.PADMANABAN, M.D., Biochemistry who has
helped me throughtout the study.
I thank our physiotherapists who has helped me in data collection.
I also thank all the postgraduate students, my colleagues and
paramedical staffs for their cooperation which enormously helped me in this
study. I am also indebted to thank all the patients and their caring relatives,
without whom this study would not have been possible.
LIST OF ABBREVIATIONS AND SYMBOLS
TSH Thyroid Stimulating Hormone
fT4 Free Thyroxine
fT3 Free Triiodothyronine
UN United Nations
US United States
SRS Sample Registration System
WHO World Health Organisation
ATP Adenosine TriPhospate
MVO2 Max Maximal Oxygen Consumption
RMR Resting Metabolic Rate
ADL Activities of Daily Living
SHARE Survey of Health, Ageing and Retirement in Europe
↑ Increase
↓ Decrease
→ Leads to
↔ No change / equivocal
ROS Reactive Oxygen Species
TNF-α Tumor Necrosis Factor-α
PUFA Poly Unsaturated Fatty Acids
CP-II CarnitinPalmitoylTransferaseII
ALT Alanine Transaminase
HDL High density Lipoprotein
BNP Brain Natriuretic Peptide
S.D. Standard Deviation
DHEA DeHydroEpiAndrosterone sulphate
Vit D Vitamin D
GH Growth Hormone
IGF-1 Insulin like Growth Factor
CNS Central nervous System
CNTF CiliaryNeuroTrophic Factor
DM Diabetes Mellitus
CCF Congestive Cardiac Failure
LH Lutenising Hormone
FSH Follicle Stimulating Hormone
T Testosterone
E Estrogen
WBC White Blood Corpuscles
CD Cluster Differentiation
CCR5 C-C Chemokine Receptor 5
Il-6 Interleukin -6
CHS Cardiovascular Health Study
TUG Timed Up and Go test
SPPB Short Physical Perfomance Battery
SOF Study of Osteoporotic Fracture
BGS British Geriatric Society
GEM Geriatric Evaluation & Management
CGA Comprehensive Geriatric Assessment
PACE Program for All Inclusive Care for the Elderly
RAA Renin Angiotensin Aldosterone System
Vit-C Vitamin C
Ab Antibody
MIT MonoIodoThyronine
DIT DiIodoThyronine
TRH Thyrotrophin Releasing Hormone
TBG Thyroxine Binding Globulin
TTR Transthyretin
TRE Thyroid hormone Receptor Response Element
DNA Deoxyribo Nucleic Acid
RXR Retinoid X receptor
TR Thyroid hormone Receptor
CoA Co-Activator
Co-R Co-Repressor
mRNA Messenger Ribo Nucleic Acid
Na+ Sodium
K+ Potassium
Na+K+ ATPase Sodium Potassium Adenosine TriPhosphatase
FFA Free Fatty Acids
TGL Triglycerides
LDL Low Density Lipoprotein
BP Blood Pressure
MAP Mean Arterial Pressure
O2 Oxygen
CO2 Carbon di oxide
NHANES II National Health and Nutrition Examination Survey
Ca-ATPase Calcium ATPase
Na-K pump Sodium Potassium Pump
N Number of Samples
CKD Chronic Kidney disease
BA Bronchial Asthma
CAD Coronary Artery Disease
CVA Cerebro Vascular Accident
CLIA ChemiLuminescentImmuno Assay
CES Center for Epidemiologic Studies
PASE Physical Activity Scale for Elderly
BMI Body Mass Index
SPSS Statistical Package for the Social Sciences
Std. Standard
Ft. Feet
Kg Kilogram
MrOS study Osteoporotic Fractures in Men Study
WHAS study Women’s Health and Aging Study
inCHIANTI
LIST OF FIGURES
Figure 1 Percentage distribution of population aged 65 and over by region:
2015 and 2050
Figure 2 Hypothesized levels of the syndrome of frailty(
Figure 3 Vicious Cycle of Energetic Frailty(1)
Figure 4 Phenotypic and index method
Figure 5 Mechanisms of sarcopenia
Figure 6 Hormones and frailty
Figure 7 Inflammatory and immunologic changes and frailty
Figure 8 Metabolic Causes of Frailty
Figure 9 Other risk factors for fraility
Figure10 Frailty trajectory
Figure 11 Thyroid hormones formation & secretion
Figure 12 Thyroid hormones structure
Figure 13 Regulation of thyroid hormone secretion
Figure 14 Thyroid hormone action
LIST OF CHARTS
Chart 1 Decadal growth in elderly population in relation to that of general
population
Chart 2 Vulnerability of frail elderly people to a sudden, change in health
status after a minor illness
Chart 3 Pathway towards frailty, disability and death.
Chart 4 Age distribution in total
Chart 5 Sex distribution in total
Chart 6 Frequency distribution of frailty phenotype categories
Chart 7 Prevalence of individual components of frailty phenotype criteria
Chart 8 Frequency distribution of individual components of frailty phenotype
Chart 9 Frequency distribution no. Of components of frailty phenotype
Chart 10 Median age of study groups
Chart 11 Age distribution among the study groups
Chart 12 Sex distribution among the study groups
Chart 13 Median bmi of study groups
Chart 14 Bmi distribution among the study groups
Chart 15 Median hand grip of study groups
Chart 16 Median 15 ft walking time of study groups
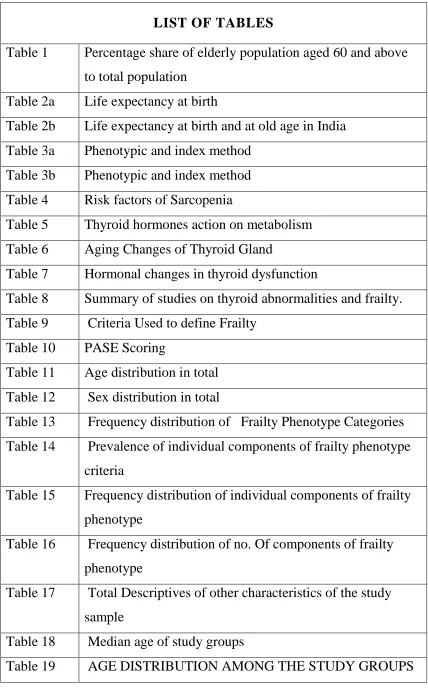
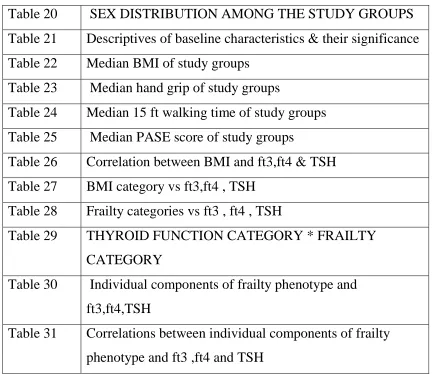
LIST OF TABLES
Table 1 Percentage share of elderly population aged 60 and above
to total population
Table 2a Life expectancy at birth
Table 2b Life expectancy at birth and at old age in India
Table 3a Phenotypic and index method
Table 3b Phenotypic and index method
Table 4 Risk factors of Sarcopenia
Table 5 Thyroid hormones action on metabolism
Table 6 Aging Changes of Thyroid Gland
Table 7 Hormonal changes in thyroid dysfunction
Table 8 Summary of studies on thyroid abnormalities and frailty.
Table 9 Criteria Used to define Frailty
Table 10 PASE Scoring
Table 11 Age distribution in total
Table 12 Sex distribution in total
Table 13 Frequency distribution of Frailty Phenotype Categories
Table 14 Prevalence of individual components of frailty phenotype
criteria
Table 15 Frequency distribution of individual components of frailty
phenotype
Table 16 Frequency distribution of no. Of components of frailty
phenotype
Table 17 Total Descriptives of other characteristics of the study
sample
Table 18 Median age of study groups
Table 20 SEX DISTRIBUTION AMONG THE STUDY GROUPS
Table 21 Descriptives of baseline characteristics & their significance
Table 22 Median BMI of study groups
Table 23 Median hand grip of study groups
Table 24 Median 15 ft walking time of study groups
Table 25 Median PASE score of study groups
Table 26 Correlation between BMI and ft3,ft4 & TSH
Table 27 BMI category vs ft3,ft4 , TSH
Table 28 Frailty categories vs ft3 , ft4 , TSH
Table 29 THYROID FUNCTION CATEGORY * FRAILTY
CATEGORY
Table 30 Individual components of frailty phenotype and
ft3,ft4,TSH
Table 31 Correlations between individual components of frailty
TABLE OF CONTENTS
Sl.no. CONTENTS Page no.
1 INTRODUCTION 1
2 AIM AND OBJECTIVES 5
3 REVIEW OF LITERATURE 6
4 MATERIALS AND METHODS 63
5 RESULTS 71
6 DISCUSSION 99
7 STRENTHS AND LIMITATIONS 103
8 CONCLUSION 104
9 BIBLIOGRAPHY
10 PROFORMA
11 INFORMATION SHEET
12 CONSENT FORM
13 ETHICAL COMMITTEE APPROVAL FORM
14 URKUND ANALYSIS RESULT
15 ANTI PLAGIARISM CERTIFICATE
16 ANNEXURES
a) QUESTIONNAIRE FOR PASE
(PHYSICAL ACTIVITY SCALE FOR ELDERLY)
b) ACTIVITY CATEGORIES FOR PASE
c) TO COMPUTE A PASE SCORE:
d) SOF CRITERIA FOR FRAILTY
e) CLINICAL FRAILTY SCALE
f) PRISMA-7 QUESTIONNAIRE
g) EDMONTON FRAIL SCALE
1
INTRODUCTION
Worldwide the elderly population growth is remarkably increasing
due to improvement in life expectancy, better availability of Basic Health
Care services and advanced medical care and improvement in socio
economic status. According to 2011 Census the share of population aged
≥60 years is 8% in India and in Tamilnadu it is 10.5%(3).
William Shakespeare in his work “as you like it; act II, scene VII”
said, “the SIXTH age shifts into the lean and slipper'd Pantaloon, With
spectacles on nose and pouch on side; his youthful hose, well sav’d, a
world too wide for his shrunk shrank; and his big manly voice, Turning
again toward childish treble, pipes and whistles in his sound”(4). Aging is
an inevitable event after birth. Surprisingly the fastest growing section of
most population, worldwide is the oldest old i.e., those aged >= 80 yrs.
and above, especially in developing countries like India and China. Not
everyone can age successfully.
According to Dorothy Thompson, “age is not measured by years.
Nature does not equally distribute energy some people are born old and
tired while others are going strong at 70”(5). There is heterogeneity in the
aging process and it varies from individuals to individuals(6). Meanwhile
some underlying genetic and environmental factors will lead a proportion
2
disability, decreased functional capacity, decline in cognition and will
disengage them with life due to complex mechanisms(6–8).
As a novel attempt, to explain the heterogeneity of aging in elderly
population, the concept of frailty has evolved and the conceptual
knowledge about frailty is vital for clinical practitioners and policy
makers(9).The term “Frailty” is used to characterise the weak and
vulnerable subgroups of older adults(10)(11). Frailty is a compelling
concept and it forms the central core of geriatric medicine.
Frailty is a specific entity and is described in Literature as a
“biological syndrome of increased vulnerability to adverse health
outcomes which has been triggered by minor stressors due to poor
resolution of homeostasis as a consequence of age-related decline across
many physiological systems(12).” It can be shortly said as “an expression
of the lack of adaptive capacity of the organism(13)”. So the elderly frail
are visibly more vulnerable, withdrawn, unsteady and weak due to less
efficient network of homeostasis and they are at increased risk of adverse
outcomes like disability, dependence, recurrent hospitalization,
institutionalization, falls, injuries, and acute illness, delayed recovery
from illness, delirium, iatrogenesis & decreased survival. The condition
“Frailty” can exist independently of age, disability and chronic diseases
3
systems(11). Although the general tendency for older adults is to get
worse than to improve, there is evidence that frailty can be resisted &
older people can regain at least some functioning i.e., it can be reversed
or delayed(14)(15). The cornerstone of geriatric medicine concerns the
early identification, evaluation and treatment of frail elderly and
prevention of loss of independence and disability. However little is
known about the development and progression of frailty.
Neuromuscular, endocrine, inflammatory & immunologic changes
which occur with aging, oxidative stresses have been implicated in the
genesis and progression of frailty. Body composition which in turn is
determined by lean body mass (muscle mass & visceral organs) plays a
vital role in the health of elderly. Muscle mass & strength are decreased
in thyroid disorders like hyperthyroidism (thyrotoxic myopathy) and
hypothyroidism (muscle weakness).
Moreover, the symptoms of hyperthyroidism (weight loss, muscle
weakness, exhaustion) and hypothyroidism (muscle weakness, fatigue,
reduced muscle strength, loss of appetite) have resemblance to that of
frailty phenotype. However these symptoms are often overlooked in
elderly. Also Subclinical dysfunctions of thyroid are common in elderly
and patients with subclinical thyroid dysfunction don’t manifest these
4
Subclinical thyroid dysfunctions have been associated with various
adverse health outcomes(16–22). All these adverse outcomes might have
direct or indirect relationship with frailty. Hence we propose this study to
investigate into the relationship between thyroid function and frailty in
elderly individuals by hypothesizing that slight differences in thyroid
hormones and TSH in elderly individuals are associated with frailty and if
significant relationship is found to have existed, it helps in management
5
AIMS AND OBJECTIVES
AIM:
To investigate into the relationship between Thyroid Function and
Frailty in elderly.
OBJECTIVES:
By simple random sampling, selecting 200 patients and categorize
them as frail, intermediate/pre-frail, non-frail/robust by applying Fried's
Frailty Phenotype criteria.
1) To find the prevalence of Frailty in OP and IP patients attending a
tertiary care centre.
2) To do Thyroid Function Test to find association between fT4,
fT3,TSH levels and Frail, Pre-frail, Robust/Non-frail Category.
3) To find correlation between fT4, fT3, TSH and individual
6
REVIEW OF LITERATURE
DEFINITION OF ELDERLY
Definition of elderly is arbitrary. There is no standard United
Nations numerical criterion. However “the cut-off of 60 years and above
is agreed by UN for defining elderly.” >65 years of age is considered by
most developed countries to define the older population
(23).Conventionally, “the chronological age of 65 years and above is
depicted as the Cut-off for elderly(24).” National policy on Older persons
defines “Elderly as the citizens who have crossed the age of 60 years and
above in India(25).”
DEMOGRAPHICS OF ELDERLY
Global Scenario
At a faster rate, the global population is growing old, owing to
decreased fertility, improving health and longevity. Remarkably, there is
great rise in elderly population at never before seen rate. 562 million
people (8%) constituted the elderly population >65 years, when world
population reaches 7 billion in 2012. 3 years after the elderly population
rose by 0.5% i.e., 617 million, 8.5% of total population. This rising trend
7
generations post world war and also due to a novel increase of elderly
population in Latin America and Asia(26).
Japan remains as the World’s oldest country because 26.6% of
Japan’s population are above the age of 65.The Graying nations
succeeding Japan are Germany, Italy, Greek and many other European
countries. By 2050, the older population aged 65 and above is estimated
to be 39% of the total population in Japan and the world will continue to
view Japan as the oldest country. The other Graying nations estimated to
be the successors of Japan in order are South Korea (35.9%), Hong Kong
(35%), Taiwan (34.9%) and other European countries(26).
Variations exist between different countries and countries with
respect to onset and duration of the stages of demographic transition. The
transition was started in the more developed countries like Western and
Northern countries of Europe and Japan in the last century itself and this
transition took decades to complete in many countries. This process of
demographic transition has found its inception in less developed countries
in Latin America and Asia in recent decades. However the transition
8
Figure 1 percentage distribution of population aged 65
and over by region: 2015 and 2050
DEMOGRAPHIC TRANSITION
8.5% of population aged over 65 is expected to increase by 12.1%
in 2030 and 18.8% in 2015 in Asia. From 2015-2050, the oldest
population in 23 Asian countries is estimated to be quadrupled(26). Due
to increasing life expectancy at older ages, Elderly population aged or
over 80, about 126.5 million globally in 2015 is going to be tripled
around 446.6 million(28).
The oldest old (80 and above) are different from rest of the older
population and are likely to have problems which needs long-term care.
More public resources will be consumed by them and there will be a
9
By 2020, elderly population is going to be more than children
under age 5 populations historically for the first time. In 2050, the
proportion of world’s population aged 65 and above is estimated by UN
to be doubled from 7.6% presently to 16.2% (28).
China and India, the two population giants are in different path of
aging mainly because of varied fertility trends and methods of family
planning. China’s share of older population aged 65 and above is 10.1%
whereas India shares only 6 percent and the share by China is expected to
double by 2030 to 238.8 million (17.2%) of Total Population.
Indian Scenario
As per census 2011, India’s total population was 1210.9 million
with elderly above 60 years contributes 8.6% to total population i.e.
around 103.9 million with 51.1 million are elderly males (8.2%) and 52.8
million are elderly females (9%) with respect to residence, the proportion
of rural elderly population was 8.8%. In urban areas it was 8.1
10
Table 1 Percentage share of elderly population aged 60 and above to total population(30)
Census Person Male Female Rural Urban
1961 5.6 5.5 5.8 5.8 4.7
1971 6.0 5.9 6.0 6.2 5.0
1981 6.5 6.4 6.6 6.8 5.4
1991 6.8 6.7 6.8 7.1 5.7
2001 7.4 7.1 7.8 7.7 6.7
2011 8.6 8.2 9.0 8.8 8.1
The percentage share of elderly to total population of India since
1961 rose by 3 percent in 2011 and this proportion of elderly is projected
11
Chart 1 Decadal growth in elderly population in relation to that of
general population (28)
Till 2001, there is a decreasing trend in the decadal growth in
elderly population like that of general population. In the last one decade
(2001-2011), the growth in elderly population rose to 36 percent from 25
percent in the earlier decade.
According to population census 1991, the elderly males exceeded
in number than that of elderly females. Interestingly reversal of trend has
been observed. The female elders outnumbered the male. Comparing to
elderly male, elderly females are more vulnerable which policy makers
12
State Wise Scenario
According to census 2011, South Indian State Kerala has the
highest proportion of elderly aged 60 and above (12.6%).Following
Kerala, Goa has 11.2% and Tamilnadu has 10.4%.The increased
proportion in these states is because of the declining fertility increasing
longevity and better medical facilities available. North East States like
Meghalaya, Arunachal Pradesh have less than 5% of elderly
population(31)
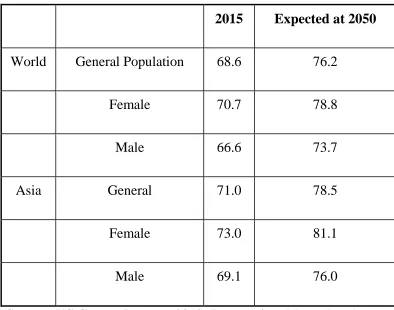
[image:28.595.117.511.402.712.2]Life Expectancy at Birth
Table 2alife expectancy at birth(32)
2015 Expected at 2050
World General Population 68.6 76.2
Female 70.7 78.8
Male 66.6 73.7
Asia General 71.0 78.5
Female 73.0 81.1
Male 69.1 76.0
13
As of 2015, life expectancy at birth is >80 years for 24 countries
with Japan, Singapore, Hong Kong in the leading list.
In United States life expectancy at older ages in 2009 has increased
to 19.1 years from 11.9 years in 1900. Amidst the same period, the life
expectancy at age 80 has increased to 9.1 years from 5.3 years(33). Even
countries, like Afghanistan with lowest life expectancy at older ages are
also projected to see improvement with 11 years to 13 years for male by
2050, 12.1 year to 15 years for female during the same period for Afghan
elderly aged 65 years above(26).
In Indian rural areas, life expectancy at birth has increased to 66.3
years in 2009-2013 from 48 years in 1970-75.Whereas in urban areas the
increase is from 58.9 years to 71.2 years.
LIFE EXPECTANCY
Table 2b life expectancy at birth and at old age in india(34)
India
At Birth At old age
1970-75 2009-2013 1970-75 2009-2013
Rural 48 66.3 13.5 17.5
Urban 58.9 71.2 15.7 19.1
14
In India
Kerala has the highest life expectancy at birth, 71.8 years for men
and 77.8 years for women, followed by Maharashtra and Punjab. Punjab
has the highest life expectancy at the age of 60 years (19.3 years) for
males followed by Himachal Pradesh (18.3 Years) and Kerala (18 years)
and it is lowest for Assam and Madhya Pradesh (15.4 years).For women,
Kerala has the highest life expectancy at the age of 60 years (21.6 years)
and Bihar has the lowest (17.5 years)(30).
The increase in life expectancy is due to falling tobacco use among
male population and decreasing cardiovascular mortality in both male and
female population. Other contributing factors are improvements in
housing, sanitation, nutrition, the control of infectious diseases and
maternal mortality and the advent of antibiotics and vaccination(14).
However, disability free life expectancy is not increasing as fast as
life expectancy in many countries. Hence measures to achieve better
living in addition to longevity have to gain the momentum.
To live with dignity and with optimum health are fundamental
rights of an individual and elderly are no exception. The supreme aim in
elderly care is to maintain their functional status. For this the best strategy
15
there is already established disability) to avoiding the decline of
functional status shortly prevention from disability(35).
There are some questions to answer: Whether disability is
avoidable? Is disability an unavoidable consequence of the aging
process? The available data support the answer that disability can be
avoided (36),(37).
In short, the challenge for the future is to prevent or delay
disability? To face this challenge, the focus should be on the people at
risk. In the past, the people at risk were thought to have chronic diseases
as they are the most common factor in adverse outcomes of health. But
chronic diseases do not seen to be an appropriate predictor in older
people.
By 1980, the concept of frailty found its origin and it’s gaining
acceptance as a predictor of morbidity and mortality. There is no
universally accepted definition of frailty. As per Fretwell statement in
1990, “Frailty in an individual is defined as an inherent vulnerability to
challenge from the environment”. In 1993, according to W.Bortz, “active
life expectancy is threatened by the development of frailty.”
In the mid-to-late 1990s Rockwood and colleagues proposed that
16
performing function of daily living. Later this group developed a Frailty
Index, a longer Clinical Frailty Scale and a brief screening tool known as
frail(10).
DEFINITION OF FRAILTY
Frailty is theoretically defined as a clinically recognizable state of
increased vulnerability resulting from aging- associated decline in reserve
and function across many physiological systems such that the ability to
cope with everyday or acute stressors is compromised(38).
Fried and colleagues defined it “as a biologic syndrome of
decreased reserve and resistance to stressors, resulting from cumulative
decline across multiple physiologic system and causing vulnerability to
adverse outcomes(12).”
As per world report on aging and health, by WHO(39) , “the
definition of frailty remains contested , but it can be considered as a
progressive age-related decline in physiological systems that results in
decreased reserves of intrinsic capacity , which confers extreme
vulnerability to stressors and increases the risk of a range of adverse
17
FRAILTY IS AT THE CORE OF GERIATRIC MEDICINE
Frailty forms the central core of geriatric medicine(38) for the
following reasons
Frail elders are at risk for adverse outcomes of health like
disability, dependency, institutionalization, injuries, falls, poor
tolerance to hospitalization and invasive procedures, acute illness,
prolonged recovery from illness or hospitalization and the
mortality rate is being high in these individuals. And there is high
risk of iatrogenicity.
They are in high need of health care resources.
Caring those at risk people needs increased costs and it consumes
time and the caring requires special expertise skills.
The prevalence of frailty increases with increase in age.
Severity of Frailty spans from subclinical to a clinical stage to
impending death and it underlies the heterogeneity of health status
in elderly.
With increasing age, there is increased vulnerability to multiple
18
vulnerability is not explained by changes in recognizable risk
factors and can be attributed to poor homeostatic equilibrium.
Diseases alone or in combination are not enough to explain
functional outcomes in elderly.
Disease independent age related alterations in the reserve and
associated physiologic vulnerabilities is associated with variable
effects to treatments.
Frailty is a condition of impending deterioration in health and
functional status and it requires attention to prevent disability and
other associated outcomes and it needs expert skills to diagnose
intervene frail elders.
In most countries, health care cost, reimbursement is based on
specific diagnostic categorization and treatment and the
reimbursement is not based on presence or absence of frailty or
frailty even in the absence of disease.
But specialized geriatric care (expert care) needs a greater real cost
of caring. Redesign of care and reimbursement will match the needs,
19
THEORIES OF FRAILTY(1)
1) Rockwood posits deficit accumulation theory
According to this, frailty results from accumulation of potentially
unrelated diseases, subclinical dysfunctions and disability across organs,
parts and system of the body. A simple count of all deficits (symptoms,
signs, disease, geriatric conditions, laboratory abnormalities, disabilities)
leads to a close response relationship with mortality.
2) Unique pathophysiologic process
Frailty is due to a primary defect in basic biologic system (energy
production, distribution and utilization) which in turn affects key
physiologic systems (neuroendocrine, inflammatory and immunologic
processes) leading to a short circuit in the homeostatic regulatory network
in which each system have mutual effect on each other and compensate to
a degree when any one is impaired. Compromised homeostasis results in
increased vulnerability to adverse outcomes triggered by minor
20
Figure 2 hypothesized levels of the syndrome of frailty(1)
3) Energetic Pathway of Frailty
Every living cell needs energy for its life and this energy is
acquired in the form of phosphate release from ATP. ATP is stored only
for 6 sec. Neverthless ATP is constantly resynthesized to maintain the
harmony. ATP can be synthesized both by aerobic and anaerobic
pathways. Most energy generated in our body is through aerobic
21
generated in a time unit). Large amount of energy produced is spent in
resting metabolic rate - to maintain homeostatic equilibrium.
Normally, an extra amount of energy is needed for compensatory
mechanisms to balance the unstable homeostasis caused by pathologies
(Homeostatic effort). The remaining energy is spent for cognitive and
physical activities. Elderly who are unhealthy and with chronic disease
have a higher RMR than people of same age and sex. Homeostatic effort
is increased rapidly with health status deterioration and with increasing
work load, the individual starts experiencing fatigue within the range of
energy used for physical activity as most energy is usually spent in
performing basic ADLS and they feel exhausted and ultimately land up in
sedentary existence (decreased physical activity) and in long term the
total amount of energy produced is reduced thereby triggering a vicious
cycle, leading to progressive, accelerated decline in physical
22
Figure 3 Vicious Cycle of Energetic Frailty(1)
OPERATIONAL DEFINITIONS
To provide frail elderly patients the care they used, it is foremost
important to identify Frailty with a proper diagnostic criterion. However
there is no gold standard criterion to define frailty. In an attempt to
standardize the definition of Frailty, Fried et al (2001) proposed the
“phenotypic method(12).” Later Rockwood and colleagues proposed the
23
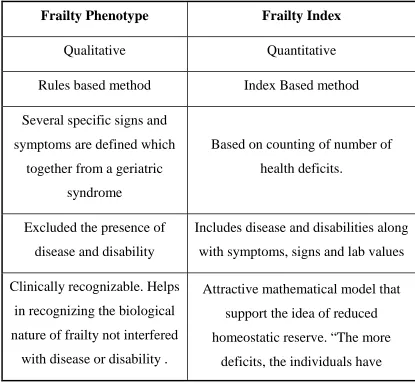
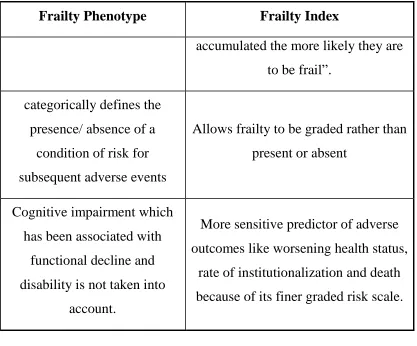
Figure 4 phenotypic and index method
Table 3a phenotypic and index method
Frailty Phenotype Frailty Index
Qualitative Quantitative
Rules based method Index Based method
Several specific signs and
symptoms are defined which
together from a geriatric
syndrome
Based on counting of number of
health deficits.
Excluded the presence of
disease and disability
Includes disease and disabilities along
with symptoms, signs and lab values
Clinically recognizable. Helps
in recognizing the biological
nature of frailty not interfered
with disease or disability .
Attractive mathematical model that
support the idea of reduced
homeostatic reserve. “The more
24
Frailty Phenotype Frailty Index
accumulated the more likely they are
to be frail”.
categorically defines the
presence/ absence of a
condition of risk for
subsequent adverse events
Allows frailty to be graded rather than
present or absent
Cognitive impairment which
has been associated with
functional decline and
disability is not taken into
account.
More sensitive predictor of adverse
outcomes like worsening health status,
rate of institutionalization and death
[image:40.595.115.532.71.417.2]because of its finer graded risk scale.
Table 3b phenotypic and index method
Phenotypic Method Index method
Frailty status is identified by
the occurrence of atleast 3 of
the following 5 phenotypes
1. Unintentional weight loss
2. Poor hand grip strength
3. Self reported
exhaustion(s/o poor
endurance & low energy)
4. Slow gait speed
5. Low physical activity
Frailty status has been marked as a
state at risk caused by accumulation of
deficits, which has been counted and
an index is derived from the
information gathered from
Comprehensive Geriatric Assessment.
Frailty Index =
No. of Deficits in an individual
---
25
Phenotypic Method Index method
Frailty phenotypic method
takes approximately only
10-20 min to ascertain the frailty
status and it might serve as a
basis for detection of frailty
in routine care to predict and
prevent the adverse outcomes.
Biologically rooted and
affords a pathophysiological
understanding of frailty.
Despite it’s a sensitive indicator in
predicting adverse outcomes
individually large no. of information
around 70 items collected and they
make the approach less attractive in
clinical practice and primary care (time
consuming).
Also the inclusion of co-morbidity and
disability in this method impairs the
use of frailty index in prevention.
The diffuse set of impairments
amalgamated by the FI is not amenable
to targeted therapeutic interventions.
Both the above methods have considerable overlap in identifying
frailty and demonstrate a convergence in predicting adverse outcomes.
Those two different models should be considered complimentary in the
evaluation of the older person.
Regardless of the definition, literature shows that frail elderly
persons have changes in the 4 main domains of the aging phenotype
namely body composition, homeostatic dysregulation, energetic failure,
26
EPIDEMIOLOGY
Global epidemiology
There are many epidemiologic studies of frailty and there are
discrepancies in data on frailty prevalence which can be attributed to
different operational definitions of frailty inclusion or exclusion criteria,
study population and the study setting. Fried’s Frailty phenotypic criteria
or their modifications were used in most studies.
In US, several recent and older community based studies in elderly
population >65 years of age in men and women, depict the prevalence of
frailty to range from 4 to 26% and the prevalence increases with increase
in age i.e., 3 to 7% aged 65-75 years, 20 to 26% >80 years and 1/3 of 90
years are frail(42)(2).
In the SHARE study(43) (the largest survey performed in Europe
and Israel, covering 10 European countries and Israel) the overall
prevalence of Frailty was determined to be 17% ranging from 5.8% in
Switzerland to 27.3% in Spain. The prevalence of Pre-frailty was higher
in Germany (34.6%) and Spain (50.9%).
Prevalence varies according to sex (more in women as women’s
life expectancy is more than men and tends to live longer than men and so
27
Hispanic and African Americans), socioeconomic status (poor education
and poverty are closely associated with frailty)(44).
INDIAN EPIDEMIOLOGY
Only few studies are available to show the prevalence of frailty in
India. The level of frailty was higher in the higher income countries than
the lower income countries which were evident in a study done across 14
countries of higher income status and 6 countries of lower income status
including India. The variability in prevalence between developed and
lower income countries was due to increased life expectancy in wealthier
countries where advanced health care system, social support increase the
longevity of life(86).
A hospital based study of 250 individuals showed the prevalence of
frailty to be 33%(88). Based on frailty Index, cumulative deficit model
comprising about 40 variables, a large population study conducted across
6 countries including India, the prevalence of frailty was found to be
55.5% in India(87).
FRAILTY AND AGING
The definition of Frailty (i.e., a state in which, Dysregulated
multiple system results in decline in functional reserves and increases the
28
which loss of molecular/ cellular functional properties results in
diminished adaptability responses to internal/external stress thereby an
augmented vulnerability to disease and mortality).
Failing homeostasis forms the basis of both. The failure in
homeodynamics in aging process is global whereas the failure of
homeodynamics circles around energy metabolism and neuromuscular
changes(45).
This is evident from the following schematic illustration and it
shows that chronological and biological ages are not synonymous.
Chart 2 Vulnerability of Frail elderly people to a sudden, change in
health status after a minor illness(12)
The blue line represents a fit elderly individual who, after a minor
stressor event such as an infection, has a small deterioration in function
29
individual who, after a similar stressor event, undergoes a larger
deterioration, which may manifest as functional dependency, and who
does not return to baseline homoeostasis. The two horizontal dashed lines
represent the homoeostasis level of functional abilities before the stressor
event.
Frailty is a synergistic, multifactorial, complex phenomenon in
which sarcopenia (or) melting of muscle mass is the central component
and initiator of a circle of frailty. Frailty is self perpetuating.The
development of Frailty results in a negative spiral which further leads to
greater frailty and risk of adverse outcomes like disability, etc.
chart3 pathway towards frailty, disability and death.(2)
Excessive loss of energy and reserves bends ‘‘successful’’ ageing
toward prefrail and frail status, which also can happen due to disease
alone. Green dotted lines depict potential reversibility, which
is more feasible in prefrailty, but is possible even in the disability stage.
30
due to constellation of decrease in energy reserves. Frailty may also be
reversible to a point (green dotted lines) if appropriate steps of prevention
(Primary/ Secondary) are taken. If not intervened, a point of no return is
reached and irreversible disabilities will develop. This idea of continum
of frailty should be taken into account while planning for prevention and
treatment in later and end stage frailty.
Frailty is considered a biological syndrome of decreased
physiological reserve. To understand its casuality, the basic principles of
31
BASIC FRAMEWORK OF FRAILTY(14)figure4
Genetic Factors Environmental Factors
Molecular (or) biological level damage more than as expected in
aging
Physiological system affected and dysregulated
Other factors
1. Poor nutrition 2. Sedentary life style
3. Sarcopenia and its risk factors 4. Neuroendocrine changes with
aging
5. Oxidative stress ↑ed free radicals, ROS, ↓ed Antioxidants.
6. ↑Inflammatory Phenomena 7. ↓Immune mechanism
Compromised network of Homeostasis
Manifestation as Frailty
To be identified at this level and therapeutic interventions to be
planned to prevent adverse outcomes
Failure of compensatory mechanisms even in response to
minor stressful events
Clinically evident as ↓ed functional capacity frail status
Will develop adverse outcomes. Hospitalization → institutionalisation → Disability → can progress upto death
Falls, fear of falling → Hip Fracture
32
A large number of direct, indirect and interacting risk factors are
involved in its causation. Many factors thought to be influential, have yet
to be thoroughly studied and their pathways to be elucidated. The main
links in this process are discussed here.
CELLULAR RESPONSES TO STRESSORS(45)
The cellular responses to stressors involves
1) Apoptosis (by controlled cell death, removes damaged/ aberrant
cells).
2) Senescence (alters the phenotype and blocks further proliferation)
Repair (removes damaged proteins, lipids and organelles and recycles
constitutent parts). Dysregulation of these responses, can contribute to the
failure in homeodynamics seen in frailty.
1) Increased apoptosis → Tissue/ organ atrophy → Weakness
2) Expression of senescent cellular phenotype → Increased
proinflammatory cytokine release →Dysregulated inflammatory
state.
3) Deficits in repair in specific tissue (muscle, nervous, bone) →
Oxidative stress and further damage due to other products of
33
Oxidative Stress
Imbalance among reactive oxygen species, free radicals and
antioxidants lead to oxidative stress and this imbalance stimulate
apoptotic effects of TNF-α and they are thought to be associated with
aging and sarcopenia.
POOR NUTRITION
Poor appetite regulation in elderly and the deficient intake of
multiple nutrients like Vitamin B6, Vitamin B12, Vitamin C, Beta-
Carotene, Selenium, Vitamin E, and PUFA are all independent correlate
with frailty in several studies(46)(47).
Low levels of certain proteins like carnitine, mitochondrial CP-II,
ALT, nutritional markers like HDL Cholesterol, BNP correlate with
frailty(35).
Body composition:
1) Advancing age is linked with profound changes in body
composition and the most remarkable of which is sarcopenia, a
major cause of physical function decay, disability and mortality.
2) Frailty and sarcopenia resembles the problem of the egg and the
34
3) It is unfortunate that a clear defining architecture to accommodate
and study the two conditions, sarcopenia and Frailty has yet to
come.
4) However the two would converge in near future because both
conditions deal with the common subclincal and clinical
manifestations of aging. From a practical view point sarcopenia
may be considered a chief component in the pathway of Road to
Frailty(48).
5) The term “Sarcopenia” is delineated as loss of muscle mass and
decline in muscle function which occurs with aging.
6) Operationally it is described as an appendicular lean body mass <2
S.D. below that of a young healthy population corrected for height
in meters squared(49)
The following are the changes occurring in muscular system with aging
Lean body mass (composed of Muscle & Visceral organs)
decreases steadily from thirties and the % represented by muscle
decline rapidly in late life.
Decrease in muscle mass due to atrophy of muscle fibres (Fast
twitch fibers>Slow twitch fibres) is probably because of
progressive loss of motor neurons.
Fat and fibro connective tissue accumulates inside muscle and it
35
Both decrease in muscle mass and decrease in muscle quality and
function leads to decrements in muscle strength and it contributes to
weakness and decreased functional capacity and loss of independence.
Diminished muscular strength is also a predictor of mortality
independently.
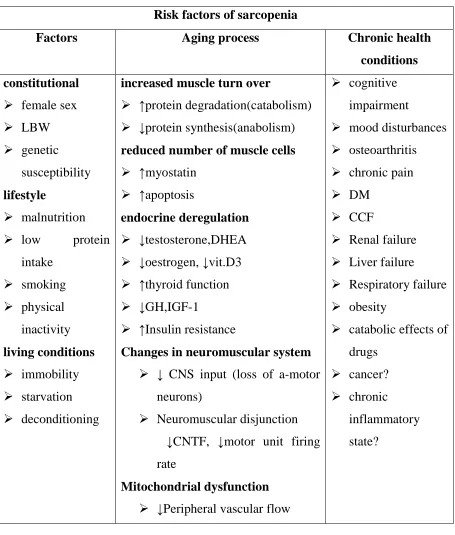
Many candidate mechanisms may lead to sarcopenia, some of
which are portrayed in figure No.5 and Table 4.
36
Table 4 Risk factors of sarcopenia
Risk factors of sarcopenia
Factors Aging process Chronic health
conditions constitutional
female sex
LBW
genetic
susceptibility
lifestyle
malnutrition
low protein
intake
smoking
physical
inactivity
living conditions immobility
starvation
deconditioning
increased muscle turn over
↑protein degradation(catabolism)
↓protein synthesis(anabolism)
reduced number of muscle cells
↑myostatin
↑apoptosis
endocrine deregulation
↓testosterone,DHEA
↓oestrogen, ↓vit.D3
↑thyroid function
↓GH,IGF-1
↑Insulin resistance
Changes in neuromuscular system
↓ CNS input (loss of a-motor
neurons)
Neuromuscular disjunction
↓CNTF, ↓motor unit firing
rate
Mitochondrial dysfunction
↓Peripheral vascular flow
cognitive
impairment
mood disturbances
osteoarthritis
chronic pain
DM
CCF
Renal failure
Liver failure
Respiratory failure
obesity
catabolic effects of
drugs
cancer?
chronic
inflammatory
state?
Most sarcopenic individual have lost fat as well. However a subset
of individuals remain fat whicle losing muscle mass. These individuals
37
“Myosteatosis”- the infiltration of fat into muscle appears to be a separate
condition related to insulin resistance. Longitudinally, those sarcopenic
obese individuals have been found to be the most likely to develop future
disability and mortality.
Other changes in Body composition(40)
Though the fat mass increases in middle age and declining in late
life, the visceral fat continues to accumulate and it increases the waist
circumference across life span.
Fibroconnective tissue also increases in multiple organ systems. In
bony tissue, bone strength is decreased due to progressive
demineralization and modification of bony architecture and so the
fracture risk is augmented. Due to influence of gonadal hormones and
peak bone mass, there are sex differences in bony strength.
HORMONAL CHANGES(50)
Via the hypothalamus- Pituitary axis, the neural system and the
endocrine system are linked and through the signaling action of a series
of homeostatic hormones they control the metabolism and energy
utilization.
The 3 main endocrine changes occurring with aging which are
38
1) ↓in GH levels →↓ in IGF-1 production by liver.
2) ↓in Estrogen and Testosterone →↑ release of LH & FSH 3) ↑ in Cortisol Secretion + ↓ in DHEA production
Other proposed hormonal changes implicated in the genesis of
[image:54.595.120.514.264.642.2]Frailty are all in its infancy level.
Figure 6Hormones and frailty
T _ testosterone; E _ estrogen; GH _ growth hormone; IGF-1 _
insulin growth factor 1; DHEA _ dehydroepiandrosterone; Vit D _
39
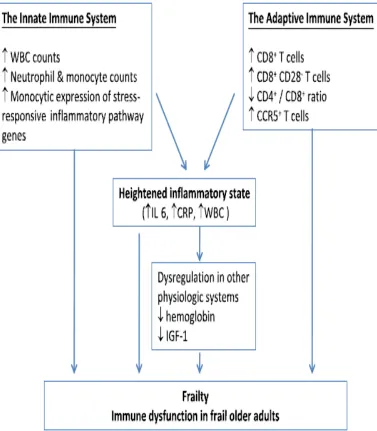
[image:55.595.121.498.163.594.2]Inflammaging and immune system alterations in frailty(51).
40
[image:56.595.116.539.145.594.2]Metabolic Causes of Frailty(49)
41
[image:57.595.112.527.148.532.2]Other risk factors for fraility(49)
Figure 9 Other risk factors for fraility
FRAILITY AND DISABILITY
The terms disability, co-morbidity were considered synonymous
previously. Now they should be regarded as separate clinical entity
although interrelated.
Disability is considered as difficulty or dependency in carrying out
42
or several disease in combination. The two key factors which differential
frailty from disability are
1) Disabilty can result from dysfunction of single or multiple systems.
Whereas frailty is always due to multisystem contributions.
2) Disability is not necessarily associated with instability whereas for
frailty, instability is intrinsic.
Frailty is not the stage prior to disability, rather it predisposes to
stage of disability. Disability can follow from a previous stage of
robustness or from the stage of frailty or from the previous state of
dependency which is deteriorating(35).
Similarly frailty can head away to disability or recover to previous
level of functional status or be maintained.
FRAILTY AND COMORBIDITIES
Not all older adults with co-morbid diseases are frail. Also not all
frail elderly people have multiple co-morbid diseases. This is evident
from CHS in which 67.7% frail elderly had multimorbidity among the 9
diseases considered. However only 9.7% of older adults with
multimorbidity were frail. It suggests that frailty may be caused either
43
involved in chronic diseases which have reached a severe or advanced
state(52).
[image:59.595.126.508.235.546.2]Frailty Trajectory(53)
Figure 10 frailty trajectory
IDENTIFICATION OF FRAILTY STATUS
To avoid the development of disability, frailty status has to be
identified in its earlier course to implement strategies for prevention and
44
USE OF BIOMARKERS(2)
A biomarker is defined as “A characteristic that is objectively
measured and evaluated as an indicator of normal biological process,
pathogenic process or pharmacologic responses to a therapeutic
intervention”.
Functional, biological (laboratory variables), imaging, related
parameters may be considered as biomarkers.
Some of the currently proposed biomarkers are
1) Physical performance and muscle strength measures (Gait speed
and Grip strength).
2) Body composition measures (Appendicular mass and
anthropometry values).
3) Inflammatory markers (IL-6 and CRP).
4) Antioxidants and oxidative markers.
5) Nutritional parameters (Albumin, Hb, urinary creatinine)
6) Hormonal Levels (GH, IGF-1, Testosterone, DHEA) and much
more.
However none are good biomarkers for detecting frailty. Their use
45
SCREENING TOOLS FOR FRAILTY
There are several instrumental tools to screen for frailty. Most of
the screening tools assess physical functioning gait speed and cognition.
The most commonly cited, screening is Fried’s Frailty phenotype.
It was developed on the basis of observation of progressive weakness and
declines in activity in older adults most vulnerable to adverse outcomes
and has been validated in the cardiovascular health study (CHS)
involving over 5000 men and women age >65 years.
Other tools which are used to screen frailty are
1) Single item surrogate assessments of frailty include TUG and Hand
grip strength.
2) SPPB(54)(It includes balance test , chair stand test and 5 m gait
speed test).
3) FRAIL Scale(55)
Fatigue (“are you fatigued?”)
Resistance (“can you climb one flight of stairs”)
Ambulation (“can you walk one block?”)
Illness (greater than five)
46
“Yes” to three or more questions indicates frailty. “Yes” to
one or two questions indicates pre-frailty.
4) SOF Frailty Tool(56) (Annexure d))
Frailty is defined as the presence of atleast two of three
components:
• Weight loss of 5 percent in last year
• Inability to rise from a chair five times without use of arms • A “No” response to the questions “ do you feel full of
energy”
5) PRISMA questionnaire(57) (Annexure e))
6) Clinical Fraility Scale(58) (Annexure f))
It is a rapid frailty screening tool that is scored between 1(very fit)
and 7(severely frail) based on self report of co-morbidities and the
need for help with activities of daily living(ADLs)
7) BGS Guidelines(59)
• It recommends assessment of the elderly for presence of frailty at all encounters with health care workers. It includes
Gait speed , the Timed-Up and- Go test and the PRISMA
questionnaire.
• Edmonton frail scale is recommended for elective surgery.
8) Rockwood Frailty Index
The deficit accumulation or index approach to measue frailty is
based on the accumulation of illnesses, functional and cognitive
47
frailty. It requires 20 or more medical and functional –related
questions. The higher the number of deficits , the higher the frailty
score.
9) Edmonton Frail Scale(60) (Annexure g))
PREVENTION AND MANAGEMENT
Frailty is often identified at the end stage when there is clinically
evident history of recurrent falls and injuries, disability, recurrent hospital
visits due to acute illness, poor recovery from acute stress. Due to risk of
high morbidity & mortality secondary to frailty, it is imperative to
recognise them at an earlier stage & strategies for intervention to be
implemented even at the prefrail stage to give healthy quality of life to
older individuals who are at risk of adverse outcomes. To date, curative
treatments for frailty are unavailable.
However the currently available evidences suggest that the
modalities available can improve clinical outcomes in this patient
population and thereby it’s possible to prevent disability and frail status
can even be reverted back to the stage of prefrailty due to its dynamic
nature. Though there is no universal consensus definition & assessment
tools for frailty, the ultimate aim is to prevent the at risk individuals from
adverse outcomes. Most management strategies concern to improve the
48
for elderly(61) are 1) GEM (geriatric evaluation and management) in
which direct care & follow up care is given by the interdisciplinary team,
2) CGA (comprehensive geriatric interdisciplinary assessment and
treatment) in which the consultative interdisciplinary team makes specific
recommendations to the patient’s primary care provider, 3) PACE
(Program for All inclusive Care for the Elderly) and 4) acute care for
elderly(35).
Following are the approaches which can be incorporated in clinical
practice for prevention & management of frailty.
1) To find at risk individuals in routine practice & for effective
clinical care an extensive CGA /an interdisciplinary assessment &
management is needed.
2) Identify secondary frailty from latent undertreated or end stage
disease, other catabolic states
3) Screen for factors which exacerbate vulnerability to stressors-
polypharmacy, hospitalisation, surgery or other stressors.
4) Establish patient centered goals and advise regular follow up
with geriatric interdisciplinary management team.
5) To institute preventive measures for primary frailty once
49
PRIMARY PREVENTION(2):
It is vital to prevent the triggers. Primary prevention with probable
potential to prevent or postpone frailty focus mainly on lifestyle issues
and they are regular physical activity, vascular healthy diet , avoiding
smoking, weight control, proper nutrition, moderation with alcohol.
Recent evidences suggest drugs targeting RAA system affect body
composition & prevent sarcopenia. Drugs with potential side effects like
statins causing myopathy which probably limits the physical activity can
be avoided.
SECONDARY PREVENTION:
Aims to improve the prognosis and prevent or postpone the
development of disability and other adverse outcomes from frail status.
The therapeutic targets for frailty which are under investigation(35) are
1) Antioxidants (vit C, allopurinol)
2) Hormonal supplements (testosterone, DHEA, GH, vit D)
3) Behavioural interventions (calorie restriction & ↑ physical activity)
4) Drugs like acetaminophen, anti myostatinAb, ACEIs
5) Genetic manipulation
50
Good numbers of evidence are there which show Resistance
training Exercise with proper nutrition can increase the strength in a frail
as well as non-frail group(62). Earliest the patient can start, better will be
the response. Though there are areas which need investigation, it is highly
recommended for elderly frail individuals to have regular physical
activity and exercise, especially Resistance training exercise rather than
aerobic exercise to modify frailty & its adverse outcomes.
THYROID GLAND –ANATOMIC CONSIDERATIONS
Thyroid gland one among the largest endocrine glands weighs
about 15-20 grams. It is situated in the anterior portion of neck, below
and lateral to the thyroid cartilages. It consists of 2 lateral lobes with an
isthmus which connects the two lateral lobes, and sometimes a pyramidal
lobe. Embryologically, it arises from a small tissue at the base of tongue,
which later descends down as the thyroglossal duct and occupies the
anterior portion of neck between larynx and trachea. Multiple spherical
follicles (acini) lined by polarised epithelial cells, that surround secreted
51
THYROID HORMONES FORMATION & SECRETION(64)
Figure 11 THYROID HORMONES FORMATION & SECRETION
THYROID HORMONES STRUCTURE(63)
52
[image:68.595.167.490.151.436.2]REGULATION OF THYROID HORMONE SECRETION(65)
Figure 13 REGULATION OF THYROID HORMONE SECRETION
Hypothalamus secretes TRH which stimulates anterior pituitary to
produce TSH which in turn stimulates thyroid gland to synthesize T4 &
T3 from dietary iodides and follicular thyroglobulin, and are released in
to circulation. Both T3 & T4 in turn has both direct & indirect negative
feedback effect on secretion of TSH by action on anterior pituitary &
hypothalamus separately.
TRANSPORT OF THYROID HORMONES
Both T3 & T4 will bind with plasma proteins mainly with TBG
(Thyroxine – binding globulin), less withTransthyretin (TTR) and
53
peripherally (Liver, Muscle, kidney & other tissues) by Deiodinase
enzymes (Type I, II, III) to T3 .About 85% of T3 is derived from T4 to
T3 conversion. The direct production from thyroid constitutes only 15%.
More over T3 is less protein bound than T4 and has quick onset of action.
Also T3 has high affinity to Thyroid hormone receptors. Reverse T3, a
biologically inactive form is also derived from deiodination of T4 inner
tyrosyl ring rather than at outer phenolic ring.
MECHANISM OF ACTION OF THYROID HORMONES(66)
There are specific thyroid hormone response elements (TRE) on
the DNA at which the thyroid hormone receptor forms a heterodimer with
RXR (Retinoid X receptor) TR-RXR. T4 exerts its action by converting
into T3. In the absence of T3 binding to TR, TR-RXR heterodimer
bounded with TRE, recruits COR – Co-repressor & results in gene
silencing. When T3 binds with TR, it disrupts CoR binding with the
heterodimer & it promotes binding of CoA (Co-activator) & increase
54
Figure 14 thyroid hormone action
PHYSIOLOGIC ACTIONS OF THYROID HORMONE(67):
At Cellular level
Thyroid hormones act at cellular level to increase size and number
of mitochondria and the total membrane surface area of mitochondria
increases directly proportional to the increased metabolic rate of the
whole individual. They also increase Na+ K+ ATPase activity, which in
turn causes increase in transport of Na+ & K+ ions across cell
membranes. This process uses energy and it increases the heat production
in the body. Also they activate the sodium pump & further increases heat
production. However the increase in number and activity of mitochondria
could be the result of increased activity of the cells. Also uncoupling of
oxidative phosphorylation is stimulated(64).
On Growth: the effect of thyroid hormone on growth is evident by