Links between Volunteering
and Employability
Andy Hirst
CONTENTS
Executive Summary...ii
Introduction iii
Methodology iii
Who volunteers iv
The volunteering experience iv
Who benefits and how vii
Summary of findings ix
1. Introduction ... 1
2. Who Volunteers? ... 3
3. The Volunteering Experience ... 7
3.1. Economic status of volunteers 7
3.2. The volunteering activities undertaken 7
3.3. Becoming involved 10
3.4. Nature of the volunteering activities 12
3.5. The Impacts of Volunteering 17
3.6. Volunteering in employment 24
3.7. Barriers to volunteering 25
4. Who benefits and how ... 26
4.1. Introduction 26
4.2. Individuals’ Perceptions of the Value of Voluntary Activity 26
4.3. The Relationship between Volunteering and Job Entry 33
4.4. Work history of volunteers and non-volunteers 36
4.5. Regression Analysis of the link between Volunteering and Employability 42
5. Summary of Findings ... 46
ANNEX A Fieldwork Technical Report ... 50
Methodology 50
The Postal Survey 54
Outputs 56
Quality Control 56
ANNEX B Sample Selection and Survey Bias ... 59
Comparisons between population and samples (ESED variables) 61
Comparisons between samples (survey variables) 64
ACKNOWLEDGEMENTS
This research was commissioned by the Department for Education and Employment (now Department for Educationa and Skills, DfES) in August 2000 and was undertaken by a team of researchers from Cambridge Policy Consultants and System Three Research. The study was directed by Andy Hirst of CPC closely supported by Ben Rowland. The fieldwork programme was directed by Bruce Hayward and managed by Saskia Spencer of System Three Research.
The work was carried out in consultation with the project manager Ann Claytor of DfEE and a steering group consisting of Barry Miller DfEE, Sally Richards ACU, Cathy Millin ACU, Jane Kemp DSS, and Peter Haley DSS. The research team is most grateful to Ann and the members of the steering group for their valuable guidance and constructive comments received at all stages of the research.
EXECUTIVE SUMMARY
Introduction
1. The Department for Education and Employment (now DfES) commissioned
Cambridge Policy Consultants and their survey partners, System Three Research, in July 2000 to explore the link between volunteering and employability. The focus of this research has been on whether voluntary activity can improve an individual’s ability to gain, maintain or improve their employment. The main aims of the research are to:
• Investigate the nature of the link between volunteering and employability (including access to training and education) and the mechanisms operating; and,
• Establish whether there are circumstances in which unemployed people who volunteer increase their employability compared to similar people who do not volunteer.
Methodology
2. From the Employment Service Evaluation Database (ESED), 32,700 records
were chosen for people who had had some form of contact with the Employment Service between July 1999 and the end of June 2000. About a third of ESED records had no telephone number and so a postal survey was carried out in addition to a telephone survey. In total, 1,708 telephone interviews were successfully completed and 203 people responded to the postal survey.
3. Overall of the 1,911 people who responsed, 783 had volunteering experience (103 were postal responses) and 1,026 did not. This compares to initial targets of 1,000 in each category. Unfortunately, the sampling data was relatively inaccurate and so the effective sample size was smaller than the 32,700 with which System Three began the research. Although the sampling was structured (to ensure sufficient numbers of people with volunteering experience), early results suggested that approximately 10% of the ESED population had some volunteering experience, a figure which is in line with previous studies.
4. To provide some longitudinal analysis of the impact of volunteering on
respondents from the ESED database in July 2000 (the base for the survey of volunteers) and at the end of January 2001. Not only has ESED provided further personal characteristic information, crucially it contains JUVOS variables which have allowed investigation of labour market pathways over time.
Who volunteers
5. Women are more likely to volunteer, as are those who are older and those
who have higher qualifications. It is also the case that those now in employment are more likely to have volunteered, although non-volunteers are more likely to be in full time employment.
6. However, regression analysis shows that although gender and qualifications appear to be causal factors behind volunteering, they are relatively weak – the main causes have not been observable, but are likely to revolve around individual aspirations and attitudes.
7. Factors which do not have an impact on whether someone volunteers include: disability, prior duration, ethnicity, marital status, mobility, criminal conviction and area of residence.
The volunteering experience
Type of activities
8. Although nearly 70% were unemployed when they first began their
volunteering activity, 54% were in employment at the time of the survey, 9% were in education or training and just over a third were still unemployed.
9. Nearly three quarters volunteered for just one organisation, and in most cases this was for organisations outside of the public sector (20% volunteered for public sector organisations).
11. Just over half have done more than 200 hours volunteering in total, and a third have done 500 or more hours.
Nature of activities
12. For just over a third of volunteers, the primary motivation was charitable. Just under a third said their volunteering was motivated by personal or social reasons, such as wanting to get out of the house or meet people. For a quarter, volunteering played a role in their employment strategy.
13. Typically, voluntary activity involves:
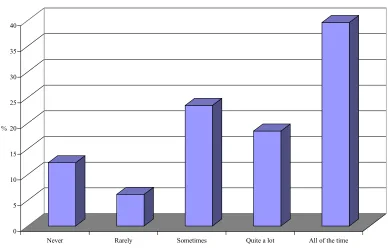
• Working with the public: Two fifths of volunteers had dealings with the public all the time, and only just over one in ten never did;
• Teamwork: 56% worked with other volunteers or staff most of the time with less than one in five working “nearly always” on their own;
• Activities in line with the volunteer’s capabilities: Two thirds felt that the level of the tasks required of them was appropriate, and of the remainder, twice as many felt they were under-stretched as over-stretched;
• Regular attendance: All but a quarter attend in a pattern that is akin to a work environment: regular and set times, although only a half were expected or required to;
• Supervisory activity: Some two fifths reported that they supervise others as part of their volunteering activity;
• A variety of tasks: Within the activity, two thirds reported that it was either very or quite varied with only 10% saying there was very little or no variety;
• Training: just over one in six volunteers had gained a qualification or certificate as part of their volunteering experience. Between a third and two fifths (37%) had not received any training at all. In between, 36% reported receiving induction training and just over a quarter enjoyed continuing but informal training.
• Personal Development: just over half reported that their contribution had been reviewed or discussed with them. Fewer than one in ten volunteers said that they had not experienced any personal development (such as taking on greater responsibilities) during their volunteering activity. The most common (nearly 80%) is a reduction in the supervision they need;
Impacts of volunteering
14. Nearly 54% of volunteers believe that their volunteering experience has
helped or will help them to get a job. However, while 88% of those who are currently unemployed and looking for work believe that their volunteering experience will help them, only 41% of those who are now employed believe their volunteering helped them to get their current job. In other words, those who have yet to move into work either have too high expectations of what their volunteering can do for them or those who have moved into employment are in hindsight playing down its significance.
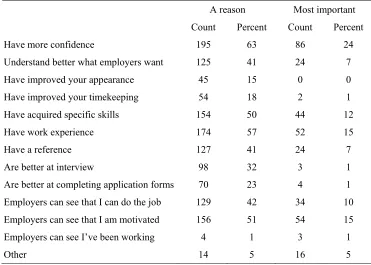
15. The reason cited as most important by most volunteers who felt they had
benefited was increased confidence, followed by work experience and proof of motivation and then the acquisition of specific skills.
16. Of those who have already moved into employment, only one in six said that their current job was similar to their volunteering activity.
17. Just under half of those who had moved into a job said that volunteering activity had played no role in getting it. Of those who thought it had played a role, four fifths believe they would have been able to get another job without the volunteering experience; of these, a slight majority believe their current job is more interesting and offers greater career prospects – but just less than half believe that another job would be better paid. This suggests that their choice of career is guided as much by non-financial aspects as financial.
18. On moving into employment, a third had continued with their volunteering activity as before, with a further one in six continuing in a reduced capacity. Given that two fifths had already stopped before taking up employment, only 6% actually discontinued on the point of entry into employment.
19. For those who had considered volunteering or doing more than the small
Who benefits and how
By individuals’ perceptions
20. This section explores what the characteristics and the features of the
volunteering experiences are for those individuals who perceive that their volunteering experience has been or will be of benefit to them in the labour market. The following personal characteristics are correlated with positive views of the impact of volunteering i.e. if this characteristic applies, the individual is more likely to report volunteering as boosting labour market prospects:
• Not having a driving licence
• Living on one’s own
• Not having dependants
• Being young
21. The following features of volunteering are correlated with positive views of the impact of volunteering:
• Volunteering span of 50 hours or more
• Volunteering for more than one organisation
• Working with the public at least some of the time
• Ongoing informal training and to a lesser extent formal training
• Discussion/review of volunteering activity
• Working in a team at least some of the time
• Variety of experience
22. In terms of motivation, those who have undertaken their volunteering activity for employment reasons are far more likely than others to report a positive impact: nearly 70% compared to less than 40% of those who undertake their volunteering activity for charitable reasons.
The relationship between volunteering and job entry
24. A number of factors can pull volunteers towards a quicker re-entry into employment. Higher qualifications to begin with, and then working with the public, experience of a supervisory role and on-going training within the volunteering experience can reduce the amount of time a volunteer is likely to spend on the Register – although they are still likely to spend more time than a non-volunteer. However, the factor that most reduces time spent on the Register for a volunteer does not depend on the quality of the volunteering experience, but on whether they were employed or not when they began: those who were in this position return to employment more quickly than those who began their volunteering activity while unemployed.
Work history of volunteers and non-volunteers
25. This section uses the work histories of individuals to assess whether those who volunteer have seen an advantage in the labour market over those who have not. This is done by exploring the three points in time: data from ESED at July 2000, the survey data and updated ESED data at January 2001.
26. Overall, it seems that those who volunteer are not as a result more likely to move from unemployment to employment than those who do not volunteer. The subset who undertake their volunteering activity for employment reasons are marginally more likely to move into employment (around 12% above other volunteers and non-volunteers). This is particularly the case for those with more than 6 months on the Register. Although numbers are small, those in this group who volunteer for employment reasons are 50 percent more likely to no longer claim JSA than other volunteers and non-volunteers.
27. Available information on differences in job quality is limited. However an analysis of spell structure (number of spells on unemployment) and durations off the Register has found no significant difference between volunteers and non-volunteers.
Regression analysis
• The duration of the individual’s last spell of unemployment;
• The number of days spent on the Register between July 2000 and January 2001; and,
• Those clients who were on the Register in July 2000 but who had secured employment in January 2001.
29. The model results have been somewhat disappointing in that they are not able to explain the variation across the three variables above 41% (50-60% would represent a good explanation).
30. The main finding from this section of the analysis is that neither volunteering or number of hours volunteered are significant variables in any of the specifications of the model used for the regression. Across different specifications of the model two broad factors were repeatedly significant:
• Personal characteristics (prior duration, age, sex, possession of a driving licence)
• Characteristics of the voluntary experience (team work, work experience, review procedures, supervisory role)
It is interesting to note that while the influence of personal characteristics is no great surprise, the factors which are perceived by volunteers themselves to make a difference to the quality of the voluntary experience do match the characteristics identified as significant in the regression analysis. These results confirm the impression from the descriptive analysis of the data that other factors (relating to aspirations and attitudes) come into play in determining the precise link between voluntary activity and employability.
Summary of findings
31. Half of all volunteers report that their volunteering activity has had a positive impact on their chances of employment. The nature of the volunteering activity has an impact here. The following features of the volunteering experience are correlated to whether the volunteering experience is attributed with improving the chances of getting a job:
• volunteering for a greater number of hours
• working with the public, even if only for a small amount
• being motivated by an employment strategy
• having one’s volunteering contribution reviewed or discussed (a strong correlation)
• working with others
• variety within the volunteering activity
• hearing about employment or educational/training opportunities through the volunteering activity (a strong correlation).
32. However, this endorsement of the impacts of voluntary activity on an
individual’s employment prospects is not matched by the quantitative analysis of employment experiences. There is no discernible difference in employment outcomes overall between those who have and those who have not volunteered. Moreover, volunteers take longer to (re-)enter employment than non-volunteers. This may be because volunteering is obstructing a return to work in some way, for example by limiting time for jobsearch. However, there is some evidence from our survey that this delay is for positive reasons as people wait to find their ‘ideal’ job.
33. More detailed analysis suggests that voluntary activity can have a positive impact on employment outcomes for certain groups: those who volunteer for employment reasons are in fact more likely to move off the JSA Register. This applies in particular to those between the ages of 25 and 44, those who can be assumed to be more likely to be at the ‘career building’ stage. Although numbers in the analysis are small, 12% more of those who undertake volunteering for employment reasons leave the Register than non-volunteers.
34. On some quantitative measures it would appear that volunteering does have a positive impact on an individual’s employability, on others it would appear to have a negligible impact and on others still to have what appears to be a negative impact. These apparently contradictory findings in fact point to complex layers of patterns experienced by different sorts of people. The scope of this research has not enabled a full analysis of these patterns and for many of them the numbers available are insufficient to produce robust results. This is likely to be a result of unobservable factors, such as attitude, dynamism and the willingness to explore new opportunities.
1. INTRODUCTION
1.1. This research has set out to investigate systematically the link between volunteering and employability. The Government has a broad-ranging interest in developing active citizenship to help combat social exclusion and engage people in serving their wider communities. Moreover, there is a specific interest in the potential of voluntary activity to provide an important stepping-stone in the route back to employment. A number of previous studies have identified that voluntary activity can lead to increased motivation, confidence and skills and that this may be part of an active strategy to (re)gaining employment pursued by individual jobseekers.
1.2. The Department for Education and Employment (DfEE) commissioned
Cambridge Policy Consultants in conjunction with System Three Research in July 2000 to explore the link between volunteering and employability. The focus of the research has been on whether voluntary activity can improve an individual’s ability to gain, maintain or improve their employment. The main aims of the research are to:
• Investigate the nature of the link between volunteering and employability (including access to training and education) and the mechanisms operating; and,
• Establish whether there are circumstances when unemployed people who volunteer increase their employability compared to similar people who do not volunteer.
1.3. Both voluntary activity and employability are ill-defined concepts and neither lend themselves to direct measurement. Therefore, the research has been carefully designed to concentrate on those who have been seeking employment and compare the experiences of those who have undertaken a
substantive amount of volunteering against those who have not.
analysis. Unfortunately, due to problems with the quality of contact details we were not able to secure the full quota for the volunteers (full details are provided in Annex A).
1.5. A structured questionnaire was used to explore the nature of the volunteering activity and any relationship between this activity and the individual’s current status. Key questions included:
• Does volunteering have a positive impact on employability?
• If participating in voluntary work does increase employability, what is it which produces this effect?
• What sort of people increase their employability or access to education or training by participating in voluntary work?
• Over what timescale might volunteering be expected to impact on
employability?
• In what sorts of employment fields does volunteering influence
employability or access to training or education?
1.6. To provide some longitudinal analysis of the impact of volunteering on
employability we undertook a comparison of the employment status of survey respondents from the ESED database in July 2000 (the base for the survey of volunteers) and at the end of January 2001. Not only has ESED provided further personal characteristic information, crucially it contains JUVOS variables which have allowed investigation of labour market pathways over time.
1.7. The remainder of this report is structured as follows:
• The next section explores the characteristics of those who volunteer and those who do not;
• Section 3 analyses the nature of the volunteering experience that survey participants have had;
• Section 4 looks at who benefits and how – this is based on four analyses: by perceptions of individuals, by time taken to (re-)enter work, by work histories and by statistical regression of the factors contributing to employment entry;
• Section 5 presents a summary of the findings of the analysis.
2. WHO
VOLUNTEERS?
2.1. To date there have been relatively few large scale surveys of the level of volunteering activity undertaken by unemployed people. We are aware of only one previous survey of JSA claimants which suggested that 9% of unemployed people undertook some form of volunteering. Because of the sample quotas used to construct the volunteer and non-volunteer groups, it is not possible to report the extent of volunteering among unemployed people directly from the survey. However, during the initial phase of the fieldwork programme, our survey partners reported that volunteers amounted to around 9% of the population contacted1.
2.2. The following tables set out the primary differences in the characteristics between those who undertake some form of voluntary activity and those who do not. Differences are not large and occur across the following characteristics:
• Economic activity;
• Gender;
• Age; and
• Qualifications.
Where there are differences it has also been possible to explore whether employment status has an impact – so for example, whether those who are older and who are unemployed are more likely or not to be volunteers.
2.3. Differences in economic activity are slight: non-volunteers are marginally more likely to be employed full-time, but less likely to be employed part-time. Overall, 54% of volunteers are in employment compared to 51% of non-volunteers.
2.4. Volunteers are also more likely (proportionately almost twice as likely) to be in education or training than non-volunteers. Non-volunteers are, however,
more likely to be unemployed, although again the differences between the two groups are not large.
Table 2.1: Economic status of volunteers and non-volunteers
Volunteers Non-volunteers
Employed full-time (more than 30 hours a week) 35% 38%
Employed part-time (between 16 and 30 hours a week) 10% 7%
Employed part-time (less than 16 hours a week) 5% 3%
Employed part-time (less than 1 hours a week), but claiming 1% 0%
Self-employed 3% 3%
Unemployed 35% 42%
Retired 1% 1%
Looking after family 1% 1%
In education or training 9% 5%
Total 100% 100%
Source: CPC/System Three survey
2.5. Proportionately more females undertake voluntary activity than males –
females are almost a third more likely to volunteer.
Table 2.2: Gender
Volunteers Non-volunteers
No % No %
Female 318 41% 347 31% Male 465 59% 779 69%
Total 783 100% 1126 100%
Source: CPC/System Three survey
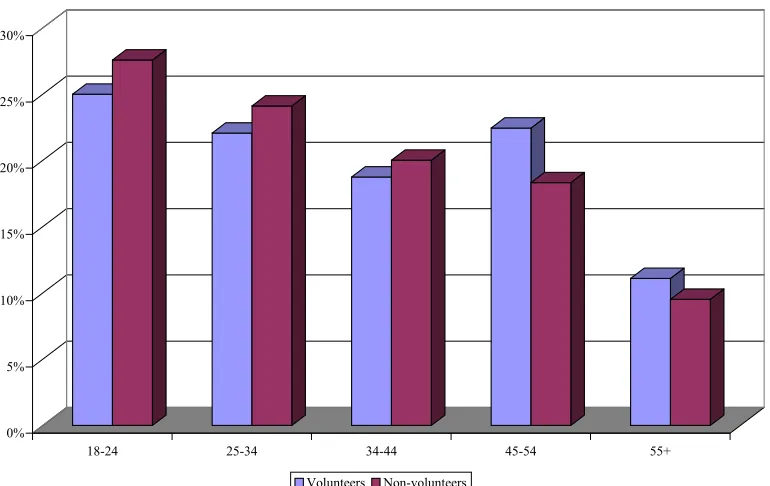
2.6. Volunteers are also more likely to come from older age groups above 45
Figure 2.1: Age Distribution of Volunteers and Non-volunteers
0% 5% 10% 15% 20% 25% 30%
18-24 25-34 34-44 45-54 55+
Volunteers Non-volunteers
Source: CPC/System Three survey
2.7. Volunteers are more likely to be more highly qualified and non-volunteers are almost twice as likely to have no formal qualification.
Figure 2.2: Highest qualification of Volunteers and Non-volunteers
0% 5% 10% 15% 20% 25% 30% 35%
None NVQ level I or equivalent
NVQ level II/GCSE or equivalent
NVQ level III/A level/HNC or
equivalent
[image:17.595.129.539.442.744.2]2.8. This pattern holds, regardless of current economic status, as Table 2.3 shows. While those who are in employment are more likely than those who are not to have qualifications, those who are not in employment but are volunteers are more likely than those who are employed but who are not volunteers to have a degree (or equivalent) and less likely not to have any qualifications.
Table 2.3: Those with no qualifications and with degree by volunteering and employment status
No qualifications Degree or equivalent
Frequency Percent Frequency Percent
Non-volunteers: Unemployed 183.0 33.0 68.0 12.3
Employed 129.0 22.5 106.0 18.5
Volunteers Unemployed 68.0 18.9 95.0 26.5
Employed 50.0 11.7 152.0 35.6
Source: CPC/System Three survey
2.9. We have undertaken a series of statistical regression analyses across a very broad range of characteristics and factors to explore any other differences between volunteers and non-volunteers. Three conclusions arise from this analysis:
• Firstly, that even for cross-sectional data we have been able to explain only a small proportion of the variation in volunteering between people (at most the regression has been able to explain 7% of the variation between the two groups where 50-60% might be considered a good fit with cross-sectional data). This suggests that the factors which lead people to volunteer are more closely associated with attitudes and aspirations than observable personal characteristics – a result that is not surprising.
• Secondly, that whatever the range of characteristics employed in the regression, gender and qualifications remain statistically significant. Age and economic status are less statistically significant, suggesting that other (unobserved) factors are correlated with these.
3. THE
VOLUNTEERING
EXPERIENCE
3.1. Economic status of volunteers
3.1.1. Overall, 783 individuals with volunteering experience were surveyed, 680 by telephone with another 103 responding to the postal questionnaire. Of these, 427 (54%) had some form of employment at the time of the survey, 271 (35%) were unemployed, 18 (2%) were inactive and 69 (9%) were in education or training. Only two thirds of those apparently eligible for JSA (i.e. those who are unemployed or those working less than 16 hours a week) were actually claiming2.
3.1.2. It should also be noted that one third of those with employment stated that their job was ‘not permanent in some way’, with women (32% of those in employment) slightly more likely to be in this situation than men (27% of those in employment). This is mainly accounted for by short term contract work (as opposed to seasonal or casual work), but nevertheless highlights the relatively insecure employment into which many volunteers have moved.
3.1.3. Nearly 70% (543 individuals) were unemployed when they first began their volunteering activity.
3.2. The volunteering activities undertaken
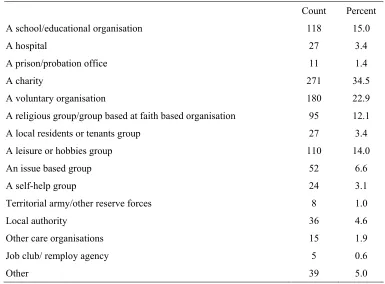
3.2.1. Respondents were invited to state for which types of organisations they had volunteered. Table 3.1 demonstrates the variety of organisations volunteered for. The results add up to more than 783 as some people have either volunteered for more than one type of organisation or may have classified an organisation in more than one way.
3.2.2. One way of further categorising the organisations volunteered for is
analysis shows that just over a fifth have volunteered for a public sector organisation, with 85% having volunteered for an organisation outside the public sector. Some 7% have volunteering experience with organisations both within and outside the public sector.
Table 3.1: Types of organisation(s) volunteered for
Count Percent
A school/educational organisation 118 15.0
A hospital 27 3.4
A prison/probation office 11 1.4
A charity 271 34.5
A voluntary organisation 180 22.9
A religious group/group based at faith based organisation 95 12.1
A local residents or tenants group 27 3.4
A leisure or hobbies group 110 14.0
An issue based group 52 6.6
A self-help group 24 3.1
Territorial army/other reserve forces 8 1.0
Local authority 36 4.6
Other care organisations 15 1.9
Job club/ remploy agency 5 0.6
Other 39 5.0
Source: CPC/System Three survey
3.2.3. Table 3.2 shows the number of organisations that people have volunteered for. While the clear majority (nearly three-quarters) have only volunteered for one organisation, a significant minority have been involved with two or more.
Table 3.2: Number of organisations volunteered for
Count Percent
One 571 73
Two 138 18
Three or more 74 9
Total 783 100.0
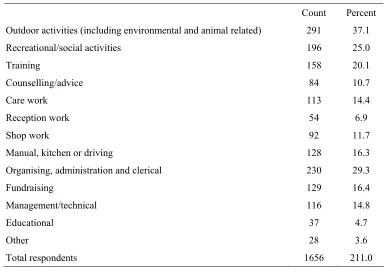
3.2.4. The range of activities undertaken by volunteers varies enormously too. Table 3.3 shows the types of activities undertaken. It is clear that many volunteers are undertaking multiple tasks: nearly 40% have undertaken two or more activities. Outdoor and recreational activities if they include environmental and animal related activities, are the most common very closely followed by organisation and administrative work.
Table 3.3: Type of activities involved in volunteering
Count Percent
Outdoor activities (including environmental and animal related) 291 37.1
Recreational/social activities 196 25.0
Training 158 20.1
Counselling/advice 84 10.7
Care work 113 14.4
Reception work 54 6.9
Shop work 92 11.7
Manual, kitchen or driving 128 16.3
Organising, administration and clerical 230 29.3
Fundraising 129 16.4
Management/technical 116 14.8
Educational 37 4.7
Other 28 3.6
Total respondents 1656 211.0
Source: CPC/System Three survey
3.2.5. We have further classified volunteering activities into four groups:
• ‘active’ volunteering: outdoor and recreational activities etc;
• ‘support’ volunteering: counselling, care work etc;
• ‘manual’ volunteering: driving, kitchen work, other manual work etc;
• ‘office’ volunteering: administration, management etc.
Table 3.4: Volunteering activities (CPC classification)
Count Percent
Active 322 41.1
Support 292 37.3
Manual 182 23.2
Office 321 41.0
Source: CPC/System Three survey
3.2.6. Volunteers were also asked how much volunteering activity they had carried out. In total, just over half (53%) had done more than 200 hours volunteering, of whom three fifths (a third of the total) had undertaken more than 500 hours of volunteering. It should be noted that these figures reflect answers that are above a minimum level of volunteering set to filter out those with occasional or negligible volunteering experience: to ‘qualify’ as a volunteer, the person had to have volunteered for at least 24 hours in total, to have volunteered on average twice a month and to have volunteered for at least 24 hours in the past twelve months.
Table 3.5: Total hours volunteering in bands
Count Percent
(over threshold) up to 50 hours 128 16
more than 50 up to 200 hours 241 31
more than 200 up to 500 hours 156 20
more than 500 hours 258 33
Total 783 100
Source: CPC/System Three survey
3.3. Becoming involved
3.3.1. Gay in her 1998 report3 noted the different motivations for getting involved in
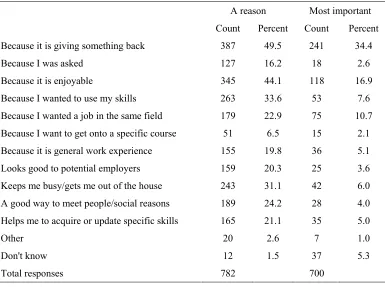
volunteering. Table 3.6 demonstrates the range of motivations, with the first two columns showing what was considered to be a factor and the second two showing what was considered to be the most important factor. It should be noted that even for the latter two columns, several individuals were unable to
3 Getting into Work – the role of volunteering in improving employability, Pat Gay, Nov 1998,
pinpoint a single most important reason, and so the responses come to more than 700 (the number who responded).
Table 3.6: Motivations for becoming involved in volunteering activity
A reason Most important
Count Percent Count Percent
Because it is giving something back 387 49.5 241 34.4
Because I was asked 127 16.2 18 2.6
Because it is enjoyable 345 44.1 118 16.9
Because I wanted to use my skills 263 33.6 53 7.6
Because I wanted a job in the same field 179 22.9 75 10.7
Because I want to get onto a specific course 51 6.5 15 2.1
Because it is general work experience 155 19.8 36 5.1
Looks good to potential employers 159 20.3 25 3.6
Keeps me busy/gets me out of the house 243 31.1 42 6.0
A good way to meet people/social reasons 189 24.2 28 4.0
Helps me to acquire or update specific skills 165 21.1 35 5.0
Other 20 2.6 7 1.0
Don't know 12 1.5 37 5.3
Total responses 782 700
Source: CPC/System Three survey
3.3.2. These results are perhaps more meaningful when further classified. The various motivations fit broadly into four such classifications:
• ‘charitable’: wanting to give something back, a good cause etc.
• ‘social/personal’: to get out of the house, meet people, enjoyable etc.
• ‘employment’: want a job in the same field, want to acquire skills, good work experience etc.
• other: motivations not falling into the above, including family members already involved in volunteering and those who could not give any specific reason for volunteering.
Table 3.7: Most important reason for becoming involved (CPC classification)
Count Percent
charitable 247 35.4
social/personal 227 32.5
employment 176 25.2
other 48 6.9
Total responses 698 100.0
Source: CPC/System Three survey
3.3.3. Motivation by age group does vary. The older the volunteer is, the more likely their primary motivation will be charitable, with about a quarter of 18-34 year olds motivated in this way against 44% of those over 45. Conversely, the younger the volunteer, the more likely they are to have volunteered for employment reasons: a third of 18-34 year olds will be motivated by this, whereas only 16% of 45-54 year olds are and just 7% of those 55 or over. Across all age groups, about one third are motivated by social reasons.
3.3.4. Respondents (in the telephone but not the postal survey) were also asked how
they became involved. It is clear that familiarity with the organisation directly or through someone else is by far and away the most common route to becoming involved. Less than 3% cited a volunteer bureau as a route, less than 10% mentioned media channels, such as leaflets, newspapers or the internet and just over 10% mentioned their Jobcentre as playing a role.
3.4. Nature of the volunteering activities
3.4.1. Volunteers were asked a number of questions about the nature of their volunteering activity. Those who were interviewed by telephone were asked more questions than those who returned a postal survey. Questions which were only asked in the telephone survey are marked with an asterisk (*) at the start of the relevant paragraph.
Figure 3.1: Extent of contact with the public
0 5 10 15 20 25 30 35 40
%
Never Rarely Sometimes Quite a lot All of the time
Source: CPC/System Three survey
[image:25.595.159.548.90.340.2]3.4.3. Nearly two thirds of volunteers reported that the level of the tasks they were required to do as part of their volunteering activity were about right for them. Just over 10% felt that they were being asked to do more than they were capable of, but more than twice as many felt they could have been stretched more. These results are shown in the following table.
Table 3.8: Appropriateness of tasks and responsibilities
Count Percent
My tasks and responsibilities are about right for me 501 64
Sometimes I feel I cannot do everything required 76 10
I often feel I cannot do everything required 16 2
Sometimes I feel that my abilities are not fully used 97 12
Often I feel that my abilities are not fully used 86 11
Don’t know/no reply 7 1
Total 783 100
Source: CPC/System Three survey
even though they were not required to. Overall, therefore, all but a quarter were attending their volunteering activity in a way similar to that expected from an employer. Table 3.9 shows these results in more detail.
Table 3.9: Attendance requirements/expectations
Count Percent
These times were fixed and you followed them most or all of the time 387 49
They were fixed, but you only followed them some of the time 38 5
They were not fixed, but you tended to turn up at regular times 190 24
They were not fixed, but you turned up when you could 142 18
When required 12 2
When it suited me 3 -
Other 5 1
Don’t know/no response 6 1
Total 783 100
Source: CPC/System Three survey
3.4.5. *Given the emphasis within employment policy on training as a route for progression, respondents were asked whether they had received any training during their volunteering activity and if so, what sort of training it was. Just over a third received no training at all (37%). A similar number (36%) received (at least) some induction training, just over a quarter enjoyed on-going/informal training and slightly fewer (24%) participated in formal training. Of these, just over half gained a qualification or certificate as a result.
distribution and therefore the individual figures may compare well to the level of training provided by ‘industry’.
3.4.7. *Table 3.10 shows what training was received by volunteers undertaking different sorts of activities. Given the sensitivities involved in some of the ‘support’ volunteering (which includes counselling and care work), it is not surprising that this category receives the most formal training.
Table 3.10: Training received by type of volunteering activity (%)
formal ongoing informal none
Active 18% 20% 27% 35%
Support 26% 23% 28% 23%
Manual 19% 25% 30% 26%
Office 18% 26% 33% 23%
Source: CPC/System Three survey
3.4.8. Over both surveys 146 respondents, just over one in six, had gained a qualification or certificate through their volunteering activity.
3.4.9. The degree to which an individual is managed and supported was seen as being potentially important in the overall impact of the volunteering experience. Volunteers were therefore asked if their volunteering activity was ever reviewed or discussed with them. The results to this question are shown in Table 3.11.
Table 3.11: Volunteering activity ever reviewed or discussed
Count Percent
Yes 412 53
No 365 47
Don’t know/no reply 6 1
Total 783 100
Source: CPC/System Three survey
one in five nearly always worked on their own, with over half saying that they worked with others most of the time.
Figure 3.2: Extent of working with others
56% 25%
18%
1%
With other volunteers or staff most of the time With other volunteers or staff some of the time
Nearly always on my own Don't know/no reply
Source: CPC/System Three survey
3.4.11. *A surprisingly high proportion of volunteers also manage other volunteers or staff in some capacity – nearly two fifths of those who responded to this question.
Table 3.12: Progress within the volunteering experience
Count Percent
Do more of the activity than to begin with 372 59.8
Have taken on more complex duties 376 60.5
Have needed less and less supervision 488 78.5
Taken on supervision of other people 262 42.1
Now use more equipment, such as IT 274 44.1
Work more with the public now than to begin with 341 54.8
Now undertake management tasks 189 30.4
Source: CPC/System Three survey
3.4.13. *The survey was also able to show the extent to which volunteering
experiences offer variety. Just over 36% stated that their volunteering experience entailed considerable variety, with a further 30% saying that there was quite a lot of variety. About one in ten said there was very little or no variety with the remaining quarter stating that their volunteering activity was a little bit varied.
3.4.14. Respondents were asked whether their volunteering activity had led to them hearing about employment and/or training and education opportunities. Given the acknowledged importance of such informal networking and ‘word of mouth’ routes into employment, it is disappointing that fewer than 3 in 10 replied that they had. Of those who had, two thirds said it had led to contact with a potential employer or training provider, and over a quarter (66 individuals) achieved an interview, gained a job or were offered a training place.
3.5. The Impacts of Volunteering
While looking for work
3.5.1. All those who have experience of being a volunteer and looking for work were asked whether the former had had a positive impact on the latter.
half believed that the volunteering experience had encouraged greater job search, with over a third believing it had done this ‘a lot’.
Table 3.13: Did volunteering experience encourage greater job search?
Count Percent
Yes – a lot more 214 33
Yes – a little more 88 13
No 357 54
Total 659 100
Source: CPC/System Three survey
It is interesting to note that an analysis of the responses of those who are now in employment by their broad occupational category suggests that those who are most likely to say that their volunteering experience encouraged greater job search are those in lower skilled occupations (such as personal and protective services, sales occupations and plant and machine operatives). However, the likelihood of reporting a subsequent role of the volunteering in actually getting the person a job does not reflect this (see 3.5.5. below).
3.5.3. In some ways, the most crucial question is whether the volunteering
experience is seen as having had a positive impact on the individual’s chances of getting a job. Those who are in education/training or who are still unemployed were asked whether they felt the volunteering experience would help them get a job, and those currently in employment were asked whether they felt the volunteering experience had helped them to get a job. The combined results are shown in Table 3.14.
Table 3.14: Has volunteering experience had a positive impact on chances of getting a job
Count Percent
Yes - a lot 223 31
Yes - a little 160 23
No 328 46
Total 711 100
3.5.4. Overall, over half believe that volunteering has had a positive impact. This suggests that volunteering is something that clearly has a role to play. It should be noted, however, that there are significant differences depending on the individual’s current economic activity. Whereas 88% of those who are currently unemployed and intending to work believe that volunteering has had a positive impact, this falls to 72% for those in education/training and drops dramatically to 41% for those who are currently in employment. It is not clear whether this is caused by too high expectations of their volunteering by those not in employment, or by those in employment playing down the role that volunteering has in fact played. Furthermore, this very positive finding is not supported by statistical analyses (see section 4).
3.5.5. *Amongst those who are now in employment, there are slight differences between those moving into different broad occupational categories. However, because of the small numbers involved it is hard to draw any robust conclusions, particularly as no clear pattern emerges: for example, while only three in ten managers and administrators say their volunteering experience helped them to get their current job, over half of those now in associate professional or technical occupations do; and while over 50% of those now in personal and protective services cite a positive impact, only a third of those who are now plant and machine operatives do.
3.5.6. Of all those who were able to specify in what way the volunteering
Table 3.15: Reasons behind impact of volunteering; most important reason
A reason Most important
Count Percent Count Percent
Have more confidence 195 63 86 24
Understand better what employers want 125 41 24 7
Have improved your appearance 45 15 0 0
Have improved your timekeeping 54 18 2 1
Have acquired specific skills 154 50 44 12
Have work experience 174 57 52 15
Have a reference 127 41 24 7
Are better at interview 98 32 3 1
Are better at completing application forms 70 23 4 1
Employers can see that I can do the job 129 42 34 10
Employers can see that I am motivated 156 51 54 15
Employers can see I’ve been working 4 1 3 1
Other 14 5 16 5
1. ‘Most important’ percentage column adds to more than 100 as some people named more than one ‘most important’.
Source: CPC/System Three survey
Those unemployed at time of survey
Table 3.16: Impact of volunteering on unemployed
A lot A little/maybe Not at all Total
Volunteering experience… Count % Count % Count % Count %
Has boosted confidence in general 163 57 79 28 44 15 286 100
Can now work better with others 145 51 79 28 62 22 286 100
Has led to new or improved skills 64 22 101 35 121 42 286 100
Was useful as work experience 109 38 94 33 83 29 286 100
Has led to (potential) reference 241 86 24 9 15 5 280 100
Source: CPC/System Three survey
Those in employment
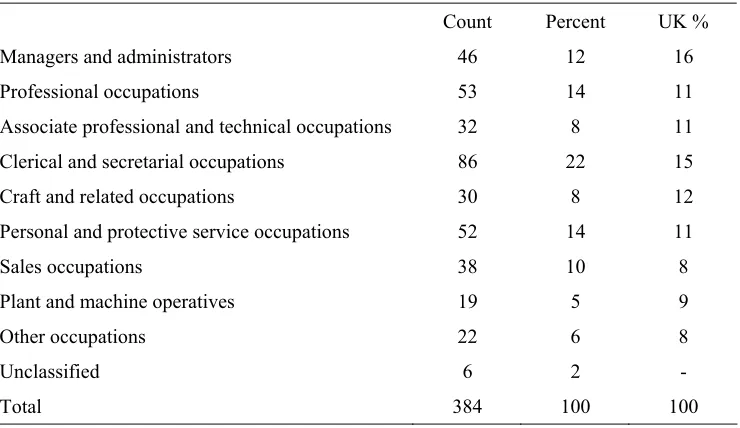
3.5.8. *Table 3.17 shows the broad occupational categories of those who have moved into employment (at the time of the survey). There is a relatively even spread of occupations, with clerical and secretarial being the largest category (and 50% above the proportion in employment nationally). Volunteers tend not to find work in more ‘technical’ occupations – craft and related and plant and machine operators – represent just over half that found nationally.
3.5.9. Over half of respondents (54%) said that their current job was completely different to what they did for their volunteering activity. Almost a third (31%) felt it was similar in a few or some ways, with only one in six saying that it was very similar to what they did for their volunteering activity.
Table 3.17: Occupational categories of those now in employment
Count Percent UK %
Managers and administrators 46 12 16
Professional occupations 53 14 11
Associate professional and technical occupations 32 8 11
Clerical and secretarial occupations 86 22 15
Craft and related occupations 30 8 12
Personal and protective service occupations 52 14 11
Sales occupations 38 10 8
Plant and machine operatives 19 5 9
Other occupations 22 6 8
Unclassified 6 2 -
Total 384 100 100
Source: CPC/System Three survey and Labour Force Survey, Autumn 2000
[image:34.595.148.518.93.307.2]3.5.11. In order to gauge the extent to which those who have moved into employment believe volunteering has ‘made the difference’, they were asked whether they thought they would have got their current job without the experience of their volunteering activity.
Table 3.18: Would person have got current job without volunteering activity
Count Percent
Yes 235 50
Probably 68 14
Probably not 38 8
No 133 28
Total 474 100
Source: CPC/System Three survey
In summary:
• half believe that their volunteering activity played no role in their acquisition of their current job;
• just over a third believed that the activity definitely or probably did help them (those answering “probably not” and “no” to the question);
of those now in employment) which suggests that is an effective way into employment;
• tempering this, however, is the further finding that less than two fifths in this group began volunteering primarily motivated by employment reasons.
3.5.12. All those who believed that the volunteering activity may have played some role in helping them get their current job were also asked whether they could have obtained a job at all without the volunteering activity. Of the 212 who answered, one in five (44 individuals) believed that they would not or probably would not have been able to gain a job at all. The main difference the volunteering appears to have made is in giving the individual confidence and demonstrating motivation and ability to work to employers.
Table 3.19: Would person have been able to get any other job without volunteering activity
Count Percent
Yes 121 57
Probably 47 22
Probably not 18 9
No 26 12
Total 212 100
Source: CPC/System Three survey
3.5.13. The 168 individuals who believed that they would not have got their current job without the volunteering activity, but would have got another job, were asked a series of questions to ascertain their views of the quality of the job to which the volunteering activity had assisted them compared to other jobs they believe they might have obtained instead:
• just over half believed that the alternative would have been better paid (suggesting that volunteering activity is not necessarily a good route to maximising the wage levels of any consequent employment);
• 56% believed that another job would not have been as interesting and enjoyable as their current job, with only a quarter saying that another job would definitely have been more interesting;
All those looking for training
3.5.14. Those who were unemployed and looking for training/education and those currently in training/education were asked whether they felt their volunteering experience had or would have a positive impact in this regard. The results are shown in Table 3.20.
Table 3.20: Did/will volunteering help secure training/education place
Count Percent
Yes - a lot 35 34
Yes - a little 12 12
No 57 55
Total 104 100
Source: CPC/System Three survey
3.6. Volunteering in employment
3.6.1. Of those who were employed at the time of the survey, 46% had given up their volunteering activity – indeed, 40% were no longer volunteering at the point at which they moved into employment. A further one in six had reduced the amount of volunteering activity they undertook, but over a third (36%) had continued to volunteer in the same way as when unemployed.
3.6.2. *Of those who have continued, nearly half (45%) found it difficult or sometimes difficult to combine work and volunteering. However, slightly more (49%) believe that their volunteering is of help to them in their jobs, mainly through providing experience and boosting chances of promotion.
3.7. Barriers to volunteering
3.7.1. Those who had not volunteered (but had considered it) and those who had volunteered but for less than the threshold amount (less than 24 hours in total, less than 2 hours a month or less than 24 hours a year) were asked some questions regarding why they had not undertaken (more) volunteering. In addition, those volunteers answering the postal questionnaire were asked whether they had considered undertaking more volunteering than they currently did and if so, what had prevented them.
[image:37.595.144.526.468.723.2]3.7.2. Just over 1,000 (1,038) contacted had never volunteered, some one third of whom had considered volunteering. Of the 173 individuals with volunteering experience questioned, two in five had considered undertaking more. The reasons given by the total of 401 people who had considered undertaking (more) volunteering for not doing so are outlined in Table 3.21. By far and away the most important issue is lack of time, but there are clearly some other areas where knowledge and information is lacking, primarily regarding the whereabouts of volunteering opportunities and the implications from a financial point of view of becoming involved.
Table 3.21: Barriers to (further) volunteering
Count Percent
I do not have the time 187 47
I don't know of any organisations who offer volunteering
opportunities 54 13
I don't know of any organisations for whom I would want to
volunteer 20 5
I have been looking for work/ in education 35 9
I am concerned that it might get in the way of looking for work 47 12
I am worried that I would lose money through not being paid
expenses 23 6
I am concerned that it might affect my benefit claims 21 5
Lack of motivation/not thought about it 22 5
Poor health/ ill-health 11 3
Have children/family commitments 9 2
Other 23 6
4.
WHO BENEFITS AND HOW
4.1. Introduction
4.1.1. This section addresses the core issue for the research: whether a relationship can be established between voluntary activity and employability – as measured by both the perceptions of the individual and any observable differences in their experiences of employment. We have undertaken this analysis in four distinct ways:
• a descriptive analysis of the perceptions of individuals concerning the manner and extent to which voluntary activity has contributed to their employability (drawing a distinction between those in work and those yet to find work);
• an analysis of the time taken by people to (re-)enter employment
according to different factors relating to their voluntary activity;
• an analysis of the work history of volunteers and non-volunteers between July 2000 and January 2001 to explore the factors which may underlie sustainability in outcomes; and,
• a statistical regression analysis of the factors contributing to (re-)entering employment.
Each of these analyses are addressed in turn.
4.2. Individuals’ Perceptions of the Value of Voluntary Activity
vary significantly from person to person. However, this process does begin to identify which aspects of volunteering appear to be important and for whom.
4.2.2. Only those factors and features that have a significant correlation with a positive impact from volunteering are discussed. For completeness, the factors which do not have a significant correlation are:
• Possession of a criminal record
• Ethnicity (whether white or non-white)
• Disability
• Whether volunteered for a public or non-public institution (or both)
• Type of volunteering activity (active, support, manual, office) or numbers of types undertaken
• Appropriateness of tasks to skills and aptitude
• Time requirements
• Progression within the volunteering activity
Personal Characteristics
4.2.3. Not having a driving licence means that one is more likely to gain something from volunteering: 65% of those without a driving licence benefited in some way whereas only 47% of those with one reported that their volunteering activity had increased their chances of getting a job.
4.2.4. 43% of those living with a partner reported a positive impact from
volunteering. For those living on their own, this goes up to 61%, suggesting that single people are more likely to benefit.
4.2.5. Not having dependants makes one more likely to benefit from volunteering, though the correlation is not as strong as with the driving licence and whether one lives with a partner: 57% of those without dependants reported a positive impact, as against 48% with one dependant and 46% with two or more dependants.
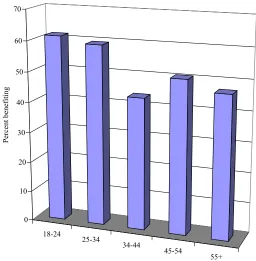
39% of 18-24 year olds and 25-34 year olds respectively reported significant benefits as against only 22% of those in the 35-44 bracket.
[image:40.595.185.441.338.599.2]4.2.7. In summary, it appears that those who are most likely to report benefits are those who are less likely to have well developed social networks. Volunteering, therefore, may play a role by enabling such people to develop social networks. The impact may be as much in terms of social skills and social benefits as those directly related to employment – this would fit with the statistical picture developed below, which suggests that the link between volunteering and employability (as opposed to other sorts of benefits) is much weaker than surveyed individuals’ responses would suggest.
Figure 4.1: Correlation between agebands and reporting positive impact from volunteering
18-24
25-34
34-44
45-54
55+ 0
10 20 30 40 50 60 70
Percent benefiting
Source: CPC/System Three survey
words, there appears to be a correlation between length of unemployment and perceptions of benefits from volunteering. As with earlier results, however, those still not in employment are more likely to attribute benefits to volunteering, with 75% saying that they felt that volunteering had boosted their employability, compared with 54% of those now in a job. The difference is much less than that for all volunteers, where 88% of all volunteers who are still unemployed believe it has had a positive impact against only 41% of those now in employment.
Nature of the Volunteering
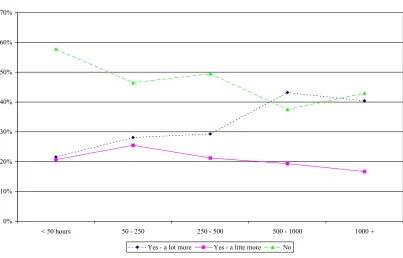
[image:41.595.134.537.455.713.2]4.2.9. There is a correlation between the total number of hours volunteered and whether there is a positive impact, particularly when significant impacts are reported. Figure 4.2 illustrates this link. The top line represents those who say they have not benefited at all (which declines with longer hours of volunteering) and the middle representing those who say they have benefited ‘a lot’ from their volunteering (which increases with longer hours of volunteering).
Figure 4.2: Correlation between hours volunteered and reporting positive impact from volunteering
0% 10% 20% 30% 40% 50% 60% 70%
< 50 hours 50 - 250 250 - 500 500 - 1000 1000 + Yes - a lot more Yes - a litte more No
4.2.10. Only 40% of those who never work with the public as part of their volunteering activity report a positive impact, against over half of those who do. However, it does not seem that the more contact with the public there is, the greater the likelihood of reporting a positive impact as illustrated by Figure 4.3.
Figure 4.3: Percentage reporting positive impact from volunteering by working with the public as part of volunteering experience
0% 5% 10% 15% 20% 25% 30% 35% 40%
Never Rarely Sometimes Quite a lot All of the time
Source: CPC/System Three survey
4.2.11. Whether training was provided by the organisation also appears to have a correlation with a positive impact for the volunteer in employment terms. It is interesting to note, however, that those who benefited most are those who have received ongoing informal training: only 43% of those who received no training have claimed a benefit as against 53% who have been ‘shown the ropes’ and 56% who have received formal training – but of those who have received ongoing informal training 61% reported a benefit.
4.2.13. There is also a correlation between working with others as part of the volunteering activity and employment related benefits: two fifths of those working on their own most or all of the time reported positive impacts whereas nearly three fifths of those who work as part of a team did. It is interesting to note that the link is slightly stronger amongst those who work with others sometimes than amongst those who work with others most or all of the time. This suggests that a variety and combination of working arrangements is more likely to deliver positive employment benefits for volunteers.
4.2.14. Finally, those who have heard about employment and training/education opportunities during their volunteering experience are more likely to report that their chances of gaining employment as a result of their volunteering have increased. 72% of those who have heard about such opportunities report a positive impact, whereas only 45% do of those who have not heard about such opportunities.
Motivation for Volunteering
4.2.15. Those who are primarily motivated to volunteer as part of an employment strategy are much more likely to claim an employment benefit from their activity. It is interesting to note, however, that those who are motivated mainly by a social reason (such as wanting to meet new people or simply looking for something to do) are in fact more likely to report an impact than those who are mainly motivated by charity. This is illustrated in Figure 4.4.
Figure 4.4: Percentage of those reporting positive impacts from volunteering by primary motivation
0 10 20 30 40 50 60 70 80
P e r c e n t a g e
charitable social employment other
Source: CPC/System Three survey
Figure 4.5: Employment Status by Primary Motivation
0% 10% 20% 30% 40% 50% 60% 70%
charitable social employment other
Employed Not employed
Source: CPC/System Three survey
[image:44.595.157.538.398.658.2]against 15% of those who were employed). This is in line with expectations but some care is required in interpreting this result: we do not have a volunteering ‘history’ for each individual and these responses relate to their current volunteering activity which may not be their first.
4.3. The Relationship between Volunteering and Job Entry
4.3.1. Marginally more volunteers are in employment. We have already considered whether this is due to any particular bias in the sample or differences in the basic characteristics of volunteers and non-volunteers (see section 2) - while volunteers tend to be older and have longer unemployment durations on the one hand, they also tend to be proportionately more likely to be female and better educated on the other (both relatively positive factors in predicting an individuals chances of finding work). This section considers further whether voluntary activity has had any impact on the speed at which unemployed people have found work.
4.3.2. Table 4.1 presents the arithmetic mean and median (50th percentile) values for the number of weeks people have been on the Register prior to either entering employment or (for those who have not yet left) the end of July 2000. Although we have presented the mean values, we believe the median values provide a better indicator of the average as they are less prone to the influence of a few very long durations at the upper end of the distribution. According to both measures, however, people who do not volunteer can expect shorter durations on the Register: the median duration on the Register of volunteers in employment is 18% longer than the comparable group who do not volunteer, while for unemployed people the median duration (to end July 2000) is 47% longer for volunteers.
Table 4.1: Average and median durations on Register (last spell in weeks)
Mean Median
Employed Unemployed All Employed Unemployed All
Volunteers 20.0 46.7 35.5 9.1 25.9 17.7
4.3.3. This would suggest a prima facie case that voluntary activity may actually delay a return to employment. Table 4.2 presents comparable durations according to a range of factors (in each case those with closed durations, i.e. the employed, are presented separately to those who remain unemployed). The hypothesis is not entirely borne out by this further analysis. If the 7.7 weeks median value for non-volunteers to find employment is taken as a benchmark, then certain factors in the volunteering experience can reduce the median value of volunteers entering work. Possession of higher level qualifications and working with the public during the voluntary activity make a distinct difference to the speed at which volunteers return to work. Experience in a supervisory role or on-going formal or informal training can also have a positive impact.
Table 4.2: Median durations on Register (last spell in weeks)
Volunteers Employed Unemployed All
Qualifications above level 3 8.3 25.9 16.7
Qualifications below level 3 11.2 25.9 19.6
Volunteered when employed 6.4 16.0 10.1
Volunteered when unemployed 11.3 29.6 21.7
Work with public 7.9 25.9 17.1
Did not Work with public 11.2 26.0 18.7
Undertook supervisory role 8.4 21.7 16.3
No supervisory role 9.3 29.6 18.7
Undertook formal/informal training 8.7 26.0 16.9
No training 9.7 24.0 17.7
Source: CPC/System Three Telephone survey
4.3.5. The view that other factors are playing a role is reinforced by an analysis of the median durations by primary motive for volunteering. According to Table 4.2, those who first volunteer when employed are most likely to have shorter average durations. This would suggest that those whose motive is employment related were more likely to have shorter median durations. However, Table 4.3 suggests that this is not the case: the median duration for those looking to develop their employment prospects through volunteering is longer than those of the other groups. For this to be consistent with the previous finding then on average those motivated by employment and who started to volunteer while employed must have longer durations than those who volunteer for charitable reasons whatever the stage at which they volunteer.
Table 4.3: Median Durations by Primary Motivation
Employed Unemployed All
Charitable 7.9 21.9 13.0
Social/Personal 9.1 21.6 15.0
Employment 13.7 34.6 24.0
Other* - - -
* Fewer than 50 cases so not included Source: CPC/System Three Telephone survey
4.3.6. The time on the Register has also been analysed for those whose last spell on it has been more than 26 weeks, to see if there are any differences between those with volunteering experience and those without. Overall, the median time on the Register for those who have volunteering experience is 46.8 weeks and for those without volunteering experience, 44.6 weeks. A difference of just over two weeks over a total of some 11 months is not significant, but ties in with other findings, that volunteers are likely to spend slightly longer on the Register than non-volunteers. Further analyses, for example by whether they were in employment at the time of the survey, whether they worked with the public and whether they had reviews supports the same conclusion.
weeks) spending less time on the Register than most volunteers (46.8 weeks). This supports the view that employment motivated volunteering does relate to better employment outcomes, but the connection is slight and is based on very small numbers.
4.4. Work history of volunteers and non-volunteers
4.4.1. This section explores whether the work histories of those in the survey appear to be influenced by volunteering activity. In order to do this the contribution of volunteering activity needs to be isolated as far as possible from other factors known to improve an individual’s chances of employment, such as qualifications and possession of a driving licence.
4.4.2. We have access to labour market circumstances at three points in time: the time the database for the survey was extracted from ESED (the end of July 2000), the time of the survey (between October and early December 2000) and the time for which the second extract from ESED was made (January 2001). The proportions of survey respondents who were claiming JSA4 at the
three points in time, by whether they have volunteering experience or not, are shown in the following table:
Table 4.4: Claiming JSA or not at three points in time by volunteering experience or not (%)
Volunteers Non volunteers
July 2000 Claiming JSA 41.2% 41.0%
Not claiming JSA 58.8% 59.0%
Survey (Oct-Dec 2000) Claiming JSA 26.1% 28.1%
Not claiming JSA 73.9% 71.9%
January 2001 Claiming JSA 29.0% 28.7%
Not claiming JSA 71.0% 71.3%
Source: CPC/System Three Telephone survey
4 For the two figures derived from ESED (July 2000 and January 2001), whether they are