Drainage and settlement characteristics of hydraulic fills
284
0
0
Full text
(2) DRAINAGE AND SETTLEMENT CHARACTERISTICS OF HYDRAULIC FILLS. A Thesis Submitted by. Shailesh SINGH in January 2009. for the degree of Doctor of Philosophy. in the School of Engineering James Cook University.
(3)
(4)
(5) ACKNOWLEDGEMENTS. I express my thanks and appreciation to Associate Prof. Nagaratnam Sivakugan for his guidance and insight throughout the research. It would have been impossible to complete my work without his support. Further I would like to thank Dr. Bithin Datta, Dr. Joao Flavio V. Vasconcellos, Dr. Sarvesh Chandra and Dr. Sanjay Kumar Shukla for their suggestions and inputs in completing my research. I would like to acknowledge Mr. Warren O'Donnell for his constant support and assistance in laboratory. I am very thankful to my colleague Dr. Kandiah Pirapakaran for all his help in the research. I would like to extend my thanks to School of Engineering, James Cook University for allowing me to undertake this dissertation. I express my thanks to my family for their understanding, motivation and patience. Lastly, but in no sense the least, I am thankful to all my friends Avinash, Rahul, Girish, Harsha, Garima, Pranvan, Meenan, Sneha, Anuj and Rohit for motivating and keeping me focused on my research. Thank you all.. iv.
(6) Abstract Mining is one of the major export industries in Australia. When the ore is removed from the ground voids are backfilled. Hydraulic backfill and paste fill are most common backfills. These backfills provide safe working conditions and increase the strength of the ground. Hydraulic backfills consist of classified mine tailings with not more than 10% by weight of size less than 10 μm and approximately 70% by solid weight. These are prepared on the surface by dewatering the mine tailings and transported to the stope transported by gravity through boreholes and pipelines. The solid particles of hydraulic fills settle rapidly after entering the stopes. Excess water initially tends to pond on the surface building up from the lowest corners of a stope and then commences a vertical path of drainage due to gravity. Several miners and equipment had been trapped in mines due to barricade failures and the resulting in rush of mine fills into the drives. An extensive study of drainage and settlement characteristics of hydraulic fills is required to improve design of drainage and barricades.. Most permeability measurements reported in the literature are from undisturbed or reconstituted samples in the laboratory under no surcharge. However, in the mine stopes the hydraulic fill is subjected to significant surcharge due to the overburden. In this research, extensive laboratory tests have been performed to measure permeability of hydraulic fill samples subjected to vertical stress. An analytical solution has been developed to estimate vertical stress development in a vertical and inclined mine stope using continuous compression arch of principal stresses. It has been verified with different analytical model discussed in literature. Degree of saturation of hydraulic fills within mine stopes decreases with continuous drainage of water through barricades. Laboratory tests have been performed to study the moisture content variation in a mine stope with depth and time. Soil-water characteristic curves have been developed using Filter Paper Method for hydraulic fills. Permeability of hydraulic fill has been computed using vertical stress and moisture content variation in a stope. It has been shown graphically.. v.
(7) The anecdotal evidence suggests that the consolidation of the deslimed hydraulic fill is instantaneous. In this dissertation, laboratory tests have been conducted using conventional oedometer and modified triaxial cell to measure the settlement of hydraulic fills. It has been found that the immediate settlement and time dependent settlement contributes equally to the total settlement. Pore water pressure dissipation has observed using modified triaxial cell. Time of consolidation and coefficient of consolidation have been estimated and reported. Settlement- effective stress- time plot has been used to investigate the variation of coefficient of secondary compression (Cα) and it has been observed that Cα of hydraulic fill increases with effective stresses and is independent of time.. Concept of equivalent permeability has been used to estimate drainage and maximum pore water pressure in a stope using method of fragments. Empirical equation has been proposed to estimate water level in stope at any time after filling. Reliability analysis has been carried out using First Order-Second Moment Analysis Method to measure the effect of parameter and modeling errors in drainage and settlement analysis. It has been verified using Monte Carlo Simulation.. vi.
(8) List of Publications Journals. Singh Shailesh, Sivakugan Nagaratnam and Chandra Sarvesh (2008). “The permeability of hydraulic fills under surcharge.” International Journal of Geotechnical Engineering, Vol. 2, No. 2, pp. 77-87.. Singh Shailesh and Sivakugan Nagaratnam (2008). “Time dependent settlement in hydraulic fills.” International Journal of Geotechnical Engineering, Vol. 2, No. 4, pp. 293 – 303.. Singh Shailesh, Sivakugan Nagaratnam, and Shukla Sanjay Kumar. (2008). “Arching in an inclined mining stope.” Canadian Geotechnical Journal, (under review).. Singh Shailesh, Sivakugan Nagaratnam, and Shukla Sanjay Kumar (2008). “Can soil arching be insensitive to phi?” International Journal of Geomechanics, ASCE, (under review).. Singh Shailesh, Sivakugan Nagaratnam, and Shukla Sanjay Kumar. (2008). “Stress. reduction factor for a mine stope.” International Journal of Geomechanics, ASCE, (under review).. Singh Shailesh and Sivakugan Nagaratnam (2009). “Soil-water characteristics curve of hydraulic fills.” Geomechanics and Geoengineering (Submitted).. vii.
(9) Refereed Conference Proceedings. Singh Shailesh and Sivakugan Nagaratnam (2007), “Consolidation behavior of hydraulic fills”, 10th Australia New Zealand Conference on Geomechanics, 21st – 24th October 2007 Brisbane. Pirapakaran Kandiah, Singh, Shailesh, and Sivakugan Nagaratnam (2007),”Hydraulic Fill Research at James Cook University in the new Millennium.” Minefill 2007: Innovations and Experience, Proceedings of the 9th International Symposium on Mining with Backfill, 29 April – 3 May, 2007, Montreal, Quebec. Pirapakaran Kandiah, Singh Shailesh and Sivakugan Nagaratnam (2006); " Geotechnical characteristics of Australian mine fills ", Northern Engineering. Conference, 2 – 5. November 2006, University of Central Queensland ,Mackay Australia.. viii.
(10) Table of contents. Table of contents Statement of Access. ii. Statement of Sources. iii. Declaration – Electronic Copy. iii. Acknowledgements. iv. Abstract. v. List of Publications. vii. Table of Contents. ix. List of Figures. xv. List of Tables. xxii. Chapter 1:. Chapter 2:. Introduction 1.1. General. 1. 1.2. Methods of mining. 1. 1.3. Role and importance of backfilling. 2. 1.4. Types of backfill. 4. 1.4.1. Dry fill. 5. 1.4.2. Cemented rock fill. 5. 1.4.3. Hydraulic fill. 5. 1.4.4. Paste fill. 5. 1.5. Problems associated with hydraulic backfilling. 6. 1.6. Problem statement. 6. 1.7. Scope of research. 8. 1.8. Thesis overview. 8. Physical properties of hydraulic fills 2.1. General. 11. 2.2. Review of physical properties of fills. ix. hydraulic. 13.
(11) Table of contents 2.2.1. Grain shape, texture and mineralogy. 13. 2.2.2. Particle size distribution. 15. 2.2.3. Unified Soil Classification System. 16. 2.2.4. Dry. density,. relative. density. and. 17. porosity. 2.3. 2.2.5. Specific gravity. 19. 2.2.6. Permeability. 20. 2.2.7. Consolidation and settlement. 22. 2.2.8. Cohesion and friction angle. 22. Mathematical model to represent particle size. 24. distribution 2.4. Soil-water characteristic curve. 26. 2.4.1. Review of SWCC. 27. 2.4.2. Laboratory tests to develop SWCC using. 29. Filter Paper Method 2.4.3. Test results. 31. 2.4.4. Development of SWCC using particle. 32. size distribution curve. Chapter 3:. 2.5. Residual moisture content. 33. 2.6. Summary and conclusions. 36. State of stress within an underground mine stope 3.1. 3.2. General. 38. 3.1.1 Vertical and inclined stope. 38. 3.1.2 Barricades. 39. 3.1.3 Wall fill friction angle. 42. Review of arching in a vertical and inclined. 43. stopes 3.2.1. Marston (1930). 43. 3.2.2. Terzaghi (1943). 43. 3.2.3. Aubertin et al. (2003). 44. x.
(12) Table of contents Pirapakaran and Sivakugan (2007a). 45. 3.2.5. Handy (1985). 46. 3.2.6. Caceres (2005). 47. 3.2.7. Shukla et al. (2008). 47. 3.3. Arch in soil arching. 48. 3.4. Arching in an inclined stope. 50. 3.5. Comparison of results with previous analysis. 56. 3.6. Stress variation along width of the stope. 57. 3.7. Effect of soil friction angle (φ) on arching. 61. 3.7.1 Sensitivity of soil arching to φ. 64. 3.7.2 Variation of vertical stresses with φ. 67. 3.8. 3.9. Chapter 4:. 3.2.4. Stress reduction factor. 68. 3.8.1. Stress reduction factor (αs). 71. 3.8.2. Average stress reduction factor (αaverage). 75. Summary and conclusions. 81. Laboratory studies of permeability and moisture content variation of hydraulic fill within a model stope 4.1. General. 83. 4.2. Laboratory tests. 85. 4.2.1. 86. Modified Oedometer test to measure permeability. 4.2.2. Sample. properties. and. sample. 87. preparation for modified oedometer test 4.2.3. Separable ring apparatus to measure. 89. moisture content variation with depth 4.2.4. Laboratory test to measure moisture. 90. content variation with time 4.3. Permeability of hydraulic fill under surcharge. 91. 4.4. Effect of specific gravity and other physical. 97. xi.
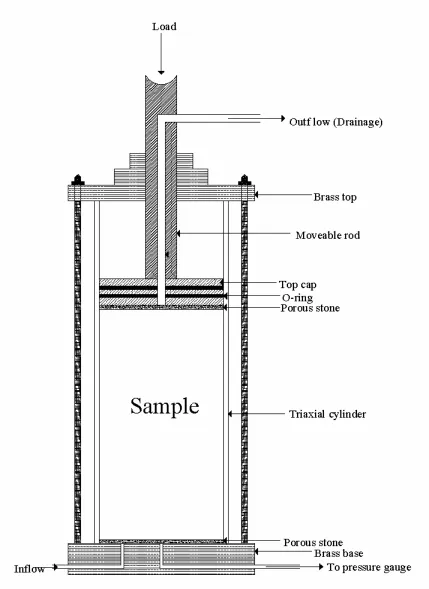
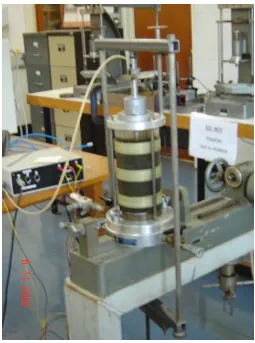
(13) Table of contents properties on permeability 4.5. Permeability variation of hydraulic fill with. 98. moisture content 4.5.1. Average. moisture. content. variation. 99. within stope 4.5.2. Permeability variation with moisture. 100. content 4.6. Variation of permeability of hydraulic fill with. 104. depth in a stope 4.6.1. Stress and moisture content variation. 105. depth in stope 4.6.2 4.7. Chapter 5:. Permeability variation with depth. Summary and conclusions. 106 111. Time dependent settlement in hydraulic fills 5.1. General. 5.2. Review. 113 of. consolidation. and. secondary. 114. compression 5.3. Review of settlement of hydraulic fills. 119. 5.4. Comparison of settlement of sand and hydraulic. 119. fills 5.5. Laboratory tests. 121. 5.5.1. Sample preparation for settlement tests. 122. 5.5.2. Oedometer test of hydraulic fills. 123. 5.5.3. Tests on large cylindrical cell to measure. 126. settlement 5.5.4. Modified. triaxial. cell. to. measure. 127. consolidation and pore pressure 5.6. Laboratory test results. 127. 5.6.1. Oedometer test. 129. 5.6.2. Tests on large cylindrical apparatus. 132. xii.
(14) Table of contents 5.6.3. Modified triaxial cell test. 133. 5.7. Immediate settlement. 134. 5.8. Consolidation settlement. 136. 5.9. Secondary compression of hydraulic fills. 139. 5.10. Permeability –. vertical. effective. stress. –. 141. settlement relationship 5.11 Chapter 6:. Drainage and pore pressure development within a stope 6.1. General. 149. 6.2. Method of fragments. 150. 6.2.1. 151. Equivalent permeability. 155. 6.4. Drainage from mine stope. 161. 6.4.1. Problem definition. 164. Summary and conclusions. 168. Reliability of drainage and settlement analysis 7.1. General. 171. 7.2. First Order-Second Moment Analysis. 172. 7.3. Monte Carlo Simulation. 175. 7.4. Reliability of drainage analysis of stope. 175. 7.4.1. Uncertainty in permeability. 176. 7.4.2. Uncertainty in drainage. 179. 7.4.3. Uncertainty in pore water pressure. 181. 7.5. Chapter 8:. Method of fragment for 2-D mine stope. 6.3. 6.5. Chapter 7:. Summary and conclusions. Summary and conclusions. 185. Summary, conclusions and recommendations 8.1. Summary. 187. 8.2. Conclusions. 190. 8.2.1. 191. Properties of saturated and unsaturated hydraulic fills. xiii.
(15) Table of contents. 8.3. 8.2.2. Effect of arching on vertical stresses. 191. 8.2.3. Permeability of hydraulic fills. 192. 8.2.4. Settlement of hydraulic fills. 193. 8.2.5. Drainage and Reliability analysis. 193. Recommendation for future research. 194. 8.3.1. Non-homogeneous hydraulic fill in stope. 195. 8.3.2. Arching analysis in a 3-D stope. 196. References. 197. Appendices Appendix A. Soil-water characteristic curve and residual moisture content. 215. A1.1. Development of matric suction curve from particle size. 216. distribution A1.2. Computation of permeability of unsaturated soil using. 220. soil-water characteristic curves A1.3. Soil-water characteristic curve to estimate permeability. 222. of hydraulic fills A2.1. Comparison of matric suction of hydraulic fills samples. 223. A1, C1 and C2 measured in laboratory and computed using particle size distribution A2.2. Final moisture content variation of hydraulic fill. 224. samples on sieve vibrator Appendix B. Moisture content and permeability variation in a mine stop. 235. B.1. Average moisture content variation of hydraulic fill. 236. samples B.2. Moisture content variation width depth and time. 240. B.3. Permeability variation with depth. 244. Appendix C. Typical settlement of hydraulic fills. Appendix D. Equivalent permeability variation of hydraulic fill in the mine stope. xiv.
(16) List of Figures. List of Figures 1.1. Underground mine at Osborne, Queensland Australia. 2. 1.2. Room and pillar and cut and fill mining methods (Adapted from 3 Hamrin, 2001). 1.3. Disposed tailing and tailing dam at Osborne Mine Queensland. 4. 2.1. Schematic diagram of hydrocyclone. 12. 2.2. Hydrocyclone cluster (After Grice, 2005). 13. 2.3. Electronic micrograph of hydraulic fill samples A1, B1, B2 and C2. 14. 2.4. Particle size distribution curves of 15 hydraulic fills of Australian 16 mines (From Rankine, 2005). 2.5. Dry density versus specific gravity (Adapted from Rankine et al. 18 2006). 2.6. Void ratio versus relative density of hydraulic fills (Adapted from 20 Rankine et al. 2006). 2.7. Variation of permeability of sedimented hydraulic fills in laboratory 21 with effective grain size. 2.8. Friction angle versus relative density of hydraulic fills. 25. 2.9. Comparison of particle size distribution curve of hydraulic fills 26 measured in laboratory and estimated using Equation 2.12. 2.10. Unsaturation of hydraulic fills in a mine stope. 27. 2.11. Schematic diagram of laboratory setup for measuring matric suction 30 using filter paper method. 2.12. Calibration curve for estimating suction using filter paper Whatman 31 No. 42 (Fawcett and Collis-George 1967). 2.13. Matric suction of hydraulic fills samples measured using Filter Paper 32 method. 2.14. Comparison of matric suction of hydraulic fills samples B1 and B2 33 measured in laboratory and computed using particle size distribution. xv.
(17) List of Figures 2.15. Residual moisture content using SWCC. 34. 3.1. Schematic diagram of a stope. 39. 3.2. Schematic diagram of a mine stope. 40. 3.3. Schematic diagram of 2-D mine stope. 40. 3.4. Example of barricade in a stope (After Handbook on Mine Fill). 41. 3.5. Failed barricade walls. 41. 3.6. Field conditions controlling the value of wall-backfill interface 42 friction angle (δ). 3.7. Arching stress at rough wall. 46. 3.8. Differential element in classical soil arching. 49. 3.9. Schematic diagram of an inclined stope and compression arch. 51. 3.10. Free body diagram of the arch. 52. 3.11. Vertical stress variation with depth for φ = 360. 58. 3.12. Vertical stress variation with depth for an inclined stope for φ = 360 59 and inclination (α) of 750, 800 and 850 with horizontal. 3.13. Continuous compression arch within an inclined stope. 60. 3.14. Vertical stress variation along the width for an inclined stope for φ = 62 360 and inclination (α) of 750, 800, 850 and 900 with horizontal at z/B = 1, 2, 3 and 5.. 3.15. Variation of μK against φ for K = Ka (Active earth pressure 65 coefficient). 3.16. Variation of μK against φ for K = K0 (Earth pressure coefficient at 66 rest). 3.17. Variation of μK against φ for K = KKrynine. 67. 3.18. Effect of φ on the vertical stress σv at depth of z = B. 69. 3.19. Effect of φ on the vertical stress σv at depth of z = 3B. 70. 3.20. Vertical normal stress variation in a mine stope. 71. 3.21. Stress reduction factor for vertical stope. 3.22. 73 0. 0. Stress reduction factor for inclined stope (inclination of 75 , 80 , 85. 0. and 900 with horizontal). xvi. 74.
(18) List of Figures 3.23. Variation of stresses using αs and αsaverage from vertical normal stress 77 estimated using Marston’s theory at z/B= 5. 3.24. Average stress reduction factor for vertical stope. 79. 3.25. Average stress reduction factor for inclined stope (inclination of 750, 80 800, 850 and 900 with horizontal). 4.1. The variation of permeability of sedimented hydraulic fills in 85 laboratory under surcharge with effective grain size. 4.2. Modified oedometer. 86. 4.3. Arrangement for measurement of permeability by falling head method. 87. 4.4. Particle size distribution curve for hydraulic fills samples for 88 permeability test under surcharge. 4.5. Schematic diagram of separable ring cell. 89. 4.6. Schematic diagram of apparatus used for measuring moisture content 90 with time. 4.7. Void ratio variation with vertical effective stress. 91. 4.8. Permeability variation with vertical effective stress. 93. 4.9. Permeability versus consolidation pressure (Adapted from Cedergen 94 1967). 4.10. Variation of void ratio with permeability for hydraulic fills. 95. 4.11. Void ratio versus permeability for different soil (Adapted from Lambe 96 and Whitman, 1969). 4.12. Empirical coefficients a and k0. 97. 4.13. Variation of permeability with χ. 99. 4.14. Average moisture content variations for sample B2. 100. 4.15. Permeability variations of hydraulic fills with matric suction. 102. 4.16. Permeability variations of hydraulic fills with moisture content. 103. 4.17. Variation of relative permeability with degree of saturation. 104. 4.18. Moisture content variations with height ratio for sample B2 at end of 106 4, 6, 10, 15 and 30 days.. 4.19. Permeability variation of sample A1 with depth for stope width (B) of 108 10, 20, 30, 40 and 50 m.. xvii.
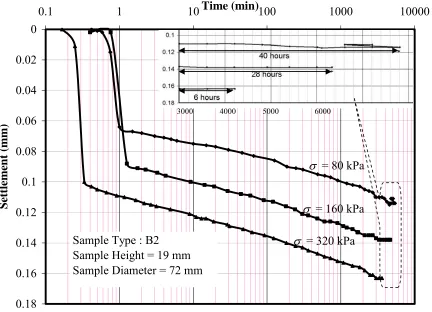
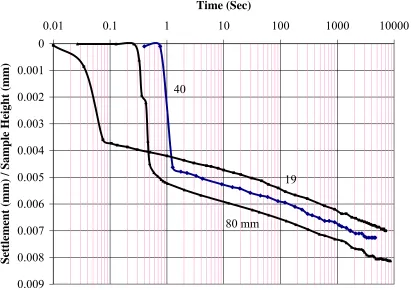
(19) List of Figures 4.20. Permeability variation of sample A1 with depth for stope width (B) of 109 20m in stope of inclination (α) of 700,750, 800, 850 and 900 with horizontal.. 4.21. Permeability variations with depth of stope for stope width of 20 m 110 and degree of saturation of 0.6, 0.7, 0.8, 0.9 and 1.0. 5.1. Typical settlement behavior of clays, silty-sands and sands. 116. 5.2. ε-p-t (strain – vertical stress – time) plots for clays (Adapted from 118 Barden, 1969). 5.3. Particle size distribution curves for hydraulic fills of Australian mines. 120. 5.4. Comparison of settlement behavior of hydraulic fill and sand. 122. 5.5. Conventional oedometer apparatus. 124. 5.6. Schematic diagram of Oedometer. 124. 5.7. One side drainage in oedometer. 125. 5.8. Arrangement to increase the sample height in the conventional 125 oedometer. 5.9. Large apparatus to measure settlement of hydraulic fills. 126. 5.10. Schematic diagram of modified triaxial cell. 128. 5.11. Modified triaxial cell arrangement. 129. 5.12. Typical settlement curves for hydraulic fills. 130. 5.13. Typical settlement curves for hydraulic fills for different height of 131 sample at vertical effective stress increased from 80 kPa to 160 kPa (Sample B2). 5.14. Settlement of hydraulic fills sample B2 in large cylindrical cell with 132 final load of 80 kPa, 160 kPa and 320 kPa. 5.15. Settlement of hydraulic fill sample C2 in modified triaxial cell. 133. 5.16. Pore water pressure variation of sample C2 in modified triaxial cell. 134. 5.17. Immediate settlement versus total settlement. 135. 5.18. Immediate settlement variation with vertical effective stress for 136 sample B2. 5.19. Coefficient of consolidation variation with vertical effective stress. 139. 5.20. Settlement -vertical stress-time plot for sample C1. 141. xviii.
(20) List of Figures 5.21. Settlement-vertical stress – time plot for samples of different thickness 142. 5.22. Permeability versus vertical effective stresses. 144. 5.23. Void ratio versus vertical effective stresses. 145. 6.1. Flow net of two dimensional mine stope from FLAC (Sivakugan and 152 Rankine 2006). 6.2. Selected equipotential lines from FLAC (Sivakugan and Rankine 152 2006). 6.3. Fragments in a 2-D mine stope (Adapted from Sivakugan et al. 2006). 153. 6.4. Form factor Φ2 for fragment 2. 154. 6.5. Comparison of form factor Φ2 for fragment 2 computed using 155 numerical method and empirical equation (Equation 6.6). 6.6. Schematic diagram showing permeability variation in a mine stope. 157. 6.7. Variation of equivalent permeability (keq) in a mine stope for stope 159 width of 30 m. 6.8. Effect of width of stope on equivalent permeability for hydraulic fill 160 sample A1. 6.9. Stope geometry for drainage and maximum pore water pressure 165 analysis. 6.10. Variation of drainage and other parameters with time in a mine stope. 166. 6.11. Effect of permeability on maximum pore water pressure. 168. 7.1. Correlation between a and k0. 179. 7.2. Standard deviation of permeability for hydraulic fill samples. 180. 7.3. Probability distribution function for drainage from mine stope. 182. 7.4. Probability distribution function for pore water pressure. 183. 7.5. Cumulative probability of distribution of u < u*. 184. 7.6. Range of pore water pressure for confidence limit of 80% and 90%. 185. 8.1. Particle size distribution of hydraulic fills variation with depth. 195. A1.1. Particle size distribution of hydraulic fill sample A1. 217. A1.2. Comparison of matric suction measured in laboratory and computed. 219. from particle size distribution for hydraulic fill sample A1. A1.3. Soil-water characteristic curve to estimate permeability of hydraulic. xix. 222.
(21) List of Figures fills A2.1. Comparison of matric suction of hydraulic fills samples A1, C1 and. 223. C2 measured in laboratory and computed using particle size distribution B1.1. Average moisture content variation for sample A1. 236. B1.2. Average moisture content variation for sample B2. 237. B1.3. Average moisture content variation for sample C1. 238. B1.4. Average moisture content variation for sample C2. 239. B2.1. Moisture content variations with height ratio for sample A1 at end of 240 4, 6, 10, 15 and 30 days.. B2.2. Moisture content variations with height ratio for sample B1 at end of 241 4, 6, 10, 15 and 30 days.. B2.3. Moisture content variations with height ratio for sample C1 at end of 242 4, 6, 10, 15 and 30 days.. B2.4. B2.4 Moisture content variations with height ratio for sample C2 at 243 end of 4, 6, 10, 15 and 30 days.. B3.1. Permeability variation of saturated hydraulic fill sample B1 with depth 244 for stope width (B) of 10, 20, 30, 40 and 50 m.. B3.2. Permeability variation of saturated hydraulic fill sample B2 with depth 245 for stope width (B) of 10, 20, 30, 40 and 50 m.. B3.3. Permeability variation of saturated hydraulic fill sample C1 with depth 246 for stope width (B) of 10, 20, 30, 40 and 50 m.. B3.4. Permeability variation of saturated hydraulic fill sample C2 with depth 247 for stope width (B) of 10, 20, 30, 40 and 50 m.. B3.5. Permeability variation of saturated hydraulic fills sample B1 with 248 depth for stope width (B) of 20m in stope of inclination (α) of 700,750, 800, 850 and 900 with horizontal. B3.6. Permeability variation of saturated hydraulic fills sample B2 with 249 depth for stope width (B) of 20m in stope of inclination (α) of 700,750, 800, 850 and 900 with horizontal. B3.7. Permeability variation of saturated hydraulic fills sample C1 with 250. xx.
(22) List of Figures depth for stope width (B) of 20m in stope of inclination (α) of 700,750, 800, 850 and 900 with horizontal B3.8. Permeability variation of saturated hydraulic fills sample C2 with 251 depth for stope width (B) of 20m in stope of inclination (α) of 700,750, 800, 850 and 900 with horizontal. C1.1. Settlement curve of hydraulic fill sample A1. 254. C1.2. Settlement curve of hydraulic fill sample B1. 254. C1.3. Settlement curve of hydraulic fill sample C1. 255. C1.4. Settlement curve of hydraulic fill sample C2. 255. D1.1. Variation of equivalent permeability for hydraulic fill sample B1 with 257 depth. D1.2. Variation of equivalent permeability for hydraulic fill sample B2 with 258 depth. D1.3. Variation of equivalent permeability for hydraulic fill sample C1 with 259 depth. D1.4. Variation of equivalent permeability for hydraulic fill sample C2 with 260 depth. xxi.
(23) List of Tables. List of Tables 2.1. Geotechnical properties of hydraulic fills. 17. 2.2. Friction angle (φ) of hydraulic fills in degree (Pirapakaran, 2008). 24. 2.3. Measurement of final moisture content of B2 for 47.7 mm high 35 sample. 2.4. Effect of sample height on final moisture content of B2. 36. 3.1. Average values of μK. 68. 3.2. Earth pressure coefficient and wall friction angle used to estimate 72 stress reduction factor. 3.3a. Empirical coefficient for vertical stopes to estimate αs. 75. 3.3b. Empirical coefficient for inclined stopes to estimate αs. 76. 3.4a. Empirical coefficient for vertical stopes to estimate αaverage. 81. 3.4b. Empirical coefficient for inclined stopes to estimate αaverage. 81. 4.1. Properties of hydraulic fills samples A1, B1, B2, C1, and C2. 88. 4.2. Empirical coefficient ‘a’ and ‘k0’ of mine tailings. 92. 5.1. Time required for 90% consolidation of hydraulic fills. 137. 5.2. Coefficient of consolidation for hydraulic fills and other soils. 138. 5.3. Ck values for hydraulic fills, mine tailings, and other soils. 146. 5.4. Ck/Cc for hydraulic fills and mine tailings. 146. 6.1. Input parameter for drainage and maximum pore water pressure 165 analysis. 7.1. Coefficient of variation of parameters used in estimating permeability 178 of hydraulic fills. 7.2. Cross correlation coefficient of parameter a , γ , k0 , δ , and K for 179 hydraulic fill. 7.3. Coefficient of variation and standard deviation of parameters for 181 Sample B2 for uncertainty analysis in drainage. xxii.
(24) List of Tables A2.1. Measurement of final moisture content of A1 for 23.9 mm high. 224. sample A2.2. Measurement of final moisture content of A1 for 47.7 mm high. 224. sample A2.3. Measurement of final moisture content of A1 for 71.6 mm high. 225. sample A2.4. Measurement of final moisture content of A1 for 95.4 mm high. 225. sample A2.5. Measurement of final moisture content of B1 for 23.9 mm high. 226. sample A2.6. Measurement of final moisture content of B1 for 47.7 mm high. 227. sample A2.7. Measurement of final moisture content of B1 for 71.6 mm high. 227. sample A2.8. Measurement of final moisture content of B1 for 95.4 mm high. 228. sample A2.9. Measurement of final moisture content of B2 for 23.9 mm high. 228. sample A2.10. Measurement of final moisture content of B2 for 47.7 mm high. 229. sample A2.11. Measurement of final moisture content of B2 for 71.6 mm high. 229. sample A2.12. Measurement of final moisture content of B2 for 95.4 mm high. 230. sample A2.13. Measurement of final moisture content of C1 for 23.9 mm high. 230. sample A2.14. Measurement of final moisture content of C1 for 47.7 mm high. 231. sample A2.15. Measurement of final moisture content of C1 for 71.6 mm high. 231. sample A2.16. Measurement of final moisture content of C1 for 95.4 mm high. xxiii. 232.
(25) List of Tables sample A2.17. Measurement of final moisture content of C2 for 23.9 mm high. 232. sample A2.18. Measurement of final moisture content of C2 for 47.7 mm high. 233. sample A2.19. Measurement of final moisture content of C2 for 71.6 mm high. 233. sample A2.20. Measurement of final moisture content of C2 for 95.4 mm high sample. xxiv. 234.
(26) Chapter 1. Introduction. Chapter 1 Introduction 1.1 General Mining is a multi-billion dollar export industry in many developed and developing countries such as Australia, Brazil, Canada, China, India, etc., where it remains the backbone of the economy. Mining is a large, vital and lucrative business. Its rewards are spread across a wide cross-section of our population. The mines contribute the raw materials for the construction and manufacturing and most of the minerals needed for our society.. Undeniably, the evolution of mining is playing an important role in Australia.. When ore is removed from mines, large underground voids known as stopes are created. Stopes can be approximated as rectangular parallelepipe and they can have plan dimensions of 20 – 60 m and heights as much as 200 m, and are filled tailings, left over from the mineral extraction process. Different types of backfill materials are used for backfilling depending on the availability and requirements. Hydraulic and paste backfills are the major one. Drainage and settlement is major concern for all the hydraulic backfilled mines. Since stope can have height of up to 200m, even 1% settlement in the hydraulic fill cause a total settlement of up to 2 m, which will leave a large space over backfilled surface. In this dissertation, drainage and settlement characteristics of hydraulic backfills have been studied.. 1.2 Methods of mining There are several mining methods. These can be classified as open pit surface mining and underground mining. In open pit surface mining method, mines are left open after. 1.
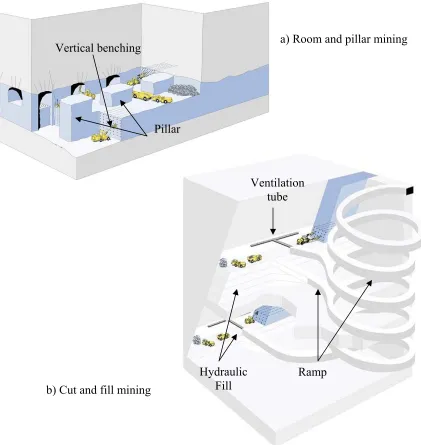
(27) Chapter 1. Introduction. excavation of ore. These days, most of the mines are using underground mining methods over open pit surface mining. Figure 1.1, shows under ground mine at Osborne Mine in Queensland, Australia. Underground mining can be divided into room and pillar method; and cut and fill method. Room and pillar mining (Figure 1.2a) is designed for mining of flat, bedded deposits of limited thickness whereas cut and fill mining (Figure 2.b) is applied for mining of steeply dipping ore bodies, in strata with good to moderate stability, and a comparatively high grade mineralization. Cut and fill mining provides better selectivity; therefore it is preferred for ore bodies of irregular shape and scattered mineralization. Cut-and-fill mining excavates the ore in horizontal slices, starting from a bottom undercut, advancing upward (2.b). The ore is drilled, blasted, the muck loaded and removed from the stope. When the full stope area has been mined out, voids are backfilled with sand, tailings or waste rock.. Access Drive b) Underground mine showing access. a) Underground mine. drive Figure 1.1 Underground mine at Osborne, Queensland Australia. 1.3 Role and importance of backfilling The large voids created in the process of underground mining operations are generally backfilled by mill tailings that are produced in mining operation after crushing crude ore in a milling process and grounding it in ball mills or rod mills to a particle size small enough to free the minerals. After removing the minerals from crushed ore, the waste is 2.
(28) Chapter 1. Introduction. either pumped into tailing disposal ponds, as shown in Figure 1.3 or classified for use as hydraulic fills (Pettibone and Kealy, 1971).The underground voids, that are backfilled are known as stopes, and can be approximated as rectangular prisms, which can have heights exceeding 200 meters. These voids are backfilled on the completion of ore extraction. Backfills provide local and regional stability of rock while removing the adjacent stopes in order to continue the mining sequence.. a) Room and pillar mining. Vertical benching. Pillar. Ventilation tube. b) Cut and fill mining. Hydraulic Fill. Ramp. Figure 1.2 Room and pillar and cut and fill mining methods (Adapted from Hamrin, 2001). 3.
(29) Chapter 1. Introduction. Mine wastes contains heavy minerals which causes several environmental hazards. Disposal of mine wastes have been a major issue for environmentalist. Backfilling of mine stopes using mine tailings (mine wastes) gives a solution to this problem and reduces surface environmental impacts. It also provides safe working conditions and platform for equipments required for mining process by increasing ground strength.. a) Disposed tailing. b) Tailing dam. Figure 1.3 Disposed tailing and tailing dam at Osborne Mine Queensland. 1.4 Types of backfill There are several types of minefill materials based on combinations of surface processing plant by-products called tailings, and waste or quarried rock. These minefill materials include tailings-based products such as paste fill, hydraulic fill and cemented hydraulic fill, sand fill, cemented sand fill, rock fill, cemented rock fill, aggregate and cemented aggregate fill (Bloss, 1992). The three major fill types used in Australia are hydraulic fills, pastefills and cemented hydraulic fills (Grice, 2001). Typical backfilled used by mine industries are discussed below.. 4.
(30) Chapter 1 1.4.1. Introduction. Dry Fill. Dry fills consists of unclassified gravel, waste rock and slag. These days, use of dry fills is very rare. These are generally unclassified except to remove large boulders. These are transported underground by dropping down a height above the surface directly into the stope. These are suitable for mechanized cut and fill method. It is very rarely used these days. 1.4.2. Cemented rock fill. When cement slurry is added to waste rock to improve the bond strength of rock fragment, it is known as cemented rock fills. It contains coarse and fine aggregates. Both classified and unclassified waste rock can be used to prepare cemented rock fill. These contain a mixture of coarse aggregate and fine aggregates to minimize the void space in the fill. The cement slurry is approximately 55% by weight. It is used in open stopes, undercut and fill. It is suitable for long hole stopes and cut and fill method where a structural fill is required. 1.4.3. Hydraulic fill. Hydraulic backfill can consist either of mine tailings or sand deposits mined off the site. Hydraulic fill is prepared on the surface by dewatering the mine tailings to approximately 65-70% solids by weight. It consist of classified mine tailing with not more than 10% by weight of size less than 10 μm. These are placed underground in the form of slurry, introducing substantial quantities of water into the stope.. These are hydraulically. pumped to stopes through pipes. Hydraulic fills are discussed in detail later in this dissertation. 1.4.4. Paste fill. 5.
(31) Chapter 1. Introduction. Paste fills are newest form of mining backfill, which are produced from the full mill tailings and has a much finer grain size distribution than any other form of backfill. Typically it has a minimum of 15% of the material smaller than 20 μm. Typically the maximum size of particles in paste is between 350 – 400 μm. Paste fill can be defined as a mixture of tailings, cement and water and in its uncured state particles do not settle out. Cement and water are added to the mix to achieve the required rheological and strength characteristics.. 1.5 Problems associated with hydraulic backfilling In 1997, five hydraulic backfill failed in Australian mines due to delivery of excess quantity of transport water from low density slurry (Grice, 1998a). On June 26, 2000 three men were killed when around 18000 m3 of fill entered the lower levels of a gold mine in the northern Goldfield of Western Australia (Potential Hazards Associated with Mine fill, Department of Mineral and Petroleum Resources Western Australia, Safety Bulletin) due to the failure of fill barricades. Most of the failures take place in the early hours of filling and are caused by the presence of excess water within the mine fill. The major cause barricades failure is attributed to the build-up of high pore water pressure behind the barricades resulting the liquefaction due to blasting or piping.. 1.6 Problem statement Mine stopes are backfilled using hydraulic fills. These are transported through pipelines in the form of slurry, at 65-75% solids content, implying water contents of 33-54%. It settles within the stope under its self-weight, draining through the barricades that cover the horizontal access drives. The solid particles of hydraulic fills settle rapidly after entering the stopes. Excess water initially tends to pond on the surface building up from the lowest corners of the mine stope and then commences a vertical path of drainage due to gravity. Since hydraulic fills are placed as slurry, there is substantial amount of water entering the stope. Several hydraulic backfilled mine have failed due to presence of excess water in stope and development of high pore water pressure. Sivakugan and. 6.
(32) Chapter 1. Introduction. Rankine (2006); and Sivakugan et al. (2006) used method of fragments to estimate drainage and maximum pore water pressure in the stope. Isaac and Carter (1983) developed a numerical model for same. Several analysis and numerical modeling haves been done to predict measure pore water pressure and drainage from stope. In most of the numerical modeling work carried out to date, simulating the drainage through hydraulic fills, it is assumed that the permeability of the fill remains constant with depth (Isaacs and Carter, 1983; Sivakugan et al., 2006; Sivakugan and Rankine, 2006; and Rankine, 2004 and 2007). The hydraulic fills in at the mine stopes are under several meters of overburden which reduces voids in the hydraulic fills thus reduces permeability. Hydraulic fill transfer a part of its self weight to the adjacent rock mass in the process of self-weight settlement due their friction between hydraulic fill and adjacent rock wall (Sivakugan 2008). This process of reduction in vertical normal stress is known as arching. Stress reduction in a two dimensional vertical and inclined mine stope have been studied in this dissertation. In this dissertation, modified oedometer has been used to measure permeability variation with vertical effective stress. Effect of moisture content on permeability has been studied using soil – water characteristic curve, which has been developed using filter paper method. Permeability variation in a mine stope with depth has been studied and equivalent permeability has been used to compute drainage and maximum pore water pressure using method of fragments. When hydraulic fill is placed in the underground voids in the form of slurry, the settlement takes place solely under the self-weight. It has been assumed that the consolidation of hydraulic fills is over within seconds. In this dissertation, several laboratory tests have been conducted on oedometer and modified triaxial cell to measure settlement and pore water dissipation in hydraulic fill samples. Concept of secondary compression has been used to understand the settlement behavior of hydraulic fills. Reliability analysis has been carried out to study uncertainties in numerical and laboratory modeling.. 7.
(33) Chapter 1. Introduction. 1.7 Scope of research The main objectives of this research are as following: i.. Study the effect of arching on vertical stress in an inclined and vertical mine stope using compression arch of principal stresses and compare it with arching models used by Marston (1930), Handy (1985), Aubertin et al. (2003), and Pirapakaran and Sivakugan (2007a and 2007b).. ii.. Develop soil-water characteristic curve (SWCC) for hydraulic fills using Filter Paper method and estimate residual moisture content in hydraulic fills.. iii.. Carryout laboratory tests to measure permeability of hydraulic fills under surcharge.. iv.. Study moisture content variation with depth and time within the stopes and develop permeability variation with depth in a mine stope using SWCC, surcharge and moisture content variation.. v.. Predict the time dependent settlement (Consolidation and secondary compression) and pore water pressure dissipation in hydraulic fills fill samples.. vi.. Estimate of drainage and pore water pressure using method of fragments and equivalent permeability.. vii.. Carryout the reliability analysis to study uncertainty in numerical and laboratory modeling.. 1.8 Thesis overview Chapter 1 introduces mining methods and different type of backfills used by mining industry. It gives an overview of the importance and problem associated with backfilling of mines using hydraulic fills. An overview of the thesis has been given in this section. Physical properties of hydraulic fills are discussed in Chapter 2. Review of physical properties available, in literature such as grain shape, texture, mineralogy, particle size distribution, specific gravity, permeability, consolidation, etc are briefed in this chapter.. 8.
(34) Chapter 1. Introduction. An empirical equation has been proposed to estimate hydraulic fill internal friction angle using relative density. A mathematical model has been developed to predict particle size distribution of hydraulic fills which has been used in establishing soil – water characteristic curve for hydraulic fills numerically. Filter paper method has been to measure matric suction of hydraulic fills and soil – water characteristic curves has established. Residual and saturation moisture content of hydraulic fills have been reported in this chapter. State of stress within an underground mine has been discussed in Chapter 3. Concept of arching has been reviewed in this chapter. A brief description of backfill stope interface angle has been given. An analysis has been carried out to estimate vertical stress in an inclined and vertical stope using compression arch of principal stresses. An equation has been proposed to estimate the vertical stresses within the inclined stope for any backfill under a surcharge. In this chapter, a methodology has been proposed to calculate the vertical stress distribution along the width of inclined stope. The variation of stresses along the width of stope is graphically shown. Effects of hydraulic fill friction angle (φ) and wall-backfill interface angle (δ) on vertical stress have been studied and discussed in this chapter. Concept of stress reduction factor (αs) and average stress reduction factor (αaverage) have been introduced to estimate average stress at any depth in the stope. Chapter 4 discusses permeability and moisture content variation in a stope. Laboratory tests have been conducted to study effect of surcharge on permeability. Empirical equations have been proposed to estimate permeability from surcharge and other physical properties such as specific gravity and relative density of hydraulic fills. Variation of moisture content with depth and time in laboratory models representing stopes have been discussed in this chapter. It has been used with SWCC and stress due arching in estimating permeability variation with depth in a mine stope. Concept of cutoff permeability is also discussed in this chapter. Settlement of hydraulic fills is discussed in Chapter 5. Extensive laboratory tests that have been used to measure settlement and pore water pressure dissipation have been. 9.
(35) Chapter 1. Introduction. reported in this chapter. An empirical equation has been given in this chapter to estimate total settlement of hydraulic fills. Settlement – effective stress – time plot has been used to investigate the variation of coefficient of secondary compression. Coefficient of consolidation and pore water pressure dissipation are also reported in this chapter. Chapter 6 describes method of fragments that has been used by Sivakugan and Rankine (2006) and Sivakugan et al. (2006) to compute drainage and maximum pore water pressure in a stope. It also discusses the concept of equivalent permeability that has been proposed to use for estimating drainage and maximum pore water pressure. A methodology has been given in this chapter to calculate time dependent drainage and pore water pressure in hydraulic backfilled stope. Chapter 7 gives details of uncertainty analysis of drainage and pore water pressure analysis used in this dissertation. First Order – Second Moment (FOSM) and Monte Carlo simulation has been described briefly in this chapter. FOSM has been used for reliability analysis and it has been verified using Monte Carlo simulation. Summary and conclusions of the research and recommendations for future research are presented in Chapter 8.. 10.
(36) Chapter 2. Physical Properties of Hydraulic Fills. Chapter 2 Physical Properties of Hydraulic Fills 2.1 General Tailings are produced in mining operation after crushing crude ore in a milling process and grounding it in ball mills or rod mills to a particle size small enough to free the minerals. After removing the minerals from crushed ore, the waste is either pumped into tailing disposal ponds or classified for use as hydraulic fills (Pettibone and Kealy, 1971). Hydraulic fills are class of mine fills that are delivered as high density slurry through boreholes and pipelines to the mine stopes. Water-borne delivery method is the reason behind the name, hydraulic fill. These are also known as conventional backfill, slurry backfill, or sand fill. Hydraulic fills generally have maximum particle size less than 1 mm and not more than 10% of weight less than 10 μm (i.e. D10 > 10 μm). Hydraulic fill slurries are prepared at densities between 40 to 50 % solid by volume or greater than 65 – 70 % solid by weight, implying water contents of 33 – 54% (Grice 2005). Hydraulic fills are prepared from classified mine tailings or sands or esker deposits mined on the surface. It is frequently the case that mine tailings do not have sufficient coarse fraction to meet the hydraulic backfill requirements so the mines may add borrowed sand or fill parts of the stopes with waste rocks wherever possible. These are most commonly prepared using hydrocyclones. Schematic diagram of hydrocylone is shown in Figure 2.1 Hydrocyclones use vortex mechanism to achieve the classification process. Mine tailing slurries, at densities 15–35% solid by weight, are pumped through a cluster of. 11.
(37) Chapter 2. Physical Properties of Hydraulic Fills. hydrocyclones (Figure 2.2). The slurry enters the top of the unit tangentially and commences a spiral downward flow around the perimeter of hydrocyclone. Heavier particles remain closer to the body wall and finer particles tend toward central axis with water. Finer particles and water travel upwards through the inner vortex and heavier particles and remaining water exit the hydrocyclone via the spigot. The underflow product is deslimed and dewatered hydraulic fills whereas overflow is rejected to the final tailing storage facilities such as tailing dams.. Hydraulic Fill (Finer particles). Tailing slurry. Heavier particles Figure 2.1 Schematic diagram of hydrocyclone Hydraulic fills are placed in mine stope in form of a loose structure with a void ratio of about 0.7 (http://www.mininglife.com/Miner/Backfill/Types_of_%20Mine_Backfill.htm). In practice, an apparent cohesion often develops in uncemented sandfill which increases the shear strength of the backfill. Vibratory forces due to blasting in neighboring stopes can densify the fill and increase the shear strength. Very small amount of cement and other binders are added to hydraulic fills to increase the cohesion.. 12.
(38) Chapter 2. Physical Properties of Hydraulic Fills. Hydraulic fills provides good working surface for mechanized mining machines. It reduces surface storage and environmental problems caused by presence of heavy metals in mine wastes. Main disadvantage of hydraulic fills is the amount of water that drains from the mine stope and must be pumped back to the surface (Cooke 2001).. Hydrocyclones. Figure 2.2 Hydrocyclone cluster (After Grice, 2005). 2.2 Review of physical properties of hydraulic fills Hydraulic backfills consist of either mine tailings or sand deposits mined off the site, where the effective grain size (D10) is greater than 10 μm. These are prepared on the surface by passing the tailings through hydrocyclones where the very fine fraction is removed, leaving only silt and sand sized grains. These are transported through pipelines in the form of slurry, at 65-75% solids content, implying water contents of 33-54%. This slurry settles within the stope under its self-weight, draining through the barricades that cover the horizontal access drives. Physical and geotechnical properties of hydraulic fills are discussed in this chapter. 2.2.1 Grain shape, texture and mineralogy. 13.
(39) Chapter 2. Physical Properties of Hydraulic Fills. Hydraulic fills are prepared from crushing of waste rock or waste products from mining operation from the milling process. These consist of hard, angular particles and siliceous particles (http://www.tfhrc.gov/hnr20/recycle/waste/mwst4.htm, 15 November 2008). Typical shape of hydraulic fill sample A1, B1, B2 and C2 is shown in Figure 2.3. Hydraulic fills are prepared from raw rocks or new rocks so they are angular and sharp (as shown in Figure 2.3), which increases interlocking of the fill materials. Pettibone and Kealy (1971); Nicholson and Wayment (1964); Rankine (2007); and Sivakugan (2008) made similar observation of grain shape of hydraulic fills.. 100 μm. 100 μm. (a) A1. (b) B1. 500 μm. 100 μm. (c) B2. (d) C2. Figure 2.3 Electronic micrograph of hydraulic fill samples A1, B1, B2 and C2. 14.
(40) Chapter 2. Physical Properties of Hydraulic Fills. Majority of clay minerals or mica present in the mine tailings are lost when excess water is added and fines are removed using hydrocyclones. It leaves hydraulic fills with coarser grains. 2.2.2 Particle size distribution Particle size distribution plays a major role in deciding the soil behavior (Clarke, 1988; Fredlund et al., 2000; and Hinde, 1993).Void ratio and internal friction angle of sands depends on the grading of particle size distribution (Holtz and Gibbs, 1956; and Lambe and Whitman, 1969). Better distribution of particle size (well graded) produces a better interlocking of the soil grains (Lambe and Whitman, 1969) thus lower the permeability. Particle size distribution curves of 15 hydraulic fill samples from Australian Mines are shown in Figure 2.4 (Rankine, 2005). Effective grain size (D10), which is defined as diameter corresponding to 10% finer in the particle size distribution curve, defines the ability of a hydraulic fill to percolate water and settle from slurry (Nicholson and Wayment, 1964; Thomas and Holtham, 1989). For hydraulic fills d10 should be greater than 10 μm. Uniformity coefficient (Cu) and coefficient of gradation (CZ) of hydraulic fill have been calculated using Equations 2.1 and 2.2 and have been reported in Table 2.1.. Cu =. D60 D10. (2.1). Cz =. D302 D60 × D30. (2.2). It can be seen from Figure 2.4 that effective grain size (D10) of hydraulic fills in Australian Mines is more than 10 μm. In previous studies, D10 has been used to compute permeability of hydraulic fills (Sivakugan et al. 2006 and Rankine 2007 ). Kuganathan. 15.
(41) Chapter 2. Physical Properties of Hydraulic Fills. (2002) and Brady and Brown (2002) quoted that typical hydraulic fill D10 values of excess of 10 μm and Herget and De Korompay (1978) suggested that d10 of hydraulic fills is 35 μm. D10 of hydraulic fills measured at James Cook University varies from 19. μm to 40.5 μm as shown in Table 2.1 and Figure 2.4. Uniformity coefficient (Cu) and coefficient of gradation (CZ) shows the packing of grains in the hydraulic fills. Figure 2.2 shows that hydraulic fills are poorly graded. 100 90 80 Percentage passing. 70 60 50 40 30 20 10 0 0.1. 1. 10 100 Particle size (μm). 1000. 10000. Figure 2.4 Particle size distribution curves of 15 hydraulic fills of Australian mines (From Rankine, 2005) 2.2.3 Unified Soil Classification System As discussed in Section 2.2.1, clay and finer particles in mine tailings are removed using hydroclones which leaves coarser particle only. In the Unified Soil Classification System (USCS), the hydraulic fills would be classified as silty sands (SM) or sandy silts (ML). 16.
(42) Chapter 2. Physical Properties of Hydraulic Fills. with no plasticity. 15 hydraulic fill samples from 3 different mines have been classified as per USCS and reported in Table 2.1.. Table 2.1 Geotechnical properties of hydraulic fills Sample*. D10. d30. d60. Cu. CZ. emax. emin. e. (μm) (μm) (μm). Dr. Gs. (%). k. USCS. (mm/hr) symbols. A1. 19.5. 62. 132. 6.8. 1.5. 1.029. 0.417. 0.69. 55.4. 2.80. 19.1. SM. A2. 19. 61. 133. 7.0. 1.5. 0.959. 0.437. 0.67. 55.4. 2.79. 9.1. SM. B1. 12. 56. 132. 11.0 2.0. 1.017. 0.434. 0.63. 66.4. 3.69. 17.8. SM. B2. 19. 37. 71. 3.7. 1.0. 1.04. 0.399. 0.59. 70.2. 3.02. 22.5. ML. B3. 20. 44. 83.5. 4.2. 1.2. 1.048. 0.673. 0.79. 68.8. 4.37. 17.4. ML. B4. 19.5. 58. 130. 6.7. 1.3. 1.091. 0.479. 0.62. 77.0. 3.45. 18.0. SM. C1. 36. 165. 550. 15.3 1.4. 1.166. 0.477. 0.7. 67.6. 3.53. 37.8. SM. C2. 40.5. 160. 475. 11.7 1.3. 0.937. 0.412. 0.66. 52.8. 3.53. 33.1. SM. C3. 26. 62. 260. 10.0 0.6. 0.829. 0.431. 0.58. 62.6. 3.42. 20.7. SM. C4. 38. 150. 315. 8.3. 1.9. 1.559. 0.438. 0.66. 80.2. 3.71. 22.7. SM. C5. 34. 101. 395. 11.6 0.8. 1.021. 0.418. 0.72. 49.9. 3.50. 24.4. SM. C6. 34.5. 120. 440. 12.8 0.9. 1.402. 0.53. 0.7. 80.5. 3.50. 30.3. SM. C7. 29. 91. 365. 12.6 0.8. 1.184. 0.544. 0.68. 78.8. 3.32. 27.8. SM. C8. 32. 89. 425. 13.3 0.6. 0.975. 0.567. 0.72. 62.5. 3.12. 33.2. SM. C9. 40.5. 140. 465. 11.5 1.0. 1.036. 0.534. 0.72. 62.9. 3.42. 28.2. SM. *A, B and C are samples from different mines; each sample was collected at different time and are independent.. 2.2.4 Dry density, relative density and porosity. 17.
(43) Chapter 2. Physical Properties of Hydraulic Fills. Cowling (1998) reported that dry density of hydraulic fills is approximately half of the specific gravity. Rankine (2005) and Rankine et al. (2006) performed series of laboratory tests at James Cook University laboratory to study dry density variation of hydraulic fills with specific gravity. Variation of dry density of hydraulic fills with specific gravity for hydraulic fill samples at James Cook Univeristy, in situ measurements (Pettibone and Kealy, 1971) is shown in Figure 2.5.. Dry density (g/cm3). 2.5 2. 1.5 1. JCU laboratory Pettibone and Kealy, 1971. 0.5 0 0. 0.5. 1. 1.5. 2 2.5 3 Specific gravity (G s ). 3.5. 4. 4.5. Figure 2.5 Dry density versus specific gravity (Adapted from Rankine et al. 2006) Equation 2.3 was proposed by Rankine et al. (2006) and Rankine (2007) to estimate laboratory dry density of hydraulic fills.. ⎛ g ⎞ = 0.56Gs 3 ⎟ ⎝ cm ⎠. ρd ⎜. (2.3). where, ρd is laboratory dry density and Gs is specific gravity of hydraulic fills. Coefficient of determination (R2) of above empirical equation is 0.85, which shows very good correlation between specific gravity and dry density.. 18.
(44) Chapter 2. Physical Properties of Hydraulic Fills. Porosity of hydraulic fills have been reported in the literature by Nicholson and Wayment (1964), Pettibone and Kealy (1971), and Potvin et al. (2005). It has been reported that it varies from 0.3 to 0.5. Rankine et al. (2006) estimated porosity of hydraulic fills using 24 samples at James Cook University Laboratory and reported that it varies from 0.37 to 0.49. Relative density (Dr) of soil is defined as following:. Dr =. emax − e × 100% emax − emin. (2.4). where, emax, emin and e are maximum void ratio, minimum void ratio and void ratio of hydraulic fills respectively. Rankine et al. (2006) observed that relative density of hydraulic fills measured at James Cook University Laboratory varies from 40 – 80%. Nicholson and Wayment (1964), Pettibone and Kealy (1971), and Corson et al. (1981) estimated relative density of mine tailings and reported similar values. Relative density variation of hydraulic fills with void ratio is shown in Figure 2.6. As shown in the Figure 2.6, relative density of hydraulic fills varies from 50% to 80%. Maximum and minimum void ratio of hydraulic fills used in this dissertation is given in Table 2.1. 2.2.5 Specific gravity The mineralogy of the mine tailings is such they have quite high values of specific gravities from 2.80 to 4.50. This is significantly higher than the range of 2.60-2.80 reported for inorganic soils including sands, silts and clays. Specific gravity of hydraulic fills have been measured as per AS 1289 3.5.1 and reported in Table 2.1. Specific gravity plays a major role in behavior of hydraulic fills. Effect of higher specific gravity on permeability and other geotechnical properties have been studied in this dissertation and discussed in Chapter 4.. 19.
(45) Chapter 2. Physical Properties of Hydraulic Fills. 1.8 JCU Data. 1.6. e max. Pettibone and Kealy (1971). 1.4. Lab and in situ relative densities of hydraulic fills. Void ratio. 1.2 1. e min. 0.8 0.6 0.4 0.2 0 0. 10. 20. 30. 40. 50. 60. 70. 80. 90. 100. Relative Density, D r (%). Figure 2.6 Void ratio versus relative density of hydraulic fills (Adapted from Rankine et al. 2006). 2.2.6 Permeability Rankine et al. (2004) and Sivakugan et al. (2006) reported permeability measurements on 25 different hydraulic fills representing four different mines in Australia. All samples were prepared as slurries with water content of 30-35%, similar to those of slurries placed at the mines. All samples were allowed to settle under their self weight in a 153 mm diameter × 306 mm high cylindrical permeameter. Hydraulic fills were poured in a permeameter in form of slurry and allowed to settle with the permeameter. The porosity variation of settled hydraulic fill in the permeameter varied from 36% to 49%. Constant head and falling head permeability tests were carried out on each sample and the average values are plotted against the effective grain size in Figure 2.7. Hazen (1930) suggested. 20.
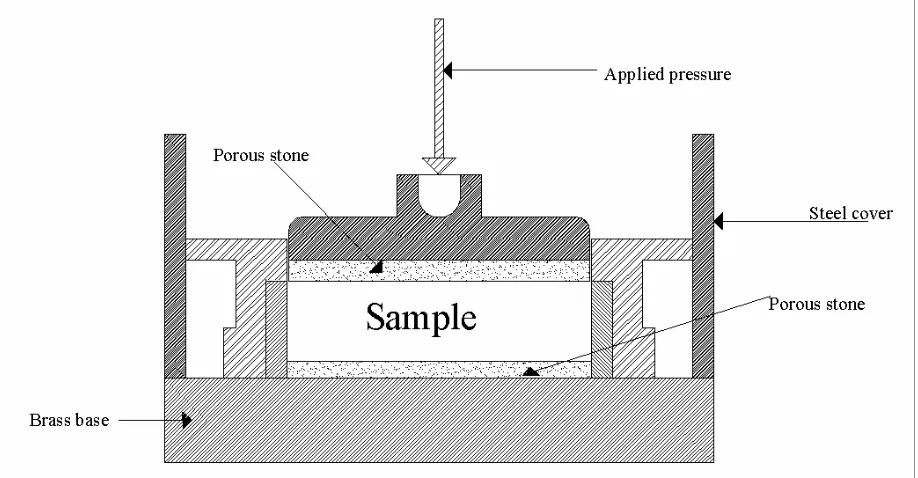
(46) Chapter 2. Physical Properties of Hydraulic Fills. that for clean uniform filler sand, permeability and effective grain size are related by following equation:. k = C D102. (2.5). where, k is permeability of hydraulic fills in mm/hr, C is empirical coefficient and d10 is effective grain size in μm. It can be seen from Figure 2.7 that the C is in range of 0.020.06 for above hydraulic fills. Permeability variation with surcharge, moisture content in a mine stope have been studied and discussed in Chapter 4 for sample A1, B1, B2, C1 and C2.. 100. Permeability (mm/hr). C=0.06 C=0.05 C=0.04 C=0.03 C=0.02. 10. 1. 0.1 5. 10. Effective grain size, D10 (μm). 20. 30. Figure 2.7 Variation of permeability of sedimented hydraulic fills in laboratory with effective grain size. 21. 40.
(47) Chapter 2. Physical Properties of Hydraulic Fills. 2.2.7 Consolidation and settlement When hydraulic fill is placed in the underground voids in the form of slurry, the settlement takes place solely under its self weight. Consolidation is the volume change in any saturated and unsaturated soil under a constant load with time due to change in pore water pressure. Very small consolidation settlement occurs in sand to silt sized soils, such as hydraulic fills (Carrier et al., 1983). Thomas et al. (1979) and Clarke (1988) reported that consolidation of hydraulic fills is complete within seconds and no further change occurs with subsequent drainage. Wickland and Wilson (2005) performed self weight consolidation tests on mine tailing and rock mixture in a column of approximately 1 m diameter and 6 m height for disposal of mine wastes. Wickland and Wilson (2005) observed that the majority of settlement of mixture column occurs during dissipation of pore water pressure with additional volume change and shrinkage occurring under negative pore water pressure. Total settlement in each column was less than 5% after 100 days. Stone et al. (1994) used centrifuge modeling technique to replicate the staged filling of the tailings impoundment to assess both the short and long time consolidation behavior of tailings from Boddinston Gold Mine in Western Australia and measured the long term variation of pore pressure within the different layers of tailing during self weight consolidation. Qiu and Sego (2001) performed consolidation test in a large-strain consolidation cell on copper, coal and gold mine tailings in Canada for load increment of 0.5-100 kPa. Coefficient of consolidation and coefficient of volume compressibility were calculated for these samples by Qiu and Sego (2001). It has been reported that the coefficient of consolidation of tailings varies from 0.310 m2/yr to 104.23 m2/yr. 2.2.8 Cohesion and friction angle Friction angle of hydraulic fills is very important in analyzing static and dynamic stability of mine stopes (Mitchell et al. 1975). Pirapakaran (2008) performed Direct Shear test on 12 hydraulic fill samples from three different mines (A, B and C) to determine peak. 22.
(48) Chapter 2. Physical Properties of Hydraulic Fills. friction angle as per AS 1289.6.2.2. Friction angle of 12 hydraulic fill samples at different packing has been shown in Table 2.2. Friction angle of hydraulic fills varies from 27.60 to 43.60. Bloss (1992), Pettibone and Kealy (1971), and Nicholson and Wayment (1964) reported that friction angle of hydraulic fills varies from 300 to 470, which is same as laboratory test results at James Cook University Laboratory. Variations of friction angle with relative density of hydraulic fills have been studied. Hydraulic fills from Australian mines falls in a narrow band as shown in Figure 2.8. Pirapakaran (2008) plotted friction angle variation with relative density for hydraulic fills samples A1, B1 and C1. Pirapakaran (2008) computed internal friction angle using empirical equations proposed by Kulhawy and Mayne (1990), Skempton (1986), and Meyerhof (1957) and proposed a linear correlation between friction angle and relative density as following equations:. Kulhawy and Mayne (1990). φ ( degree ) = 0.20 Dr + 23.5. (2.6). Skempton (1986). φ ( degree ) = 0.18Dr + 23.7. (2.7). Meyerhof (1957). φ ( degree ) = 0.13Dr + 24.5. (2.8). Pirapakaran (2008). φ ( degree ) = 0.17 Dr + 26.4. (2.9). It has been observed that friction angle of hydraulic fills is higher than the friction angle of other soils at similar relative density. Angular particles of hydraulic fills increase the interlocking of particles which increases the friction angle. As shown in Figure 2.8, friction angle of hydraulic fills is 3.50 more than the friction angle predicted using the empirical equation proposed by Skempton (1986). Following equation can be used to determine friction angle of hydraulic fills from relative density.. φ (degree) = 0.18Dr + 27.2. (2.10). 23.
(49) Chapter 2. Physical Properties of Hydraulic Fills. Table 2.2 Friction angle (φ) of hydraulic fills in degree (Pirapakaran, 2008). Sample. Very loose. φ. Dr (%). Loose. φ. Medium. Dr (%). φ. Dr (%). Dense. φ. Dr (%). A1. 27.6. 0. 29.2. 24. 31.0. 64. 36.6. 74. B1. 33.1. 0. 33.9. 30. 36.2. 49. 38.7. 69. B2. 29.7. 0. 30.4. 29. 31.0. 46. 33.6. 70. C1. 36.2. 13. 36.2. 30. 38.5. 54. 41.3. 68. C2. 35.5. 0. 35.5. 32. 38.2. 51. 43.6. 75. C3. 30.5. 0. 30.5. 19. 33.4. 61. 36.7. 81. C4. 31.0. 0. 31.0. 34. 36.5. 54. 39.0. 81. C5. 32.0. 0. 32.3. 24. 35.8. 47. 40.2. 67. C6. 32.6. 0. 32.6. 21. 36.7. 54. 37.9. 75. C7. 29.9. 6. 30.0. 27. 34.6. 60. 36.9. 72. C8. 34.4. 5. 35.5. 24. 37.5. 48. 42.9. 82. C9. 33.8. 0. 34.9. 27. 39.8. 56. 41.3. 72. 2.3 Mathematical model to represent particle size distribution. Particle size distribution has been used as basis for estimation of soil water characteristic of soil by many researchers (Gupta and Larsen 1979a, 1979b; Arya and Paris 1981). Several attempts have been made to establish a mathematical model to represent the particle size distribution of soils. Gardner (1956) proposed a two parameter lognormal distribution to represent the particle size distribution of soil. Hagen et al. (1987) developed a computerized iterative procedure using two sieves to establish particle size distribution of soil. Fredlund et al. (2000) presented two mathematical models, namely, unimodal form and bimodal form, to represent the particle size distribution curve. In all these models various curve fitting parameters, such as parameter related to shape and slope of the particle size distribution curve, minimum allowable particle size, etc, have been used. In this dissertation, an attempt has been made to develop a particle size. 24.
(50) Chapter 2. Physical Properties of Hydraulic Fills. distribution for hydraulic fills using median particle size D50 (diameter corresponding to 50% finer).. 45. Author. Friction angle (degree). 40. 35. Pirapakaran (2008) Skempton (1986). 30 Meyerof (1957). Kulhawy and Mayne (1990). 25. 20 0. 10. 20. 30. 40. 50. 60. 70. 80. 90. Relative density (D r ). Figure 2.8 Friction angle versus relative density of hydraulic fills. Rankine et al. (2004), (2007) and Sivakugan et al. (2006) determined the particle size distribution of hydraulic fills in Australian Mines (Figure 2.4). It was reported that the particle size distribution of these hydraulic fills fall within a relatively narrow band as shown in Figure 2.4. An empirical equation, Equation 2.12, has been proposed for the particle size distribution curve of hydraulic fill for further use in the mathematical modeling work discussed herein.. ⎡ ⎛ D ⎞⎤ % Passing = 50 ⎢1 + tanh ⎜ n log ⎟⎥ D50 ⎠ ⎦ ⎝ ⎣. 25. (2.12).
(51) Chapter 2. Physical Properties of Hydraulic Fills. where, D is diameter of tailing and D50 is diameter corresponding to 50% finer (i.e. median particle size) and n is curve fitting parameter. Figure 2.9 shows the particle size distribution curves of five different hydraulic fills which have been estimated using Equation 2.13, with n = 2.5 and the actual curve determined in laboratory for sample A1, B1, B2, C1 and C2. It shows that there is good agreement between laboratory results and particle size curved developed using mathematical model. 100 90 Percentage passing. 80 Laboratory test Numerical model. 70 60 50. B2. 40. A1. C2. B1. 30. C1. 20 10 0 1. 10. 100 Particle size (μm). 1000. 10000. Figure 2.9 Comparison of particle size distribution curve of hydraulic fills measured in laboratory and estimated using Equation 2.12. 2.4 Soil-water characteristic curve. The degree of saturation of hydraulic fills within mine stopes decreases with continuous drainage of water through barricades (as shown in Figure 2.10). The permeability of partially saturated hydraulic fills decreases with reduction in degree of saturation or moisture content. Soil-water characteristic curves (SWCC) are plots of moisture content. 26.
(52) Chapter 2. Physical Properties of Hydraulic Fills. versus matric suction or/and permeability versus matric suction or/and permeability variation with moisture content. SWCC have been used by many researchers to study the behavior of unsaturated soils. Many direct and indirect tests methods has been proposed in the litreature (Brooks and Corey, 1964; Gardner 1958; Fredlund and Xing 1994) to develop soil-water characteristic curve or measure matric suction of unsaturated soils. Arya and Paris (1981) used particle size distribution curve to estimate the matric suction. In this dissertation, filter paper method has been used to measure matric suction of five hydraulic fill samples from three different mines. Matric suction, measured using filter paper method has been compared with matric suction estimated using particle size distribution curve. Permeability of unsaturated hydraulic fills has been estimated using matric suction of hydraulic fills and has been discussed in Chapter 4. Cut off permeability and residual moisture content of hydraulic fills have been reported in Chapter 4.. Fill surface Unsaturated hydraulic fills Water table Saturated hydraulic fills Barricade wall. Figure 2.10 Unsaturation of hydraulic fills in a mine stope. 2.4.1 Review of SWCC. 27.
(53) Chapter 2. Physical Properties of Hydraulic Fills. Soil suction is one of the most important parameters. governing the response of. unsaturated soils. The total soil suction is defined as the free energy of the soil water, which can be measured in terms of the partial vapour pressure of soil water (Richards, 1965). Matric suction (ua-uw), where ua and uw are pore air pressure and pore water pressure respectively, is the change in the suction due to movement of the water in liquid phase. Osmotic suction (π) is the change in suction related to the change in moiture content that arises due to movement of water in vapor phase (Vanapalli et al. 2002). Total suction (ψ ) can be defined as following:. (2.13) Equation 2.14 shows the relation between total suction of soil and relative humidity.. (2.14) where, R is universal gas constant, T is temperature in Kelvin , RH, relative humidity in the soil, is ratio of partial pressure for pore – water vapor and saturation pressure of water vapor over a flat surface of pure water at same temperature, vw 0 is specific volume of water and ωv is molecular mass of water vapor. Most of suction measuring devices and methodologies use the concept of relative humidity. Matric suction is the suction exerted by soil mass that induces water to flow in unsaturated soils. It is the negative pressure that results from the combined effect of adsorption and capillarity due to the soil matrix. Osmotic suction is related to the salt content in pore water. Change in osmostic suction can effect the mechanical behavior of soil. Osmotic suction of the soils remains constant. The change in total suction is essentially equivalent to change in the matric suction (Fredlund and Rahardjo, 1993). There are many direct and indirect methods to measure the soil suction. The soil suction can be determined by measuring the relative humidity in the soil or the vapor pressure of the soil water. Psychrometer is the device that is used for direct measurement of total 28.
(54) Chapter 2. Physical Properties of Hydraulic Fills. suction of soil whereas filter paper is used for indirect measurement of relative humidity in the soil. Different types of psychrometer are used to measure the relative humidity in the soil. Most of these instruments and techniques have limitations with regard to range of measurement whereas filter paper method can be used to measure over wide range of values. In this study, filter paper method has been used to measure matric suction of hydraulic fills. 2.4.2 Laboratory tests to develop SWCC using Filter Paper Method Filter paper method was evolved in Europe in 1920s. It is used as sensor to measure relative humidity in the soil. Gardner (1937) established the calibration curve for filter paper method. Different types of filter papers were used to measure the suction of soil. Houston et al. (1994) developed two different calibration curves for total suction and matric suction. Saturated salt solutions (NaCl) were used to calibrate the filter paper for total suction. Tensiometer and pressure membranes were used to calibrate matric suction of soil. The contact (filter paper is placed in contact with soil) and noncontact filter paper methods are used to measure matric and total suction of soil respectively. Filter paper 1 in Figure 2.11 is in contact will soil and filter paper is 2 is separated by a plastic tube. Filter papers 1 and 2 are used to measure matric and total suction respectively. In contact filter paper method, the soil – water and water transferred to the filter paper are identical so there will be no osmotic suction. In noncontact method, the water transferred to the filter paper by evaporation, is the distilled water. Water movement in vapor phase will generate osmotic suction in the soil. Suction measured using filter paper will give total suction. In this dissertation, matric suction of hydraulic fills has been measured using Whatman No. 42 filter papers and the methodology given in ASTM D 5298-03. Calibration charts for Whatman No. 42 filter paper provided by Hamblin (1981), Chandler and Gutierrez (1986), Fawcett and Collis-George (1967) and Leong et al. (2002) have been used to. 29.
(55) Chapter 2. Physical Properties of Hydraulic Fills. calculate matric suction of hydraulic fills. Calibration curve for Whatman No. 42 filter paper is shown in Figure 2.12 (Fawcett and Collis-George, 1967).. Sealed box. Plastic tube. Filter paper 2 Filter paper 1. Soil. Figure 2.11 Schematic diagram of laboratory setup for measuring matric suction using filter paper method. Whatman No. 42 filter paper was dried in drying oven for 16 hr before starting the tests. Filter paper test was performed as per ASTM D5298 – 03. Three stacked filter papers were placed in contact with hydraulic fill as shown in Figure 2.11 (filter paper 1). The outer filter papers prevent central filter paper from any contamination from hydraulic fill. Central filter paper is used to measure matric suction of hydraulic fills. Sample was sealed in a plastic container using plastic bag and electrical tape. Sealed container was placed in a temperature controlled room for 7 days. After 7 days moisture content of central filter paper was measured using a high precision balance with 0.0001 g of accuracy. Measured moisture content of filter paper has been used to compute matric suction of hydraulic fill using calibration curve shown in Figure 2.12.. Matric suction. variation of the hydraulic fills with moisture content is shown in Figure 2.13.. 30.
(56) Chapter 2. Physical Properties of Hydraulic Fills. 1000000. Suction (kPa). 100000. Log suction (kPa) = 5.327 - 0.0779 w f. 10000 Log suction (kPa) = 2.412 - 0.0135 w f. 1000 100 10 1 0. 10. 20. 30. 40. 50. 60. 70. 80. 90. 100. Filter paper water content, w f (%). Figure 2.12 Calibration curve for estimating suction using filter paper Whatman No. 42 (Fawcett and Collis-George 1967). 2.4.3 Test result Moisture content of filter papers (wf) is measured after 7 days (ASTM D D5298 – 03). It has been assumed that filter papers come in equilibrium within 7 days with moisture content. Hydraulic fills samples of initial moisture content of 2 to 30% have been prepared to study the suction variation with moisture content. As soil approaches towards saturation (S →1) pore water pressure (uw) approaches pore air pressure (ua) and the matric suction goes towards zero (ua - uw→0) (Fredlund and Rahardjo, 1993). Figure 2.13 has been used to estimate saturation moisture content (ws) of hydraulic fills. It has been observed that saturation moisture content varies from 22 – 27 % for hydraulic fills.. 31.
(57) Chapter 2. 30. Moistrure content (%). 25. Physical Properties of Hydraulic Fills. C1 B2 C2. 20. B1. A1. 15 10 5 0 0.01. Saturation moisture content. 0.1. 1. 10 100 Matric Suction (kPa). 1000. 10000. Figure 2.13 Matric suction of hydraulic fills samples measured using Filter Paper method. 2.4.4 Development of SWCC using particle size distribution curve Matric suction of hydraulic fills has been calculated using particle size distribution of hydraulic fills using method proposed by Arya and Paris (1981). Equation 2.7 has been used to predict the particle size distribution of hydraulic fills. Methodology of estimating matric suction using particle size distribution is discussed in Appendix A1. The variation of matric suction with degree of saturation has been plotted in Figure 2.14. Results of the matric suction calculated using particle size distribution has been compared with matric suction measured using filter paper method for samples B1 and B2 (Figure 2.14). Results of other samples are shown in Appendix A2.1. It has been observed that there is good agreement between matric suction measured using filter paper method and computed using numerical method. It suggests that the particle size distribution curve can be used to estimate properties of unsaturated hydraulic fills.. 32.
Figure
+7
Related documents
The kitchen, the dining room, the hall and even the downstairs bedroom all have French doors that open onto a large patio terrace and then the rest of the garden is laid to lawn..
de Klerk, South Africa’s last leader under the apartheid regime, Mandela found a negotiation partner who shared his vision of a peaceful transition and showed the courage to
The current research describes the adaptation of an informant-rating instrument (the Extreme Demand Avoid- ance Questionnaire; O’Nions et al. 2014b ; EDA-Q) for use as a
The testimony of the State Department employee was brought to public hearings in hope that he turned out to be a communist, showing that even in a case potentially dealing
This model posits four types of health beliefs that affect an individual’s health behavior, in this case, the decision to seek mental health services: perceived
The aim of this paper was to explore the effects on the French forest sector of three policies to mitigate climate change: a fuelwood consumption subsidy (substitution), a payment
This Service Level Agreement (SLA or Agreement) document describes the general scope and nature of the services the Company will provide in relation to the System Software (RMS
Note: if you want to burn your current movie production to a disc right away, go directly to the Create Disc module. In the Create Disc module you can create a disc menu, produce
