University of Southern of Southern Queensland
Faculty of Engineering and Surveying
Griffin Road Drainage Diversion – Feasibility Study
A dissertation submitted by
Mr Bruce Burton
In fulfilment of the requirements of
Bachelor of Engineering (Civil)
ABSTRACT
This dissertation assesses the feasibility of a proposal to redivert a portion of flood waters from the Griffin Road Catchment, back to the traditional Spring Creek catchment, to relieve flooding of the Kennedy Highway and residences in Tolga, Far North Queensland.
The traditional Spring Creek catchment is currently severed by Griffin Road. The flows to the South of Griffin Road, instead of crossing at this point, are diverted along Griffin Road towards Tolga.
It is proposed to utilise an existing drain half way up Griffin Road, which is currently disused to divert a portion of the traditional flows, currently severed, to the North back into Spring Creek, hence reducing the flows into Tolga.
The existing drain will require earthworks to the upstream end to ensure drainage capacity to a Q100 level, along with a detention basin constructed on Spring Creek to limit peak flows to their current level, hence reducing the risk of flooding or erosion downstream.
Prior to flows being diverted an isolated area of erosion would need to be stabilised.
The proposal was conveyed to residents living adjacent to the proposed flow path to assess their response. Nearly all residents strong agreed with the proposal, with no objections raised.
Finally the proposal was costed to $353,500.00; with support of Government funding or grants the proposal would be possible
University of Southern of Southern Queensland
Faculty of Engineering and Surveying
ENG4111 & ENG4112 Research Project
Limitations of Use
The Council of the University of Southern Queensland, its Faculty of Engineering and Surveying, and the staff of the University of Southern Queensland, do not accept any responsibility for the truth, accuracy or completeness of material contained within or associated with this dissertation.
Persons using all or any part of this material do so at their own risk, and not at the risk of the Council of the University of Southern Queensland, its Faculty of Engineering and Surveying or the staff of the University of Southern Queensland.
This dissertation reports an educational exercise and has no purpose or validity beyond this exercise. The sole purpose of the course pair entitled “Research Project” is to contribute to the overall education within the student’s chosen degree program. This document, the associated hardware, software, drawings, and other material set out in the associated appendices should not be used for any other purpose: if they are so used, it is entirely at the risk of the user.
Prof Frank Bullen Dean
CERTIFICATION
I certify that the ideas, designs and experimental work, results, analyses and conclusions set out in this dissertation are entirely my own effort, except where otherwise indicated and acknowledged.
I further certify that the work is original and has not been previously submitted for assessment in any other course or institution, except where specifically stated.
Bruce Neville Burton
Student Number: Q11217024
__________________________________ Signature __________________________________
ACKNOWLEDGEMENTS
This research was carried out under the principal supervision of Dr Ian Brodie (USQ) and Joe Rhodes (TRC). Thank you for your valued guidance and support.
I would like to thank my partner and family who have stood by me and provided continual encouragement along this journey.
Appreciation is also due to the Engineering staff of the former Atherton Shire Council, in particular Mr Ray Kirkman, Mr Dave Lane and Mr Neville Drews for their tireless support and patience with my studies.
TABLE OF CONTENTS
Contents Page
ABSTRACT 2
DISCLAIMER 3
CERTIFICATION 4
ACKNOWLEDGEMENTS 5
LIST OF FIGURES 7
LIST OF TABLES 8
LIST OF CHARTS 9
LIST OF APPENDICES 10
ABBREVIATIONS 11
CHAPTER 1 – INTRODUCTION 13
1.1Outline of the study 13
1.2Introduction 13
1.3Site background 15
1.4Research objectives 17
1.5The problem 18
1.6Proposal 23
CHAPTER 2 – LITERATURE REVIEW 24
2.1 Introduction 24
2.2 Standards and guidelines used 24
CHAPTER 3 – RESEARCH DESIGN, METHODOLOGY, RESULTS &
DISCUSSION 28
3.1 Introduction 28
3.2 Peak flows 29
3.3 Diversion channel sizing 32 3.2.1 Diversion channel analysis 35 3.4 Detention pond capacity 38
3.6 Questionnaire 48
3.6.1 Methodology 48
3.6.2 Results 49
3.7 Costing estimate 52
3.8 Revegetation 57
3.9 Easement 59
CHAPTER 4 – FURTHER RESEARCH 60
CHAPTER 5 – CONCLUSION 61
REFERENCES 62
LIST OF FIGURES
Number Title Page
1.2.1 New detention pond location and flooding site 14
1.3.1 Locality plan Tolga 15
1.3.2 Site plan 16
1.5.1 Flooding of Kennedy Hwy 18
1.5.2 Detailed site plan 19
1.5.3 Culvert under Kennedy Hwy 20
1.5.4 Catchment boundaries 21
1.5.5 Contour banks 22
1.6.1 Proposed diversion drain 23
3.3.1.1 Existing earth channel 32
3.3.1.2 Far end of diversion drain 33
3.3.1.3 Existing storage pond 34
3.4.1 Detention pond layout 38
3.4.2 Detention pond site upstream of Tate Rd 41
3.5.1 Existing erosion location 42
3.5.2 Property access culvert 43
3.5.3 Backfill of creek 44
3.5.4 Backfill section currently 44
3.5.5 Top erosion hole and rock deposited by land holder 45
3.5.6 Drop structure site 46
3.5.7 Erosion hole propagating upstream and site for drop structure 47
3.6.1.1 Questionnaire study area 49
3.7.1 Culvert site 56
LIST OF TABLES
Number Title Page
3.2.1 Frequency factors 30
3.2.2 Peak flow comparison Spring Ck outlet 31
3.3.1.1 Peak flows diversion drain required to cater for 35
3.3.1.2 Existing channel dimensions 37
3.4.1 Comparison existing discharge and pond discharge 39
3.4.2 ARI event pond height and volume 40
LIST OFCHARTS
Number Title Page
1 Concerns with proposal 50
2 Support for proposal 50
LIST OF APPENDICES
Number Title
A Project Specification B Cross sections
C FNQROC IFD Chart 2 - Atherton Questionnaire D Questionnaire
E Questionnaire results F Tree species list G Costing Breakdown H Griffin Road culvert
I Detention pond control structure J Gabion drop structure
K HECRAS plots
NOMENCLATURE AND ACRONYMS
The following abbreviations have been used throughout the text and bibliography:-
ARI Average Recurrence Interval (yrs) ARR Australian Rainfall & Runoff b Channel base width
C Coefficient of discharge
Cy Coefficient of discharge for ARI of “y” years d/s Downstream
fi Fraction impervious
FNQROC Far North Queensland Region Of Councils Fy Frequency factor
h Depth of water ha Hectares
I Average rainfall intensity (mm/hr)
Iy Average rainfall intensity for ARI of “y” years
L Stream flow length
Leff Effective length of drainage path
n Manning’s roughness coefficient N Design ARI for minor system (years) P Wetted perimeter
QUDM “Queensland Urban Drainage Manual” (DNR&W 2007) Q Flow rate (m3/s or L/s)
Qy Peak discharge rate for ARI of “y” years
R Hydraulic radius = A/P S Channel slope
t Time
tc Time of concentration or travel time from extremity of pervious area U Fraction of catchment urbanised
u/s Upstream V Velocity (m/s) V Runoff volume (m3)
CHAPTER 1
INTRODUCTION
Water and fire, good slaves but poor masters. – Unknown
1.1 Outline of the study
The purpose of this study is to assess the feasibility of a proposal to alleviate a flooding issue in the small rural town of Tolga, by rediverting a portion of flows back to the traditional catchment via an existing disused earth channel.
This study encompasses:
• A hydrologic analysis to determine the flows to be diverted,
• HECRAS modelling of the existing drain to ensure drainage capacity, • Detention pond sizing and analysis to limit peak flows in receiving waters to
existing levels,
• Stabilisation of an existing erosion issue downstream in receiving waters, • Feedback from adjacent residents via a questionnaire, and
• Costing estimate of the proposal.
1.2 Introduction
Following a series of flooding events in Tolga, Far North Queensland, most recently in January 2009; solutions are sought to reduce the likelihood of flooding over the Kennedy Highway and into adjacent residences.
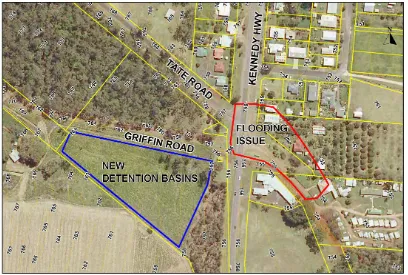
In recent months the Tablelands Regional Council has installed a series of three detention ponds aimed at dealing with the drainage problem, being the flows at the bottom (Eastern) end of Griffin Road, just prior to the Highway. Refer figure 1.2.1. The proposal assessed in this study however, will aim to address the cause of the flooding further upstream; hence alleviating a portion of the flows to be managed by these detention ponds, enabling them to cater for larger ARI events.
1.3 Site Background
[image:15.595.103.490.154.416.2]Tolga is located on the Atherton Tablelands approximately 100km via road, South-West of Cairns in Far North Queensland, Australia. Refer figure 1.3.1.
Figure 1.3.1 Locality Plan of Tolga.
Being a small agricultural town with a residential area of only 1.1km2 it is bordered by farmland. Many of the residential areas are situated directly adjacent to farmland which often results in issues between the two land uses, in this instance the issue is drainage.
Figure 1.3.2: Site plan
1.4 Research Objectives
The aim of this research was to determine the feasibility of the proposal, which would relieve flooding issues and reverse drainage errors previously made in the catchment through:
• Determination of peak flow rates and runoff volumes and the ability for these
to be managed along the proposed flow path,
1.5 The Problem
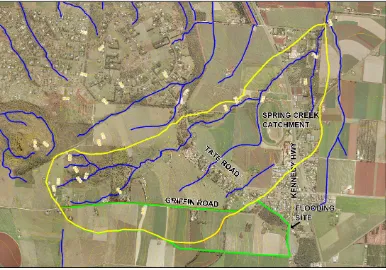
Floodwaters from outlying rural farmlands flow East towards the urban area of Tolga; following the road formation of Griffin Road. Refer figure 3.
These flows cross the Kennedy Highway between the intersection with Tate Road and the intersection with the old Griffin Road formation (which is now parkland); approximately a 40 metre span of flows. The depth of recent events over the Highway has been upward of 150mm, which deposits debris such as rocks and branches on the Highway.
[image:18.595.88.461.347.624.2]After crossing the Highway these flows flood and deposit silt in adjacent residences. As this has been close to an annual occurrence in recent times, public condemnation is rapidly growing.
Figure 1.5.1 Flooding of Kennedy Highway
in figure 1.5.1. Note the Motel is also shown far right in this photo. Due to the size of the mound, this poses a future problem, in the event of large flows, stormwater would be directed directly towards the Atherton Tablelands Motor Inn. Refer figure1.5.2.
Figure 1.5.3 Culverts under Kennedy Hwy
The floodwaters result from two main causes:
Figure 1.5.4 Catchment Boundaries
Figure 1.5.5 Contour banks
1.6 Proposal
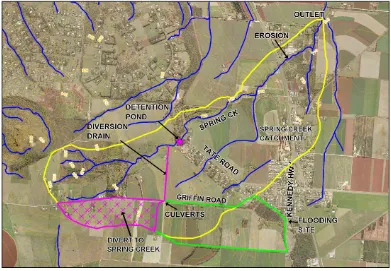
The theoretical proposal created in conjunction with the author and staff of the Tablelands Regional Council comprises the following (Refer figure 1.6.1):
• Diversion banks and culverts at Griffin Road would be utilised to divert flows
from a portion of land currently severed by Griffin Road, into an existing drain, back to its traditional Spring Ck catchment. Rediverting these flows back to Spring Creek will help alleviate flooding of the Kennedy Highway in Tolga. into the existing drain.
• The existing disused earth drain extends between Griffin Road and Spring
Creek, would be designed to cater for flows up to a Q100 level.
• At the end of the existing diversion drain, flows would be allowed to sheet
flow into Spring Creek where they would be detained by one detention pond.
• The detention pond would contain the flows, releasing at existing peak flow
levels. Preventing flooding and erosion potential downstream.
[image:23.595.140.531.448.719.2]CHAPTER 2
LITERATURE REVIEW
2.1
Introduction
As this dissertation is mainly design based, this literature review will aim to identify standards and guidelines to be used for this study.
2.2
Standards and Guidelines Identified
The main standard which this study was based on is the Queensland Urban Drainage Manual (QUDM) (DNR&W 2007) this outlines the standards required for drainage works in Queensland. QUDM (DNR&W 2007) refers back to the Australian Rainfall and Runoff (AR&R) (Engineers Australia 2001) manual for details of hydraulics calculation procedures. The Far North Queensland Region of Councils Development Manual (FNQROC 2009) gives specific standards for the Far North Queensland region. The FNQROC development manual (FNQROC 2009) is based around QUDM (DNR&W 2007) and hence refers back to QUDM (DNR&W 2007) for many procedures.
2.2.1 Culvert Design
• QUDM Section 7.08.4 specifies the minimum cover over RCBC to be 400mm.
• QUDM Section 7.11 table 7.11.1 identifies acceptable flow velocities for
RCBC.
• QUDM Section 7.16.7 specifies Mannings Equation is to be used for pipes
flowing full and relevant Mannings n.
2.2.2 Diversion Drain Design
• QUDM Section 8.06 table 8.06.1 states a healthy coverage of fibrous-rooted
herb layer plants such as lomandra enable bank scour velocities to 3m/s.
• QUDM Section 9.03.5 stipulates the use of the Mannings equation for the
analysis of channels, however the use of HECRAS will eliminate the need for these hand calculations and provide a better insight to the flow profile, showing backwater conditions.
• QUDM Section 9.05 table 8.05.2 suggests maximum bank gradients. For
sandy-loam soils 1:3 is relevant.
• QUDM Section 9.05 table 9.05.3 stipulates the maximum permissible
velocities for earth channels. In this instance for a 6% grade with 100% cover, 2.1m/s is relevant.
• QUDM Section 4.03.1 introduces the rational method for determination of
peak flows and warns of the inaccuracies of its use in certain circumstances.
• The procedure to develop the Intensity-Frequency-Duration (IFD) charts
required under QUDM (DNR&W 2007) is outlined in AR&R (Engineers Australia 2001). However, FNQROC Development Manual (FNQROC 2009) provides IFD charts for the Atherton area which are relevant for the study area and will be used for this study.
• Tables of Mannings Roughness Coefficients are given in many texts and
• The QUDM (DNR&W 2007) and AR&R (Engineers Australia 2001) identify
many hydrological modelling methods available. Considering this is a feasibility study for a preliminary concept, the simple Rational Method is sufficient for the purpose of this study. It should be noted that the Rational Method is not particularly accurate in some cases and the second edition of QUDM (DNR&W 2007) makes clear cases when this method should not be used. In particular QUDM (DNR&W 2007) Section 4.01 states that the Rational Method is generally not suitable for the design of detention basins. This issue will be addressed under the topic of detention pond capacity. AR&R (Engineers Australia 2001) gives modified versions of the Rational Method for specific areas, however no area specific methods are available for North Queensland. One potential method identified was the Weeks Method, however this is only relevant for catchments 40-250km2, considering this catchment is less than 40km2 this method could not be used .
2.2.3 Detention Pond Design
• QUDM provides two options for detention pond sizing, Section 5.05.1
provides initial sizing options with four formulae, after Culp, Boyd, Carroll, and Basha, however for flood routing through the pond a more sophisticated approach is required. Section 5.05.2 provides a manual method formula for the final sizing of detention ponds.
• The Road Drainage Design Manual (Dept Main Roads 2002) section 4.7.1.6
provides a simple hydraulic method of routing, using a similar approach as QUDM (DNR&W 2007) Due to the excellent example provided by the Road Drainage Design Manual (Dept Main Roads 2002) this method will be adopted.
2.2.4 Erosion Stabilisation
• QUDM Section 8.06 advises that the control of bed scour may be achieved by
• Brisbane City’s Natural Channel Design Guideline provides info on vegetated
channels which will assist with the design of the stabilisation of the eroded section.
• The Road Drainage Design Manual (Dept Main Roads 2002) appendix 5A
provides information on erosion controls such as, grass and turf, reinforced grass, geotextile lining, erosion control mat, rock lining, rock mattress, check dams, erosion control blankets and mulching.
CHAPTER 3
RESEARCH DESIGN, METHODOLOGY, RESULTS &
DISCUSSION
3.1 INTRODUCTION
The traditional, current and proposed catchments were analysed to gauge if the additional flows could be catered for, if diverted from the Griffin Road catchment back to the traditional Spring Creek catchment. The areas of these three catchments are for the outlet point shown in figure 1.6.1, are as follows:
• Traditional Catchment – 558 ha
• Current Catchment – 470 ha (Area South of Griffin Rd excluded)
• Proposed Catchment – 517 ha (Area North of Griffin Rd plus diversion area)
3.2
PEAK FLOWS
The peak flows of the traditional, current and proposed catchments for ARI of 1, 2, 5, 10, 20, 50 and 100 years were calculated using the Rational Method as shown in QUDM (DNR&W 2007) Sect 4.03.1.
Qy = (2.78 x 10⁻³) Cy.tcIy.A
Where:
• Qy = peak flow rate (m3/s) for ARI of ‘y’ yrs
• Cy = Coefficient of Discharge (dimensionless) for ARI of ‘y’ yrs
• tcIy = Average rainfall intensity (mm/hr) for a design duration of ‘t’ hrs and
ARI of ‘y’ yrs
• A = Area of catchment (ha)
• tc = Time of concentration (from Bransby-Williams Eqn)
The Coefficient of Discharge being a combination of losses, was calculated in the following steps as outlined in QUDM (DNR&W 2007) Section 4.05:
Step 1 Determine fraction impervious fi, which in this case will be considered to
be zero. The impervious road area is being ignored.
Step 2 Determine the 1 hour rainfall intensity 1I10 for the 10 year ARI. From the
IFD table supplied by the FNQROC Development Manual (FNQROC 2009), 1I10 = 63.94 mm/hr.
Table 3.2.1: Frequency factors(QUDM (DNR&W 2007) Table 4.05.2)
ARI (years) Frequency Factor (Fy)
1 0.80
2 0.85
5 0.95
10 1.00
20 1.05
50 1.15
100 1.2
Step 4 Determine the 10 year C value. From QUDM (DNR&W 2007) table 4.05.3b,
for 1I10 = 63.94 mm/hr gives C10 = 0.59 (Refer Appendix C – IFD Chart)
Step 5 Determine Coefficient of Runoff Cy for the design storm by multiplying C10
value by the Frequency Factor Fy.
Cy = Fy . C10
The Time of Concentration (tc) was calculated using the Bransby-Williams’ equation.
This is the preferred method due to its ease of use. QUDM (DNR&W 2007) Section 4.06.11
defines Bransby-Williams’ equation as follows:
tc = 58L/(A0.1.Se0.2)
where:
tc Time of concentration (min)
L Length (km) of flow path from catchment divide to outlet A Catchment area (ha)
Se Equal area slope of stream flow path (%). Calculated as the slope of a line of best fit superimposed on a long section of the drainage path.
Table 3.2.2 Peak flow comparison – Spring Ck Outlet
PEAK FLOW (m3/s)
TRADITIONALCURRENTPROPOSED% INC ON CURRENT
% OF
TRADITIONAL
Q1 19.0 16.0 17.6 10.03 92.78
Q2 25.4 21.4 23.6 10.03 92.78
Q5 34.4 29.0 31.9 10.03 92.78
Q10 39.7 33.5 36.8 10.03 92.78
Q20 46.8 39.5 43.5 10.03 92.78
Q50 58.6 49.4 54.3 10.03 92.78
3.3.1 DIVERSION CHANNEL
[image:32.595.89.514.327.647.2]The existing drain was constructed by the army during WWII to divert flows away from the camp. It is of cut and fill construction and has many large rocks on the fill bank. It is proposed to maintain the existing channel and increase the capacity only where needed as existing channel is well vegetated, showing no signs of erosion remaining from previous use. Additional vegetation planting could be included in the future if erosion became a problem or if there was a desire to create an ecological link.. The grass cover will increase the roughness of the channel and help prevent scouring. Figure 3.3.1.1 was taken from the upstream end of the existing drain looking towards Spring Creek where the tree line is shown.
The figure 3.3.1.2 shows the far end of the existing channel where the land begins to fall away quickly to the creek. The power pole on the right hand side is situated in the creek. The flows are proposed to spread from a concentrated flow in the channel to overland flow down the steep section to the creek. The overland flow section will be between the house and the reservoir shown. This will require revegetation to prevent scouring of this steep section.
At the end of the diversion drain is a concrete lined water storage pond which was made by the army. This holds 0.6 Megalitres and is proposed to be used as a small sedimentation pond for low flows, which would enable this to be used as a water point for the landholders cattle. Figure 3.3.1.3 shows this storage pond.
3.3.1 DIVERSION CHANNEL ANALYSIS
The HEC-RAS 4.0 modelling program was used to analyse the existing earth channel which is proposed to be used as a diversion drain. HEC-RAS (Hydraulic Engineering Centres River Analysis System) was developed by the US Army Corps of Engineers for their exclusive use, however in recent times the program has been made available to the public. The program is freely downloadable online at:
http://www.hec.usace.army.mil/software/hec-ras/
Seven cross sections of the existing drain were taken and entered into the HECRAS program. The downstream end was given the chainage 00 and its base was given an arbitrary level of 0m. This data was entered into HECRAS and peak flows from the proposed diversion area were modelled.
[image:35.595.82.534.447.619.2]The rational method presented in section 3.2 was utilised to determine the peak flows to be diverted. The discharges calculated are presented in table 3.3.1.1.
Table 3.3.1.1 Peak Flows Diversion Drain Required to Cater For
ARI Event Discharge (m3/s)
1 2.8
2 3.8
5 5.2
10 6.1
20 7.3
50 9.2
100 10.6
clay-flows to be contained within channel. In addition to this minor fill was added to the levee bank at most of the remaining cross sections to ensure 300mm freeboard.
A mannings n value of 0.05 was used for the analysis. For excavated earth drains this value is high, however due to the presence of many large rocks along the drain particularly on the levee bank, along with changing cross sections, and planting of lomandras, 0.05 is considered suitable. It is proposed that the drain be planted with high velocity species such as lomandras on the base and bottle brush on the sides, to increase the roughness and protect from scour. The existing grass cover is quite thick, providing additional roughness.
Initially it was aimed to design the diversion drain to a natural creek style. However it was soon realised that due to a limited easement width of 14 metres, with which to locate a large channel and large levee capable of containing the flows, there was limited scope to design meandering alignments with pools etc. It is proposed that planting high velocity species along the length of the drain will assist towards the desire for a natural creek style channel.
The channel designed to levels as such to keep velocities under the maximum permissible velocity value (non-scour velocity). QUDM (DNR&W 2007) specifies for 6% grade with 100% grass cover in erosion resistant soils a maximum velocity of 2.1m/s. The channel designed remains under this value, except at some the downstream end of the channel during Q50 and Q100 events. Due to the rarity of these events, this is considered acceptable.
Table 3.3.1.2 Existing Channel Dimensions
Chainage Width Depth Area
0 10.4 1.0 7.26
105 11.3 1.0 7.63
195 13.0 1.0 8.73
310 13.0 1.1 8.5
410 10.3 0.9 5.83
475 5.8 0.3 0.98
545 4.0 0.1 0.15
The area of catchment above the diversion drain but below the last contour bank would need to be added to the flows in the diversion drain, however as this catchment is very small and adds to the diversion drain at the far end where the existing capacity is greatest and exceeds the requirement for the diverted flow. This small additional flow can be considered negligible and no further analysis is required.
3.4 DETENTION POND CAPACITY
[image:38.595.103.492.236.504.2]The detention pond is proposed to be located in Spring Creek, upstream of Tate Road. Refer figure 3.4.1. At this location the road reserve is 200 metres wide due to this traditionally being a stock route. It is possible to fit many different arrangements of detention ponds within this area, one option selected for this study is a singular pond with a four metre high wall at the deepest point.
Figure 3.4.1 Detention Pond Layout (1m contour intervals)
RL’s 789-792 would be excavated by one metre to ensure capacity is obtained. This requires the excavation of 12285m3 of soil. 5271m3 of this spoil will be used in the construction of the earth wall.
The earth wall will be 4m high at its deepest point with 1 in 2 batters and 3 metre top of wall width.
An excel program was written using the method presented by the Road Drainage Design Manual (Dept Main Roads 2002); section 4.7.16, which utilises the following formula:
In,(n+1) + (Sn-Ont/2) = (Sn+1 + On+1t/2)
Where:
In,(n+1) = inflow volume, in cubic metres, between points (n) at start of time interval (t),
and (n+1) at end of time interval (t) on the time axis. On = Outflow discharge at point (n)
Sn = Storage at point (n)
[image:39.595.86.533.522.696.2]Many weir heights and orifice combinations were trialled with the optimum option being a 2.5m high weir with 1.5 x 0.7m orifice at the weir wall, starting at RL 788. This arrangement enables outflows to be limited to the existing peak flows to reduce the likelihood of flooding and erosion downstream. The outflows obtained with this weir and orifice arrangement are presented in table 3.4.1. Note all discharges are less than the existing discharges, except for ARI 1, however this is a low flow, this will be considered acceptable. Refer Appendix I for Control Structure diagram.
Table 3.4.1 Comparison Existing Discharge and Pond Discharge
ARI Event Existing Discharge Pond Discharge
1 6.8 7.4
2 9.2 9.1
5 12.7 11.6
10 14.8 13
20 17.6 14.3
50 22.2 19
Table 3.4.2 ARI Event Pond Height and Volume
ARI Event Max Water Level
in Pond (m) AHD Pond Volume (m3)
1 788.89 2972.6
2 789.15 4294
5 789.63 7346.8
10 789.95 9382
20 790.29 12614.5
50 790.74 17137
100 790.93 19046.5
The Road Drainage Design Manual (Dept Main Road 2002) section 4.7.1.7 specifies a minimum freeboard of 750mm for fill embankments, above the emergency spillway crest level. As this pond does not have an emergency spillway, it was chosen to ensure the top of the wall was at an RL of 792m, a freeboard of 1.07m above the Q100 high water mark. Due to the large volume of excess spoil available this freeboard could be raised further. Using this freeboard, at RL 792m the pond has a total storage volume of 32950m3, which is 13903.5m3 in excess of the Q100 volume of 19046.5m3
3.5 EROSION
There currently exists an erosion problem situated downstream of the Highway close to the outlet of the catchment. A 200 metre long deep central scour had developed over time. This erosion is spreading upstream at a rapid pace, the approximately two metre deep scour is moving up stream at a rate of one metre per year. Figure 3.5.1 shows the locality of this erosion.
Figure 3.5.1 Existing Erosion Locality
Figure 3.5.2 Property Access Culvert
The second issue identified is high velocities impacting this section of creek as a result of a 260 metre long adjacent upstream section which had been levelled and mowed as lawn. The low roughness values on 4% slopes cause flows to gain speed, which then drop into the deep narrow channel, resulting in turbulence. This aids further propagation of the bed erosion upstream. It was also noted by an adjacent resident that a race horse was swept downstream during the last storm event, from the mowed lawn section and was killed as a result. This gives an indication of the force of these flows.
Figure 3.5.3 Backfill of Creek
Figure 3.5.4 Backfill Section Currently
The bed scour is causing the banks to be slowly undercut and widen. Residents property is close to being damaged by this widening. It was noted that a pump shed is now only 500m away from the top of this erosion and an adjacent avocado crop is being threatened.
Whilst undertaking the resident questionnaire it was noted that downstream of this erosion site there is no further erosion.
The top erosion hole is eating into the lawn area, after each wet season the owner has to construct a new fence further upstream to prevent his horses from falling into the hole. It was advised that following the last wet season the erosion propagated 1 metre further upstream into the lawn area. The upstream resident concerned about the loss of land has deposited large rock to prevent the spread.
[image:45.595.90.403.503.740.2]Figure 3.5.6 Drop Structure Sites
To stabilise the creek system at this location, preventing the bed scour erosion from propagating any further. It is proposed to construct gabion drop structures at the head of each of the four erosion holes. Figure 3.5.6 shows these sites, marked with stars. Figure 3.5.7 shows one of these erosion holes. Each drop structure shall comprise of 4 – 2x1x1m gabion baskets and 2 – 6x2x0.16m reno mattresses. The gabions forming the drop part of the structure and the reno mattresses forming the creek bed armour. This combination will not only prevent the erosion from propagating but will serve as an energy dissipation device. Refer Appendix J for Drop Structure design.
It is possible since channel roughness has been designed to increase through vegetation; that the velocity will drop causing a backwater effect and hence potential flooding. If this is found to be the case during the detailed design, there is extensive opportunities along Spring Creek between the currently proposed detention basin and the Kennedy Hwy to install additional detention systems. Along this reach, the cross section appears to be far greater than required. These additional detention sites would enable peak flows to be further reduced to more manageable levels. This exercise has not been undertaken as part of this study, though could be investigated as part of further research into the erosion.
3.6 QUESTIONNAIRE
A questionnaire was compiled to identify issues which affected residents in the receiving catchment may have relating to the proposal outlined in this study and gauge public support. Feedback will enable issues to be addressed and suitable solutions to be included in the proposal. Public support will play a key role in determining the feasibility of the proposal. Refer to attachments D and E for the questionnaire used and results of the questionnaire. .
3.6.1 Methodology
The questionnaire was undertaken by visiting each resident with property adjacent to Spring Creek, which proved to be time consuming. On average 1.5 hours were spent at each site, due to residents offering to show their particular section of the gully and specific issues and history. As a large number of residents have lived in the area since childhood, extensive history was available. Refer figure 3.6.1.1 for the questionnaire study area.
Although time consuming, visiting each resident was worthwhile as specific questions in addition to the written questionnaire could be asked relevant to each site. In addition to this proposal could also be adequately explained, preventing the proposal from being misinterpreted and extinguishing fears associated with receiving additional water.
Figure 3.6.1.1 Questionnaire Study Area
3.6.2 RESULTS
Of the fifteen residences identified as being potentially affected by the proposal, feedback was obtained from ten. One resident requested not to undertake the questionnaire and four residents were uncontactable.
From chart 1 it can be seen that three of the ten residences were concerned that the proposal would cause flooding and erosion.
Chart 1 Concerns with proposal
Concerns with Proposal
0 1 2 3 4 5 6 7 8 9 10
Flooding Erosion Sedimentation/Debris Safety Other
Concern N u m b e r o f R e s id e n ts YES CONCERNS NO CONCERNS
Chart 2 shows the support for the proposal. The response clearly shows that if the issues raised by the residents are addressed residents would support the proposal.
Chart 2 Support for proposal
Support for Proposal
0 1 2 3 4 5 6 7 8
Strongly Suport Support Impartial Disapprove Strongly Disapprove
N u m b e r o f R e s id e n ts
Chart 3 Previous stormwater issues
Previous Stormwater Issues
0 1 2 3 4 5 6 7 8 9 10
Flooding Erosion Sedimentation/Debris Other
3.7 COSTING ESTIMATE
[image:52.595.88.509.286.417.2]It is suggested that this project could be funded by Government grants. Breaking the proposal into stages may assist the project completed, as a series of small grants would be easier to secure, rather than attempting to gain one large grant. The local authorities may be able to fund a portion of the stages to link stages funded by grants. The costing of the proposal has been divided into five stages of specific tasks which are to be done in sequence. Refer table 3.7.1. For a detailed breakdown refer to Appendix G. The stages are as follows:
Table 3.7.1 Costing estimate:
STAGE ESTIMATE
Stage 1 – Detention Pond $107,200
Stage 2 – Rehabilitation of Eroded Section $21,100
Stage 3 – Diversion Drain Link $96,200
Stage 4 – Revegetation of Spring Creek $128,000
TOTAL $352,500
Stage 1: Detention Pond: To be constructed first, will provide a buffer to works proposed downstream such as the rehabilitation of the eroded section at the bottom of the catchment.
The pond is situated on Spring Creek and will have existing flows traversing through the pond. An orifice in the weir wall enables these flows to pass through the pond. The existing Q1-100 flows will discharge from the pond under the maximum water level for each respective Q1-100 event. At times when these levels are not reached during the inflow / outflow cycle the discharge from the orifice will be less than the existing flows. This will benefit the eroded section downstream as it will not be battered with peaks that it will currently be getting, but rather lower peaks for longer periods of time.
be 20665m3, this would be excavated by 12285m3 to obtain a volume of 32950m3. The earth weir wall would utilise 5300m3 of this spoil, with the remainder to be used on the downstream side of the pond wall or lost onsite, opposite Tate Rd out of the creek channel.
Revegetation of the site was included, covering 1 hectare. Specific areas would be set aside in the base of the ponds to enable removal of sediments. It would be beneficial for the flows to traverse through the plantings before entering the low spots designed for sedimentation removal; as this would facilitate a reduction in velocity and aid nutrient removal. Over time a height difference would occur between the planting and the sedimentation areas as the larger sediments settle in the plantings when the velocity is reduced.
Stage 2: Rehabilitation of Eroded Section: This stage has been included early in the order of works to enable the revegetation of the site to establish prior to the diversion link being opened. It includes 0.3 hectares of native revegetation to stabilise the existing soil structure, increase surface roughness and hence reduce the velocity and erosion. In this section plants which lay down under high flows to protect the soil surface such as Lomandra would be beneficial, as advised by staff members of Terrain.
Strategic sites have been identified for four gabion drop structures along the length of the eroded section. These sites include the initial drop from the smooth grassed channel down into the scoured section and three eroded holes situated upstream of the driveway crossing and corner of the creek. These structures would consist of 2x1x1m baskets and 6x2x0.16 reno matresses. Figure 3.5.6 shows the location of these drop structures.
It is proposed that the drop structures would be situated as such to reduce the erosion from propagating upstream. The drop also aids energy dissipation. The reno mattress would be utilised at the base of the drop structures to prevent the continued deepening of these holes.
additional flows. This stage includes increasing the capacity of the existing diversion drain to meet Q100 flows, installation of culverts under Griffin Road and diversion mounds on the Southern side of Griffin Road to turn flows 90 degrees into the culverts.
It is proposed to use three cells of 1200x750x1200 sized culverts, which will require lifting the road profile at this point. It was found that this arrangement closest matched the Q100 discharge of 10.6m3/s, giving a discharge of 11.05m3/s when installed on a 2% grade. The road profile at this location would be such that the culverts have a minimum of 400mm cover. Refer appendix H for a diagram of these culverts.
It is proposed the diversion mounds be constructed from material excavated from the culvert installation and consist of a mound either side of the culverts to guide funnel flows into the culverts. 77m3 spoil remains from the construction of the diversion drain, the diversion mounds being 2 x 20m long x 1m high x 4m wide require approx 80m3 of fill. Hence the spoil from the diversion drain will be used to form the diversion mounds. A small detention pond at this site would be beneficial and would require negotiations with the landholder. This however is beyond the scope of this study and may be noted for further research.
The culverts and diversion mounds will be the control structures for the flows entering the diversion drain, preventing excessive flows from entering the system which may otherwise result in flooding downstream.
Figure 3.7.1 Culvert site
Stage 4: Revegetation of Spring Creek: Although possibly too extensive for the scope of this study; revegetation of Spring Creek is an important step to returning this catchment to an ecologically sustainable environment. This stage has been included as a long term goal and may be subdivided into smaller projects to reach this goal.
3.8 REVEGETATION
It is proposed that revegetation of the diversion drain, detention basin and eroded section at the bottom of the catchment would be conducted in conjunction with tree planting organisations such as BRICMA (Terrain), utilising volunteers to undertake the plantings. This organisation handled the tree planting for the new detention basins on Griffin Road, it is proposed to engage them again.
Trees for the Evelyn and Atherton Tablelands inc (TREAT) identifies the site is a transition between a complex semi-evergreen notophyll vine forest (mabi forest) and corymbia clarksoniana (Clarkson’s bloodwood) open forest to woodland. The species selection supplied by Terrain NRW not only matches the regional ecosystem but utilises species tolerant to water inundation.
The species list is categorised into three sections as per condition suitability; being wet zones, dry zones and high velocity zones. This is to ensure species are planted in the correct locations, hence reducing tree losses. Terrain staff members advised that generally in this area a loss of 10% is considered typical. Refer to appendix F for the list of proposed species supplied by Terrain..
It is proposed that wet zone species would be located on the base of the detention basin and the flood plain areas of Spring Creek. Dry zone species would be used on the walls of the diversion drain, detention basin and banks of Spring Creek. Velocity zone species would be used on the base of the diversion drain, the entrance into Spring Ck, inlets/outlets to detention basin and existing eroded section of Spring Creek.
3.9 EASEMENT
An existing easement is in place over the existing earth drain which is proposed to be used as the diversion drain. This easement is for power as high voltage powerlines run parallel to the drain on the Western side.
The existing easement documents would need to be modified to include public utilities such as drainage, to enable the diversion drain to be used and maintained in the future. Negotiations will need to be undertaken between the local authorities, Ergon Energy and the landholder. These negotiations would result in an acquisition by private treaty. The proposal is unlikely to restrict the usage of this area by Ergon Energy or the landholder and there is no foreseen reasons why the existing easement couldn’t be amended to include drainage.
[image:59.595.102.493.440.715.2]CHAPTER 4
FURTHER RESEARCH
Now that feasibility has been confirmed to this level of analysis, detailed analysis and design should follow. It is suggested that a hydrological modelling tool such as RORB, should be used to obtain more accurate results to enable the detailed design of:
• The diversion channel • The detention pond, • Erosion site
Should the proposal continue to the next stage, environmental approvals would need to be obtained before undertaking any works. These approvals would need to be obtained from organisations such as the Environmental Protection Agency, Department of Natural Resources and the local authorities such as Council.
CHAPTER 5
CONCLUSION
Findings from this study indicate that the proposal to divert portion of flows from the Griffin Road catchment, to the traditional Spring Creek catchment to relieve flooding in Tolga is feasible based on the hydraulic calculations undertaken, proposal costing and positive resident feedback.
• The HECRAS modelling confirmed that a majority of the existing
diversion channel can cater for Q100 floods in its current stage, with only minor works required to gain capacity at the upstream end.
• The proposed detention pond analysis demonstrated that Q100 flows can
easily be detained and released at existing peak flow levels, hence assisting to safeguard downstream residents from flooding and erosion.
• Existing erosion at the bottom end of the catchment can be managed
through drop structures and revegetation.
• The costing estimate of the proposal totalling $352500 is within a feasible
range and Government grants could be secured to fund the project in stages.
• Resident feedback was extensively supportive towards the project
providing issues raised were addressed. No objections were raised agains this proposal
REFERENCES
Argue, J.R. 1986, Storm Drainage in Small Urban Catchments: A Handbook for Australian Practice. Special Report No. 34, Australian Road Research Board, Vermont South, Vic.
Brisbane City Council 2003, Natural Channel Design, Brisbane City Council, Brisbane Queensland.
Chadwick, A., Morefett, J. 2002, Hydraulics in Civil and Environmental Engineering, Third Edition, Spon Press, London.
Chow, V.T., 1959, Open Channel Hydraulics, McGrawHill, New York
Dept Main Roads, 2002, Road Drainage Design Manual, Queensland Department of Main Roads, Brisbane, Queensland.
DNR&W 2007, Queensland Urban Drainage Manual, Queensland Department Natural Resources and Water, Brisbane Queensland.
Engineers Australia 2001, Australian Rainfall and Runoff Aspects of Hydraulic Calculation, Engineers Australia, Canberra Australian Capital Territory.
Engineers Australia 2005, Australian Runoff Quality – A Guide to Water Sensitive Urban Design, Engineers Australia, Canberra Australian Capital Territory.
FNQROC, 2009, Far North Queensland Region of Councils Development Manual, Far North Queensland Region of Councils, Cairns, Queenslad
Henderson, F. M., 1966, Open Channel Flow, Macmillan, New York.
Nalluri, C., Featherstone, R. E. 2001, Civil Engineering Hydraulics, Fourth Edition, Blackwell Science, Oxford.