This document is also available in pdf and
text only format from the NRDC's website,
www.nrdc.org.uk
For information on alterative formats,
please contact:
Emily Brewer
Marketing and Publications Officer
Institute of Education
University of London
Tel: 020 7947 9501
Email: [email protected]
We welcome feedback on the content and
accessibility of this publication. This should
be sent to:
Publications
NRDC
Institute of Education
20 Bedford Way
London WC1H 0AL.
Telephone: +44 (0)20 7612 6476
Fax: +44 (0)20 7612 6671
email: [email protected]
ISBN 1 90 5188 09 9
©Crown Copyright 2005
on condition that the source is
acknowledged.
NRDC is a consortium of partners led by
the Institute of Education, University of
London (see back cover for a list of
members) and is part of the Bedford
Group for Lifecourse and Statistical
Studies at the IoE.
www.ioe.ac.uk/bedfordgroup
Design: Chapman Design Limited
Print: Bradell
Cover photos: Photodisc/Medio Images
Peer review
Greg Brooks, University of Sheffield;
Augustin de Coulon, NRDC and
NATIONAL RESEARCH AND DEVELOPMENT CENTRE FOR ADULT LITERACY AND NUMERACY INSTITUTE OF EDUCATION, UNIVERSITY OF LONDON
Contents
SUMMARY 4
INTRODUCTION 8
Where does the data come from? 10
THE RESEARCH METHODOLOGY AND ASSESSMENTS 11
BCS70 age 21 survey 11
BCS70 age 30 survey 11
The numeracy-literacy typology 12
NUMERACY AND EDUCATIONAL ACHIEVEMENT 14
Early leaving 14
Qualifications 16
NUMERACY AND LABOUR MARKET EXPERIENCE 18
Labour market activity: full-time employment 18
Effect of part-time employment for women 22
Cumulative labour market experience from ages 16 to 29 24
EMPLOYMENT AT 30 26
Full-time labour market participation 26
Manual labour 27
Opportunities within work 27
Economic well-being 27
SOCIAL AND PSYCHOLOGICAL WELL-BEING 29
Social outcomes 29
Psychological state 30
NUMERACY VS LITERACY EFFECTS 31
Men 32
Women 33
DISCUSSION AND CONCLUSIONS 34
Men 34
Women 34
Most people recognise that a low level of literacy skill can make it difficult to function effectively in adult life, but it is often assumed that numeracy (i.e. being able to deal competently with numbers, tables and graphs) is less important than literacy. This study was designed to test whether this is in fact the case.
The study draws on data from two major longitudinal studies of the British population. Longitudinal studies are designed to follow the same group of people over their lifetime. They can identify patterns of change and can show how particular character-istics and experiences affect what happens to people over the period in question.
The two surveys used in this study were the 1958 National Child Development Study (which is referred to as NCDS) and the 1970 British Cohort Study (referred to as BCS70). Both surveys involved a study of all babies, about 17 000, born in a particular week in Britain (the ‘cohort’). Data about each cohort was collected at birth and follow-up surveys have been carried out at intervals over the years since then. These have included studies of the standards of literacy and numeracy and of many other aspects of the lives of the men and women in these two cohorts. This has made it possible to identify, by means of statistical analysis, the effect of poor literacy and/or numeracy on other aspects of people’s lives.
An earlier study, ‘Does Numeracy Matter?’ (BSA, 1997), showed that people with poor numeracy tended to leave full-time education at the earliest opportunity and usually without qualifications, followed by patchy employment with periods of casual work and unemployment1. Most of their jobs were low skilled and poorly paid and offered few chances of training or promotion. The impact of having poor literacy and numeracy skills has become greater as the number of unskilled manual jobs has declined and more and more jobs, such as those in the service sector and
administrative work, require higher levels of skill, including ICT skills. These changes have particularly affected women.
In this new study, the aim was to see how far poor numeracy was a problem in its own right or whether its effects could not be separated from the effects of poor literacy.
The study found that about 90 per cent of men and about 70 per cent of women with both poor literacy and poor numeracy left school at 16, compared with about 55 per cent of men and about 40 per cent of women with competent literacy and numeracy. The early leavers with poor literacy and numeracy were more likely to have no or few qualifications.
Summary
Educational achievement
However, there were no significant differences between those with just poor numeracy and those with both poor literacy and poor numeracy.
'As the majority of men and women with a poor grasp of numeracy and/or literacy left full-time education at age 16, the rest of the report concentrates on differences in outcomes and experiences by literacy and numeracy level in this group.'
Wider social changes have resulted in more women in the BCS70 cohort going out to work than in the NCDS cohort. Even so, while NCDS men with competent literacy and competent numeracy had spent 95 per cent of this period of their lives in full-time employment, and the equivalent BCS70 men (who were affected by the economic recession of the 1980s) were in full-time employment for 91 per cent of this time, the figures for women are only 65 per cent and 70 per cent .
However, NCDS men with poor literacy and poor numeracy spent only 86 per cent of their time in full-time employment, and BCS70 men 85 per cent. The equivalent figures for women are 53 per cent and 51 per cent , with many women spending time in part-time employment and full-part-time home caring roles.
Poor numeracy had a particularly negative effect on men’s full-time employment in the 1980s recession, whether or not it was combined with poor literacy.
Overall, more women in the BCS70 cohort were in full-time work at this age than in the NCDS cohort. However, for those with competent literacy and numeracy, the proportion grew from 40 per cent to 52 per cent , whereas for those with poor literacy and
numeracy it only grew from 30 per cent to 32 per cent . The effects of poor literacy and numeracy, and especially numeracy, weighed more heavily on women.
At the age of 30:
men and women with poor literacy and poor numeracy had the lowest levels of full-time employment in their age-group;
men and women with poor numeracy were more than twice as likely to be unemployed as those with competent numeracy;
70 per cent of men with poor literacy and/or numeracy were in manual jobs, compared with 50 per cent of those who were competent in both;
men who were poor in both skills were more likely to be in semi-skilled and unskilled jobs, to have had fewer work-related training courses, to have lower weekly wages and poorer promotion opportunities;
Summary
Employment between the ages of 16 and 29
Employment at age 30
■
■
■
40 per cent of women with low skills were in manual work, a much higher proportion than for all women of this age; and
men with poor numeracy had the lowest hourly rates of pay.
Overall, poor numeracy rather than poor literacy was associated with low economic well-being at this age.
The last part of the study shows how the impact of poor literacy and poor numeracy varies between the men and women in BCS70 who were aged 30 in 2000.
For men, the combination of poor literacy and poor numeracy was significant. Compared to men with competent literacy and numeracy, such men were:
more likely to be unemployed;
if employed, more likely to be in semi-skilled or unskilled jobs;
less likely to have used a computer at work;
less likely to have received work-related training or promotion;
less likely to be homeowners; and
more likely to be in a non-working household.
Men with poor numeracy, irrespective of their standard of literacy:
had less chance of being in a company pension scheme;
were more at risk of depression;
have little interest in politics; and
were more likely to have been suspended from school, or arrested and cautioned by the police.
For women, poor numeracy, independently of the standard of literacy, is more significant.
Women with poor literacy and poor numeracy were:
less likely to have received work-related training or promotion;
less likely to own their own home; and
more likely to have experienced depression. Summary
■
■
Numeracy versus literacy
■ ■ ■ ■ ■ ■
■ ■ ■ ■
Women with poor numeracy, irrespective of their standard of literacy, were:
less likely to be in full-time work (regardless of how many children they had);
if in work, more likely to be in semi-skilled or unskilled jobs;
more likely to be engaged in home care;
less likely to have interest in politics, or to vote;
more likely to report poor physical health in the last 12 months;
more likely to be in a non-working household;
more likely to have low self-esteem; and
more likely to feel they lacked control over their lives.
For both men and women, poor literacy, on its own, has barely any effect on life-chances at age 30.
For men, there is no real difference between the effect of poor literacy and poor numeracy together, and poor numeracy alone.
For women, while the impact of low literacy and low numeracy skills is substantial, low numeracy has the greater negative effect, even when it is combined with competent literacy.
Changes in the nature of employment are at the heart of the problem of numeracy for women. Modern jobs of the kind that appeal to young women, e.g. managing accounts, or using ICT equipment for administration, demand numeracy skills.
It is worth emphasising that, both for men and for women, numeracy skills will decline if they are not used and practised in employment. This creates a vicious circle: poor numeracy leads to limited employment, which leads to declining numeracy, which makes it harder to obtain and stay in employment.
Poor numeracy skills make it difficult to function effectively in all areas of modern life, particularly for women. Government policy should therefore target policy on tackling poor standards of numeracy among the most disadvantaged sections of the female population, to counter the risk of social exclusion.
Summary
■ ■ ■ ■ ■ ■ ■ ■
It has long been recognised that a competent grasp of literacy is an essential skill, without which people can find it hard to function effectively in adult life. Numeracy skills, however, still remain undervalued, despite the growing importance that employers place on numeracy1. There remains an inherent assumption among adults that being able to deal with numbers and graphics is not as important as being able to read and write competently2.
In 1997, the report ‘Does Numeracy Matter?’ (BSA, 1997), was published3. It drew on data from the representative 10 per cent sample of the 1958 National Child
Development Study (NCDS), one of the UK’s four Birth Cohort Studies, who had their functional literacy and numeracy assessed when aged 37 in 1995. The report gave striking evidence that numeracy did matter. Taking into account literacy level achieved, it was found that men and women with poor numeracy suffered relative disadvantage in the increasingly demanding world of work, particularly in times of economic recession, compared with those with poor literacy alone. Women lacking numeracy appeared to be particularly disadvantaged. Poor numeracy was related to cohort members leaving full-time education at the earliest opportunity, most often without qualifications, leading to a patchy employment career typically marked by periods of casual work and unemployment. Difficulties were encountered in both getting and keeping jobs, which were generally low skilled, poorly paid and promising few training and promotion opportunities.
There are a number of features of the modern labour market that help to explain the disadvantage experienced by those without a competent grasp of numeracy and/or literacy. Foremost among those is the steady decline over the last 30 years in the numbers of unskilled jobs in manufacturing and the growth of the service industry. Strengthened health and safety regulations, increasing financial accountability demands on employees, and the technological transformation of work, including the centrality of ICT in the modern office, increased the need for literacy and numeracy skills in the workplace. Across the period 1971 to 2010 - the date for which the Moser4basic skills targets are set - the proportion of the workforce in non-manual jobs is expected to rise from less than half to three fifths.
Introduction
1 Atkinson , J. and Spilsbury, M. (1993). Basic Skills and Jobs. London: The Basic Skills Agency. 2Bynner, J. & Parsons, S (1998). Use it or Lose it?London: The Basic Skills Agency.
3Bynner, J. and Parsons, S. (1997). Does Numeracy Matter?London: The Basic Skills Agency. Also see Bynner, J & Parsons, S. (2000),Impact of Poor Numeracy on Employment and Career Progression. Chapter 2 in Tickly C. and Woolf A. (Eds), ‘The Maths We need Now: demands, deficits and remedies.’ Bedford Way Papers, Institute of Education: London.
Table 1.Employment trends by manual and non-manual occupations 1971-1999 and projections for 2010, UK
1971
1999
2010
Total employment (millions) 24.2 27.5 29.7
Non-manual occupations 46% 56% 60%
Manual occupations 54% 44% 40%
Original source table derived from: Wilson (2001), CE/IER estimates F02F9 Forecast. The macroeconomic and industrial employment scenario is based on Cambridge Econometrics (July 2000).
In 1991 at age 21, a 10 per cent representative sample of 1623 members of the more recent 1970 British Cohort Study (BCS70) also had their functional literacy and numeracy assessed. To investigate the effects of numeracy vis à vis literacy, as in the earlier 1958 cohort analysis, a fourfold typology was used embracing
combinations of competent and poor numeracy and literacy skills, as defined in the following pages
This report starts with the relationships between numeracy, education and qualifications. We then compare the employment experiences of the 1958 NCDS cohort between the ages of 16 and 29 (1975 to 1987) with that of BCS70 between the same ages (1987 to 1999).
The 1970 cohort is a particularly important cohort in policy terms because its labour market experience, beginning in the mid-1980s, followed the major labour market transformations and economic recessions of the previous period, and reflects well the employment experience of today.
We then develop the scope of our previous investigations by focusing the analysis on early school leavers: those who had left full-time education at 16. This helps isolate the influence of basic skills from qualifications gained from school on employment.
Finally we use the multivariate analysis technique of logistic regression to estimate the impact of numeracy (compared to literacy) on a number of adult outcomes at age 30 in the spheres of occupation, home and family life, health, psychological well-being and political and social participation.
Because of the different experiences of men and women all analyses were carried out for the two sexes separately.
Introduction
■ The 1958 National Child Development Study (NCDS) is a longitudinal survey of approximately 17,000 people born in one week in March 1958. Follow-up surveys have been conducted at age 7, 11, 16, 23, 33, 42 and most recently at age 46.
■ In 1995, a representative 10 per cent of this cohort (1,714 individuals, aged 37) were assessed for functional literacy and numeracy skills. This data set formed the basis of ‘Does Numeracy Matter?’(BSA, 1997) .
■ The 1970 British Cohort Study (BCS70) is similarly a longitudinal survey of approximately 17,000 people born in one week in April 1970. Follow-up surveys have been carried out at ages 5, 10, 16, 26, 30 and most recently at age 34
■ In 1991, a representative 10 per cent sample (1,623 individuals, aged 21) completed an assessment of their literacy and numeracy skills. Where does
the data come from
BCS70 follow-up studies from 1970–2004
CHILDREN
BBS CHES CHES YOUTHSCAN BCS70 BCS70 BCS70
1970 1975 1980 1986 1991 1996 1990/2000 2004 BIRTH AGE 5 AGE 10 AGE 16 AGE 21 AGE 26 AGE 30 AGE 34 PARENTS PARENTS PARENTS PARENTS
SCHOOL SCHOOL
TESTS TESTS TESTS TESTS
MEDICAL MEDICAL MEDICAL MEDICAL
SUBJECT SUBJECT SUBJECT SUBJECT SUBJECT
16,135 13,135 14,875 11,628 9,003 POSTAL
11,261 ?
The functional skills of 10 per cent of the BCS70 cohort (1,623 individuals aged 21) were assessed in 1991 using assessment instruments that were similar in content and format to those used in the 1958 cohort and were similarly linked to the different levels of the Adult Literacy and Basic Skills Unit, subsequently the Basic Skills Agency, standards of the time – Wordpower and Numberpower5. These levels map approximately, but not precisely, onto the standards used by the Skills for Life strategy. The instruments were designed to assess respondents’ ‘functional’ skills, i.e. their ability to perform everyday tasks that involved using number or interpreting written communications. For literacy, for example, the tasks varied from extracting simple information from posters or the Yellow Pages, through to questions about the meaning of a relatively complex piece of text, e.g. an article about the symptoms of hypothermia. Numeracy tasks similarly ranged from everyday operations in shops and in the home, e.g. how to set a video to record a programme using the 24-hour clock, through to extracting information from graphs and timetables. The approach was paper-based and ‘open-response’, i.e. there were no constraints imposed on answers as there would be in a multiple-choice test. Answers were given in response to questions and visual stimuli supplied by trained interviewers. The results of the earlier (1958 cohort) and later (1970 cohort) studies of numeracy and literacy are therefore broadly comparable.
The purpose of our analysis was to establish measures of literacy and numeracy that could be used in statistical analyses of change and comparison over time. Since the content and the difficulty levels of the items in the 1991 tests were similar to those covered by the Skills for Life standards, we could assume that they would rank order respondents in much the same way, which is the essential requirement for our purpose.
Of the 1,623 BCS70 cohort members whose literacy and numeracy were assessed in 1991 when they were aged 21, 1,352 (83 per cent) took part in the 2000 follow-up survey when they were aged 306. Table 2 shows the distribution of the original 1991 and reduced 2000 sample by their grasp of literacy and numeracy.
The research methodology and
assessments
BCS70 age 21 survey
BCS70 age 30 survey
5For a more detailed account of the issues see Parsons, S. and Bynner, J. Measuring basic skills for longitudinal study(2005). London: NRDC.
Table 2. Distribution of BCS70 cohort members by literacy and numeracy: 1991 and 2000
LITERACY NUMERACY
1991 2000 2000 as 1991 2000 2000 as age 21 age 30 % of 1991 age 21 age 30 % of 1991
% n % n % n % n
very low 8 132 7 100 76 27 435 26 346 80
low 16 264 15 204 77 21 347 22 300 86
average 30 483 30 410 85 24 389 25 333 86
good 46 744 47 638 86 27 452 28 373 83
n(100%) 1623 1352 83 1623 1352 83
If there is any bias in the figures presented later in this report, it is likely to be conservative, that is, an underestimation of the number of cohort members with poor numeracy and/or literacy. This is because those assessed as having very low literacy in 1991 were the least likely to be involved in 2000 - the number fell from 132 to 100 (76 per cent). However, the distribution of the reduced sample of cohort members taking part in 2000 across literacy and numeracy groups is very similar to that of the original 1991 sample
To allow us to explore how far numeracy problems were subsumed under literacy problems, or how far they constituted a significant problem in their own right, we constructed a fourfold typology using the categories ‘competent’ or ‘poor’ numeracy and ‘competent’ or ‘poor’ literacy. The first task was to identify respondents with ‘poor’ numeracy and ‘poor’ literacy, as opposed to ‘competent’ numeracy and ‘competent’ literacy. The ‘poor’ numeracy group was defined as those with a ‘very low’ numeracy test score.
However, the small number with ‘very low’ literacy scores meant that the ‘poor’ literacy group was defined as those with either ‘very low’ or ‘low’ scores. At the other end of the scale, ‘competent’ numeracy was defined by ‘low’, ‘average’ and ‘good’ numeracy test scores and ‘competent’ literacy was defined by ‘average’ and ‘good’ test scores.
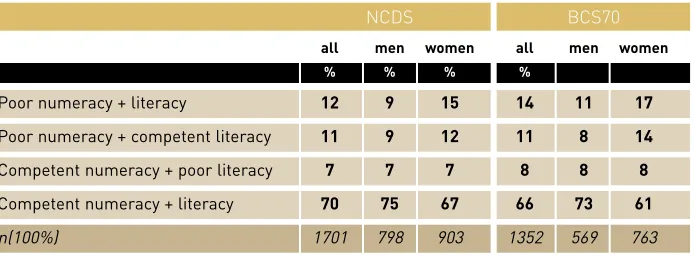
Table 3 shows the distribution of respondents across the resultant fourfold typology for both NCDS and BCS70.
The
Table 3. BCS70 cohort members by combined grasp of numeracy and literacy, compared with NCDS cohort members.
NCDS BCS70
all men women all men women
% % % %
Poor numeracy + literacy 12 9 15 14 11 17
Poor numeracy + competent literacy 11 9 12 11 8 14
Competent numeracy + poor literacy 7 7 7 8 8 8
Competent numeracy + literacy 70 75 67 66 73 61
n(100%) 1701 798 903 1352 569 763
Notably, a slightly lower proportion of men and women in BCS70 had a ‘competent’ grasp of both numeracy and literacy than in NCDS. This may reflect the much younger age of the BCS70 respondents when they were assessed (age 21 compared to 37) and we might expect that, with age and experience, their functional numeracy would improve. Alternatively, there may have been a genuine decline between the earlier and later cohorts in the acquisition of numeracy skills.
However, the overall distributions for the two cohorts across the combined skills typology were remarkably consistent. In both cohorts, the majority of men and women were competent in literacy and numeracy; roughly 3 in 4 men (75 per cent NCDS, 73 per cent BCS70) and 2 in 3 women (67 per cent NCDS, 61 per cent BCS70). As in ‘Does Numeracy Matter?’ our interest here is focused on the men and women in BCS70 who were poor (i.e. not competent) in numeracy, irrespective of their literacy. As shown in table 3, more women than men in BCS70 had poor numeracy combined with poor literacy (17 per cent to 11 per cent) or poor numeracy and competent literacy (14 per cent to 8 per cent). An identical proportion of men and women (8 per cent) had competent numeracy and poor literacy.
In ‘Does Numeracy Matter?’ the culmination of poor educational experiences among men and women with poor numeracy and/or poor literacy was evident in their early exit from the compulsory education system. Among the BCS70 cohort, competent numeracy also had a slightly stronger relationship to staying on in full-time education than competent literacy, particularly among men7. Figures 1a and 1b show that more women than men remained in full-time education after age 16, but there was a mass exodus of men and women with either a poor grasp of numeracy or literacy from full-time continuous education at age 16; between 85–92 per cent of these groups of men, and 67–75 per cent of the comparable groups of women left at the minimum statutory age.
By concentrating further analysis of adult outcomes among the 387 men and 401 women who were identified as early school leavers, the strong potentially confounding influence of post-16 education and associated qualifications on the later occupational profiles and experiences of the cohort members was greatly reduced.
Numeracy and
educational achievment
Early leaving
Figure 1. Men: percentage of men in full-time education between age 16 and 30 by their grasp of numeracy and literacy
Age
% in full-time education
a: Men
0 20 40 60 80 100
at 16 post-age 16 post-age 18 post-age 21 in edu at 30
at 16 post-age 16 post-age 18 post-age 21 in edu at 30
Age
% in full-time education
b: Women
0 20 40 60 80 100
Poor numeracy and literacy
Ke
y
Poor numeracy and competent literacy
Competent numeracy and poor literacy
Competent numeracy and literacy
BCS70 cohort members were among the last school leavers to experience the two-tiered examination system of GCE O’Levels and CSEs that preceded the GCSE system. One of the best documented education yardsticks of today is the percentage of children within a school who attain five or more GCSEs at grade A–C by age 16. Across the whole cohort who provided information on qualifications in 2000
(n=11,194), 33 per cent achieved the equivalent of this standard; among early school leavers the percentage was just 15 per cent8.
[image:16.496.91.465.410.631.2]Figure 2 shows that among early school leavers men and women with competent numeracy and literacy were the most likely to have achieved the ‘magic five’ (18 per cent men and 23 per cent women). Following this group, the three groups with evidence of at least one poor basic skill showed a lower level of achievement, with women doing better than men. Unaccountably men with poor numeracy and literacy were the next most likely to have achieved the equivalent of the 5 A–C standard (10 per cent); whereas for women the equivalent achievement was among those with ‘competent numeracy and poor literacy’ (17 per cent). However, the small numbers involved meant that the percentage differences were not statistically significant. Screening out the early school leavers had effectively removed most of the qualification differences among the groups.
Figure 2. Percentage of men and women with academic qualifications by their grasp of numeracy and literacy Qualifications
% with specific qualifications
pn+pl pn+cl cn+pl cn+cl
Numeracy and literacy skills group
Men Women
No qualifications
1+ qualifications
5 GCSE A-C (equivalent) qualifications
0 10 20 30 40 50 60 70 80
pn+pl pn+cl cn+pl cn+cl
Ke
y
Numeracy and educational achievement
pn+pl = poor numeracy and poor literacy;pn+cl = poor numeracy and competent literacy;
cn+pl = competent numeracy and poor literacy;cn+cl = competent numeracy and competent literacy.
8This included CSE Grade 1, GCSE Grade A-C, O’ Level Grade A-C. Phot
Early school leavers in BCS70 were defined as those who were no longer in full-time education six months after the end of compulsory education at 16, i.e. by January 1987. Between January 1987 and December 1999, four months before their 30th birthday, there were 13 years or 156 months of economic activity to be accounted for. As full-time employment is what most men and increasingly women spend most time doing we first examined the association of poor numeracy and/or literacy with the percentage of men and women in each skills group in a full-time job in each year, together with the cumulative amount of time cohort members spent in full-time employment and other economic activities. Experiences were compared with those of the early school leavers in the older NCDS cohort over the equivalent 13 full years from January 1975 – December 19879.
Figures 3 (a) and (b) compare, for NCDS and BCS70, the percentages of early school leaver men with poor numeracy and/or poor literacy spending most of their time in full-time jobs at different ages between ages 16–29. Figures 4 (a) and (b) make the same comparison for early school leaver women.
Figures 3 (a) and (b) both show fairly steady employment rates across the period with some fluctuations. In NCDS the recession in the early-mid 1980s (around age 23) particularly appeared to hit men with poor numeracy as shown by the dip in the rates exacerbated for the ‘poor numeracy and poor literacy’ group. But men with ‘poor numeracy and competent literacy’ were also more likely to be out of the full-time labour market compared with those with competent numeracy, whose employment rate remained relatively stable.
For BCS70, this pattern was only partly confirmed. During the teens, although full-time employment was the most common experience, the Youth Training Scheme (YTS) was also prominent, reducing employment rates. Through early adulthood there was little separation between the four groups, but from age 27 onwards those with poor numeracy and poor or competent literacy again had the lowest
employment rates.
Numeracy and labour
market experience
Labour market activity: full-time employment
Figure 3. Men: percentage of early school leavers in full-time employment
Age
% in full-time education
16-17 18 19 20 21 22 23 24 25 26 27 28 29-30
(a) NCDS Men: January 1975 – December 1987
0 20 40 60 80 100
Age
% in full-time education
16-17 18 19 20 21 22 23 24 25 26 27 28 29-30
(b) BCS70 Men: January 1987 – December 1999
0 20 40 60 80 100
Poor numeracy and literacy
Ke
y
Poor numeracy and competent literacy
Competent numeracy and poor literacy
Competent numeracy and literacy
Figure 4 shows the well documented steady exit from full-time employment of women from the highest levels of engagement in the teenage years. However, for women in the more recent BCS70 cohort this exit between 16–29 was more moderate. More women in BCS70 remained in full-time employment through their twenties, reflecting the increase in the average age that women have children10. This difference in the engagement of women in NCDS and BCS70 was most marked among those with competent numeracy and literacy. However, among women with poor numeracy and literacy the exit from full-time employment actually remained as steep in BCS70 as it had been in NCDS.
Focusing on differences in employment rates for age 29–30 we see that in NCDS (figure 4a) the percentage of women with competent numeracy and literacy in full-time employment was 40 per cent compared with 32 per cent of women with poor numeracy and literacy, a gap of just 8 per cent. The corresponding percentages for women in BCS70 (figure 4b) were 52 per cent and 30 per cent respectively - a difference of 22 per cent.
This shift points to growing polarisation of women’s employability with respect to their basic skills and the increased marginalisation of those in the more recent cohort who lack basic skills. This is particularly so for those lacking numeracy as we shall see when considering part-time employment.
Numeracy and labour market experience
Figure 4.Women: percentage of early school leavers in full-time employment
Age
% in full-time education
16-17 18 19 20 21 22 23 24 25 26 27 28 29-30
(a) NCDS Women: January 1975 – December 1987
0 20 40 60 80 100
Age
% in full-time education
16-17 18 19 20 21 22 23 24 25 26 27 28 29-30
(b) BCS70 Women: January 1987 – December 1999
0 20 40 60 80 100
Poor numeracy and literacy
Ke
y
Poor numeracy and competent literacy
Competent numeracy and poor literacy
Competent numeracy and literacy
Unlike men, when women are not in full-time employment they are very often engaged in part-time work. Figures 5 (a) and (b) show women’s employment rates but this time including time spent in part-time jobs. The reduced gradients of the graphs show that women increasingly moved into part-time work to accommodate childcare, career and economic circumstances. Notably, compared with the BCS70 women, the steeper gradient for the older NCDS women shows that more of them followed a full-time home-care role. For BCS70 women with ‘competent numeracy and competent literacy’, participation in paid employment only dropped below 80 per cent in one year, bringing it close to the participation levels of men. This was in contrast to comparable women in NCDS, where a steady decline from 80 per cent to 60 per cent occurred from age 20.
Women in both cohorts with ‘poor numeracy and poor literacy’ still had the weakest link to paid work, though in the case of BCS70 up to age 27 there was little to separate all three poor skills groups, i.e. the gap lay between the group competent in the basic skills and those who were deficient in at least one. From then on those with poor numeracy were the least likely to be employed.
Effect of part-time employment for women
Figure 5.Women: percentage of early school leavers in full-time or part-time employment
Age
% in full-time education
16-17 18 19 20 21 22 23 24 25 26 27 28 29-30
(a) NCDS Women: January 1975 – December 1987
0 20 40 60 80 100
Age
% in full-time education
16-17 18 19 20 21 22 23 24 25 26 27 28 29-30
(b) BCS70 Women: January 1987 – December 1999
0 20 40 60 80 100
Poor numeracy and literacy
Ke
y
Poor numeracy and competent literacy
Competent numeracy and poor literacy
Competent numeracy and literacy
The graphs just displayed show the percentages of early school leavers participating in employment year by year between age 16–29. We can take this analysis further by aggregating cohort members’ experience of different labour market statuses: full-time employment, part-full-time employment, employment training, full-full-time education, home care, unemployment and out of the labour market 11.
As we might expect, the dominant activity for men across the whole period was full-time employment with less than 5 per cent of the full-time spent in any other status including unemployment and ‘out of the labour force’. For women, although full-time employment was similarly the main activity, substantial proportions of full-time were also spent in other statuses including part-time employment and home/family care, with a marked decline in the home/family care percentage from the earlier NCDS cohort to the more recent BCS70 cohort. Table 4 shows that from age 16 to age 29, depending upon which of the four skills group they were in, between 12–17 per cent of the BCS70 women’s time was spent in part-time work, whereas for women in NCDS just 5–8 per cent of their time was in part-time work. Conversely, time spent in a ‘home/family care’ role declined from between 25–37 per cent for women in NCDS to between 12–25 per cent for women in BCS70. These cohort differences show again the strengthening relationship between the younger
generation of women and the labour market, particularly through the combination of a home care role with a part-time job.
In both cohorts men and women with ‘competent numeracy and competent literacy’ spent the most time in full-time employment:
NCDS men 95 per cent, BCS70 men 91 per cent. NCDS women 65 per cent, BCS70 women 70 per cent.
Men and women in the ‘poor numeracy and poor literacy’ group spent the least time in full-time employment:
NCDS men 86 per cent, BCS70 men 85 per cent. NCDS women 53 per cent, BCS70 women 51 per cent.
Among the NCDS men there was more experience of unemployment in the low skilled groups, with the highest percentage being among those with both poor numeracy and literacy. For BCS70, poor literacy appeared the more important factor but numbers were too small to be certain or establish statistical significance. For Cumulative
labour market experience from ages
16 to 29
■ ■
■ ■
Numeracy and labour market experience
women, the situation was reversed. Although there were barely any differences between the groups in the time spent unemployed, for those in the equivalent ‘out-of-labour-force status’ of home care, the differences were substantial. This time the NCDS cohort clearly showed a closer link of home/family care with poor literacy rather than with poor numeracy. For women in BCS70, home/family care was identified with both ‘poor numeracy and poor literacy’.
Table 4.Percentage of women in home-care and part-time employment and other statuses compared across the basic skills groups
BASIC SKILLS GROUPS EMPLOYMENT STATUS NCDS BCS70
% %
poor numeracy + literacy Home/family care 37 25
Part-time work 5 17
Full-time education 0 1
Unemployment 4 3
Total 46 46
poor numeracy + competent literacy Home/family care 28 19
Part-time work 9 10
Full-time education 0 3
Unemployment 2 6
Total 39 38
competent numeracy + poor literacy Home/family care 31 20
Part-time work 8 14
Full-time education 0 0
Unemployment 5 2
Total 44 36
competent numeracy + literacy Home/family care 23 12
Part-time work 8 12
Full-time education 0 2
Unemployment 2 1
Total 33 27
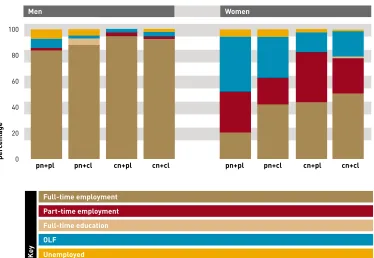
The data presented so far relate to the whole period of labour market experience for early school leavers from 16–29, and point to the growing importance of basic skills to the more recent cohort. We now complete the picture by examining the most up-to-date figures just for BCS70 - that prevailing in 2000 at the time of the interview at age 30.
[image:26.496.89.463.405.663.2]In figure 6 we see that by age 30 men and women with poor numeracy and poor literacy still had the lowest levels of full-time labour market participation, with poor numeracy more strongly related to lack of paid employment than poor literacy. For women, the picture was sustained even when part-time employment was included. Moreover, unemployment was twice as likely among men and women with poor numeracy as among those with competent numeracy: one in two of the women with ‘poor literacy and poor numeracy’ were out of the labour force or unemployed compared with two fifths of those with ‘poor numeracy and competent literacy’. This compares with just less than one in ten of those with ‘competent numeracy and poor literacy’ and slightly more among those with ‘competent literacy and competent numeracy’.
Figure 6.Current employment status at age 30
Employment at 30
Full-time labour market participation
Men Women
per
centage
pn+pl pn+cl cn+pl cn+cl pn+pl pn+cl cn+pl cn+cl
0 20 40 60 80 100
Full-time employment
Ke
y
Part-time employment
Full-time education
OLF
Among the early school leavers 70 per cent of men in all three poor skills groups were in manual jobs. This compares with just under 50 per cent in the ‘competent literacy and competent numeracy’ group. Men with ‘poor numeracy and poor literacy’ were more likely to be in semi-skilled or unskilled manual jobs. Women’s employment was mainly non-manual, but particularly among those with ‘poor numeracy and poor literacy’ just over two fifths were engaged in manual work. This reflects these women’s reduced access to the traditionally desirable office-based ‘administrative or secretarial’ work. For both men and women, poor numeracy appeared to reduce the likelihood of employment that required the use of a computer, particularly if this was coupled, in the case of men, with poor literacy.
In the earlier work on the NCDS cohort, poor numeracy was associated with restricted access to job opportunities within work itself. Men and women with poor numeracy and/or literacy had been on fewer training courses early on in their careers, whereas poor numeracy or literacy appeared to restrict training opportunities later on. More men and women with poor numeracy also earned a substantially lower weekly wage than other employees. In BCS70, poor numeracy was again negatively associated with access to and take-up of work-based training and promotion opportunities, although engagement was lowest among those with both ‘poor numeracy and poor literacy’. In addition, more men with poor numeracy worked for companies or firms that were less likely to offer company shares or a company pension, or to give paternity leave. Women with poor numeracy were also less likely to have been offered the opportunity to buy company shares, or to take maternity leave over and above statutory maternity leave. They were also less likely to receive travel and other fringe benefits, particularly so if they also had poor literacy.
Among all early school leavers in BCS70, the average gross hourly wage in 2000 for men and women in full-time employment was £9.25 and £8.16 respectively. Hourly earnings for earners in the bottom quarter of the earnings distribution were below £6.44 for men and £6.11 for women. Small numbers in full-time work, particularly women, restricted any meaningful analysis of the relationship between poor numeracy and earnings for them. But for men there was a clear difference between the basic skills, with men whose numeracy was poor earning the least per hour - at just £7 an amount that was close to the lower end of all earners.
Manual labour
Opportunities within work
Economic well-being
Poor numeracy was also associated with being part of a ‘non-working’ household. Twice as many men with poor numeracy were part of a non-working household in comparison with men with competent numeracy. In figure 7 we see that among women those with poor numeracy were up to three or four times as likely to be in such a household, particularly if poor numeracy was coupled with poor literacy.
Figure 7. Family working status at age 30 by combined numeracy and literacy
per
centage
pn+pl pn+cl cn+pl cn+cl
N d lit kill
Men Women
pn+pl pn+cl cn+pl cn+cl
0 20 40 60 80 100
Single, working
Ke
y
Couple, both in work
Couple, one in work
No-one working
We have seen that for BCS70, poor numeracy, rather than poor literacy, was associated with poor economic well-being. Was poor numeracy similarly a problem in other areas of cohort members’ adult lives?
Men and women with poor numeracy were least likely to be home owners, and more women with poor numeracy experienced a spell of homelessness. There were no clear differences with respect to healthy lifestyle behaviour – not smoking, not drinking alcohol, eating well and taking exercise, but more women with poor numeracy reported their health to have been ‘poor’ in the last 12 months. Among women, poor numeracy was also associated with low levels of political interest – they were least likely to vote.
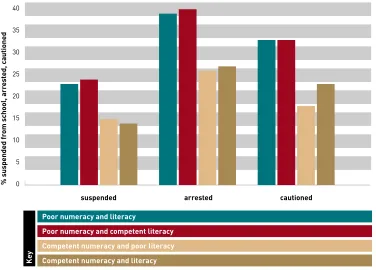
[image:29.496.90.466.384.654.2]In line with previous research12, BCS70 men with poor numeracy, whatever their grasp of literacy were more likely to have been in trouble with authority at various times in their lives. Figure 8 shows that the two groups of men with poor numeracy were the most likely to have reported suspension from school, arrested and cautioned by the police.
Figure 8.Percentage of men who were suspended from school or arrested and cautioned by the police
Social outcomes
Social and psychological
well-being
% suspended fr
om school, arr
es
ted, cautioned
Women
suspended arrested cautioned
0 5 10 15 20 25 30 35 40
Poor numeracy and literacy
Ke
y
Poor numeracy and competent literacy
Competent numeracy and poor literacy
Competent numeracy and literacy
Poor numeracy, more than poor literacy was associated with lower self-esteem, particularly among women. Women with poor numeracy and literacy were also more likely to report feeling that ‘I usually find life’s problems just too much for me’ and that ‘Whatever I do has no real effect on what happens to me’. The association of symptoms of depression with poor basic skills, particularly among women, is well established from our earlier work13. Figure 9 shows the relationship in BCS70 for the ‘Malaise’ scale - an instrument comprising 24 indicators of depression for which endorsement of more than 7 signifies depression14. The figure shows, that it was poor numeracy rather than poor literacy that related to increased scores on the Malaise scale. Notably, the differences between skills groups in terms of percentages who had been depressed, were most marked among men.
Figure 9.Percentage of men and women ‘depressed’ on the Malaise scale at 30
Psychological state
13 Bynner, J. and Parsons, S. (2001) Qualifications, basic skills and accelerating social exclusion, Journal of Education and Work, 15: 279-291. 14 See Rutter, M., Tizard, J. and Whitemore, K. (1970) Education, Health and Behaviour. London: Longman.
% ‘depr
es
sed’
Women
0 10 20 30 40
50
Men Women
Poor numeracy and literacy
Ke
y
Poor numeracy and competent literacy
Competent numeracy and poor literacy
Competent numeracy and literacy
Our previous research pointed to the influence of family socio-economic background and education experiences on poor acquisition of basic skills15and suggested that the poor acquisition of these were associated with negative socio-economic outcomes in adulthood, such as unemployment, even when these family background and other influences were taken into account16.
So far in this report we have shown that even when comparisons are restricted to early school leavers, men and women with poor numeracy and/or poor literacy appear to have more difficulty in succeeding in a number of areas of adult life in comparison with men and women who have a good grasp of the basic skills.
To make a more robust assessment of the influence of a poor grasp of numeracy and/or literacy on the various age-30 outcomes in adulthood, we analysed the data using the statistical technique of logistic regression. The details of the methods and the statistical results are given in the appendix. We focus here on the main findings. The outcomes included employment, social participation, health and well-being.
Broadly, logistic regression enables us to predict whether individuals with poor numeracy compared with others are at risk of experiencing one of these outcomes, such as unemployment at age 30, taking account of other characteristics. A particular interest is whether the qualifications achieved by an individual override the effect of having poor numeracy. Accordingly, there were two stages to the analysis. In the first stage the outcomes were predicted just from membership of the four categories of the numeracy/literacy typology. In the second stage, highest qualification achieved was also included to see whether in the presence of this potentially competing influence, the predictive power of numeracy especially was sustained.
The following results are based on comparing the strength of prediction of the adult outcomes from membership of the first three categories of our typology: (a) poor literacy/ poor numeracy; (b) poor numeracy/competent literacy; (c) competent numeracy/ poor literacy; with (d) competent literacy/competent literacy, serving as a reference category or baseline. The numeracy ‘effect’ is demonstrated when a statistically significant prediction is obtained for (b) but not for (c). When only (a) shows the significant prediction, then poor literacy and poor numeracy only in combination (i.e. poor basic skills generally) are implicated in the negative outcome. When (c) but not (b) shows the significant prediction then poor literacy is identified as the key factor in the negative outcome rather than poor numeracy.
Logistic regression analysis
Results
15 Bynner, J. and Steedman, J. (1995) Difficulties with basic skills, London: Basic Skills Agency. ;Parsons, S., & Bynner, J. (1998): Influences on Adult Basic Skills. The Basic Skills Agency: London.
In the first stage of the analysis substantially more statistically significant effects on the age-30 outcomes were evident for numeracy than for literacy (b compared with c) for both men and women. However in the second stage of the analysis, with highest qualification controlled, the picture changed for men and women. For men most of the effects lost statistical significance whereas for women they were sustained. In other words, for men the key predictor of the age-30 outcomes was poor basic skills generally, i.e. both poor numeracy and poor literacy together, whereas for women poor numeracy was the more important predictor.
With three exceptions negative outcomes were predicted by literacy and numeracy together, i.e. poor basic skills generally appeared to be implicated in the negative outcome rather than numeracy or literacy alone.
Men with poor basic skills were less likely than others to be in a full-time job. They were more likely to be unemployed and more likely to be in semi-skilled or unskilled employment.
Men with poor basic skills were also less likely to use a computer at work and less likely to have received work-related training and to have had the opportunity for promotion in their current employment. However, participation in a company pension scheme was also less likely for men with poor numeracy even when their literacy was good.
Men with poor basic skills were less likely to be home owners and more likely to be part of a non-working household.
Political interest was the only outcome examined to have the stronger connection with poor literacy rather than poor basic skills generally. Men with poor literacy were more likely to lack political interest.
Before highest qualification was controlled, poor numeracy strongly predicted the risk of being arrested. The relationship lost statistical significance, however, once highest qualification was controlled. This shows that the strong association between crime and numeracy demonstrated earlier can probably be attributed largely to educational achievement rather than to numeracy independently.
Men with poor basic skills were more likely to feel they lacked control over their lives. However, independently, men with poor numeracy were also more likely to be at risk of depression.
ac heading
Health and well-being Employment
Men
Employment-related
Other economic outcomes
Social participation and crime
For women, even when highest qualification was controlled, poor numeracy -independently of literacy - continued to predict most of the negative outcomes in adulthood.
Women with poor numeracy were less likely to be in a full-time job at age 30. They were also less likely to be in any form of paid employment (including part-time), and more likely to be engaged in home care. Among those in work, poor numeracy also predicted being in an unskilled or semi-skilled job.
To try to account for the strong influence of having children on women’s relationship to employment, the analysis was repeated, including the total number of children a woman had at age 30 - ‘none’, ‘one’, and ‘two or more’ – as an additional control . Although number of children predicted many of the outcomes, when this variable was controlled the relationship between numeracy and these outcomes remained
unaffected. So, for example, women with poor numeracy were less likely to be in a full-time job, regardless of the number of children that they had.
Women with poor basic skills were unlikely to have received work-related training or to have had the opportunity of promotion, but there were no separately identifiable numeracy effects. The same applied to the likelihood of working for a company that offered maternity leave above statutory levels. On the other hand, women with poor numeracy alone were less likely to work for a company that offered company shares.
Women with both poor numeracy and poor literacy were less likely to own their own homes. But poor numeracy, rather than poor literacy, predicted women being part of a non-working household.
Poor numeracy, regardless of literacy competence, predicted low political interest, and increased likelihood of not voting. Women with poor numeracy were less likely to have voted and more likely to lack any interest in politics. On the other hand, absence of membership of a community or voluntary organisation or the Parent Teacher Association (PTA) was related to poor basic skills generally.
Women with poor numeracy were independently more likely than others to report poor physical health and to believe they lacked control over their lives. However, women with poor basic skills generally were more likely to have experienced
depression, to feel overburdened with problems in life and to feel they rarely got what they wanted out of life; i.e. there was no separately identifiable numeracy effect.
Health and well-being
Women
Employment
Employment-related
Other economic outcomes
Social participation
The descriptive analysis pointed to powerful possible effects of numeracy on a number of adult economic, social and psychological outcomes. The logistic regression analysis refined the picture further, identifying different possible effects for men and women.
Once all basic skills combinations and highest qualification obtained were taken into account in the analysis, the negative basic skills effect on adult outcomes was clearly apparent only for the combination of poor numeracy and poor literacy, i.e. absence of both skills rather than numeracy alone was what mattered. This applied not only to the labour market outcomes, but to the whole range of economic, social and psychological outcomes that the analysis encompassed with the exception of:
lack of access to an employer pension scheme - predicted by poor numeracy;
depression - predicted by poor numeracy; and
lack of political interest - this time the combination of competent numeracy with poor literacy showed the negative effect, i.e. poor literacy appeared to be the critical factor.
These results suggest that lack of basic skills and poor educational achievement generally is bound up for many men with the economic, social and psychological difficulties that emerge later in life. The picture gained is one of a life course marred by disadvantage and failure relative to others and a far less accommodating world than that enjoyed by previous generations. Poor acquisition of the basic skills plays a part in the process, having both direct and indirect effects (through educational failure) on the later (negative) outcomes, but neither numeracy nor literacy generally takes precedence over the other in accounting for them.
For women the picture that emerges is rather different. Once again, the combination of ‘poor numeracy and poor literacy’ appears most disadvantageous, relating to the widest range of age 30 negative outcomes. But in this case centrality attaches to numeracy. For a high proportion of both the labour market and non-labour market outcomes poor numeracy in combination with competent literacy also showed negative effects. Thus women with poor numeracy regardless of their level of literacy, tended, more than others:
■
■
■
Men
Women
Discussion and conclusions
to be out of the labour market in a full-time home caring role;
to live in a non-working household;
not to vote;
not to have any political interest;
to have poor physical heath;
to be depressed; and
to feel they lacked control over their lives.
It is probable that changes in the nature of employment lie at the heart of the numeracy problem in the sense that modern jobs of the kind to which young women, including early school leavers, are attracted place a high premium on skills to which basic numeracy is central. These jobs range from managing accounts to using ICT equipment in the modern office. The barrier poor numeracy can present for access to such jobs may well therefore be one of the factors in these young women’s early exit from the labour market and other signs of subsequent social exclusion.
Numeracy poses particular problems for employability because if numeracy skills are not used in employment they are likely to decline. This is less the case with literacy, where there is constant exposure to written communications. It is not surprising therefore that re-analysis of the International Adult Literacy Survey (IALS) data showed a decline in numeracy with age17. In addition, earlier analysis based on the 1958 cohort, showed that among poorly skilled men, whose occupation was typically semi-skilled and unskilled, the longer they were out of work the more their numeracy scores declined18. It seems likely that as women continue to engage more with the labour market, a similar decline in numeracy with unemployment will occur among them as well. This highlights the vicious circle in which a skills deficit that is already impeding access to employment gets worse with lack of use, restricting access even further.
The surprising result is that for both men and women literacy barely features as
■
■
■
■
■
■
■
17 Parsons, S., & Bynner, J. (1999): Literacy, Leaving School and Jobs: the effect of poor basic skills on employment in different
age groups. The Basic Skills Agency: London. 18 Bynner, J. & Parsons, S (1998): Use it or Lose it?The Basic Skills Agency:
having an independent effect on any of the age-30 outcomes. We cannot exclude the possibility that the grouping of literacy scores in constructing the typology may have had something to do with this. The merging of ‘very low’ and ‘low’ scores’ to build up the numbers in the ‘poor’ literacy group was necessary to construct the
numeracy/literacy typology, but contrasts with the use of only ‘very low’ scores to identify the ‘poor numeracy group. It might be the case that such a grouping for literacy is too crude for the fine-grained discrimination that is needed to identify the problem group. For numeracy where severe difficulties are much more common, the number in the ‘poor’ group did not need boosting hence the fine-grained
discrimination needed was achieved.
Such a restriction in the present investigation will not apply when repeating the analysis with the 2004 BCS70 follow-up containing numeracy and literacy
assessments for all c10,000+ participating cohort members with follow-up of adult outcomes to age 34. Our judgement is, however, that the current conclusions are likely to be broadly sustained. Poor numeracy imposes difficulties for functioning in all areas of life and represents a particular problem in the modern world for women. This analysis therefore gives an important pointer for policy. Targeting poor numeracy skills among the most disadvantaged sections of the female population is likely to be a particularly important antidote to the risk of social exclusion.
To make a more robust assessment of the influence of a poor grasp of numeracy and/or literacy on the various outcomes in adulthood, the data was analysed using the statistical technique of logistic regression. This technique involved the
estimation of a number of two-category (binary) outcomes at age 30, such as ’in full-time employment at age 30’ / ’not in full-full-time employment at age 30’ first in terms of the four combined numeracy and literacy groups. We then took the analysis a step further and estimated the same binary outcomes at age 30 for the four combined numeracy and literacy groups plus a three-category highest qualification achieved measure.
The results are reported as relative odds or odds ratios for each of the three poor skilled numeracy and literacy groups compared with the odds ratio for the
competent numeracy and literacy group, defined as the ‘reference’ category, which in this analysis is set at 1. Odds ratios greater than 1 signify a positive relationship between poor skills and the outcome and odds ratios less than 1 a negative relationship. Thus for the prediction of being in full-time employment status at age 30, we might expect the category ‘poor numeracy and poor literacy’ to have an odds ratio substantially lower than 1. If an odds ratio of 0.25 for being in full-time employment was found for men in the ‘poor numeracy and poor literacy’ group it would mean that their chances of being in this status compared with the chances of not being in it were one quarter of those for the men in the ‘competent numeracy and competent literacy’ group. To assess the statistical significance of the difference between a given odds ratio and 1, two levels of statistical significance are reported: p<.01, p<.05. P<.10 is also reported to indicate the presence of a difference that just fell short of attaining statistical significance19.
In total the impact of numeracy and literacy was modelled on 15 outcomes in adulthood for men and 18 outcomes in adulthood for women. Table A1 lists the outcomes and the distribution of the overall samples of men and women separately across the two categories of each outcome. Tables A2 (a) and (b) give, for men and women respectively, the odds ratios obtained for membership of each of the four categories of the numeracy and literacy typology with and without inclusion in the analysis of the highest qualification control.
Appendix
Logistic regression
Table A1. Information on each adult outcome CM = Cohort member
Variable information Values Distribution
Men Women
Employment status at 30
In full-time employment at 30
Whether CM was in full-time employment at 30 0=other status 9.7% 59.9%
1=in full-time employment 90.3% 40.1%
In full- or part-time employment at 30
Whether CM was in full- or part-time employment at 30 0=other status 31.9%
1=in full-time or part-time employment 68.1%
In full-time home-care position at 30
Whether CM was in full-time home-care position at 30 0=other status 75.8%
1=in full-time home-care position 24.2%
Unemployed at 30
Whether CM was unemployed at 30 0=other status 96.9%
1=unemployed 3.1%
In semi-skilled or unskilled work at 30
CM in semi-skilled or unskilled manual work at 30 0=non-manual or skilled manual job 85.0% 83.5%
1=semi-skilled or unskilled job 15.0% 16.5%
Employment-related experiences
Work-related training1
CM asked if they had any work–related training in job at 30 0=not received work-related training 43.9% 72.6%
1=received work-related training 56.1% 27.4%
Promotion opportunities1
CM asked if they had any opportunity for promotion in job at 30 0=no promotion opportunities 63.9% 56.1%
1=promotion opportunities 36.1% 43.9%
Computer at work1
CM asked if they used a computer at work 0=no 52.5%
1=yes 47.5%
Current employer offers…1
Paternity leave 0=no paternity leave 68.5%
1=paternity leave 31.5%
Maternity leave 0=no maternity leave 69.4%
1=maternity leave 30.6%
Table A1. Information on each adult outcome contd. CM = Cohort member
Variable information Values Distribution
Men Women
Employment-related experiences continued
Current employer offers
Company shares1 0=no shares 76.9% 78.8%
1=shares 23.1% 21.2%
Company pension1 0=no company pension 44.3%
1=pension 55.7%
Other economic outcomes
Home owner
CM asked if they owned or rented their home or had 0=rents, other arrangement 34.3% 35.4%
some other arrangement 1=home owner 65.7% 64.6%
Non-working household
Information derived from the employment status of CM 0=CM and/or partner in paid work 94.8% 86.8%
and their partner (if any) at age 30 1= CM and partner (if one) not in paid work 5.2% 13.2%
Social participation
Voting
CM asked if they had voted in 1997 General Election 0=voted 59.0%
1=did not vote 41.0%
Political interest
CM asked if they were ‘very’, ‘fairly’, ‘not very’ or 0=very, fairly, not very interested in politics 70.8% 55.9%
‘not at all’ interested in politics 1=not at all interested in politics 29.2% 44.1%
Organisation membership
CM asked if they had ever been a member of any 0=never been a member 85.3%
organisation. This included political, charity/voluntary 1=member now/at some time previously 14.7%
group, women’s groups, townswomen’s guild/WI,
parent/school organisations, tenants/residents associations
Arrested
CM asked if they ever been arrested and taken to a 0=never arrested 69.7%
police station 1=arrested 30.3%
Table A1. Information on each adult outcome contd. CM = Cohort member
Variable information Values Distribution
Men Women
Health + well-being
General health poor at 30
CM reported if they had been in excellent, competent, fair 0=excellent, competent, fair 91.0%
or poor health in the 12 months prior to interview 1=poor 9.0%
Depressed at 30
CM had their psychological well-being assessed by use of 0=competent 87.1% 83.5%
the Malaise Inventory (Rutter et al., 1970). 24 yes/no 1=depressed 12.9% 16.5%
questions elicited whether feelings of depression were
currently being experienced. A ‘depressed’ score is
assigned if ‘yes’ is answered to 8 or more questions
Lack of control
Does CM feel they have control over what happens to them? 0=I usually have free choice
CM had to choose which statement comes closest to and control over my life 91.3% 90.2%
their own view 1=whatever I do has no real effect 8.7% 9.8%
on what happens to me
Dissatisfaction with life
Does CM get what they want out of life? CM had to choose 0=I usually get what I want out of life 79.3%
which statement comes closest to their own view 1=I never really get what I want out of life 20.7%
Problems in life
Can CM run life as they want to? CM had to choose which 0=usually I can run my life more or less
statement comes closest to their own view as I want to 93.2%
1=I usually find life’s problems just too 6.8%
much for me
n(100%) 383 401
1
indicates reduced sample of CMs currently in work at time of interview. Overall reduced sample = 307 (men), 255 (women).