Theses
4-2019
Improving Developer Profiling and Ranking to
Enhance Bug Report Assignment
Andrew DiStasi
Follow this and additional works at:https://scholarworks.rit.edu/theses
This Thesis is brought to you for free and open access by RIT Scholar Works. It has been accepted for inclusion in Theses by an authorized administrator of RIT Scholar Works. For more information, please [email protected].
Recommended Citation
Ranking to Enhance Bug Report
Assignment
by
Andrew DiStasi
A Thesis Submitted in Partial Fulfillment of the
Requirements for the Degree of
Master of Science in Software Engineering
Supervised by
Dr. Mohamed Wiem Mkaouer
Department of Software Engineering
B. Thomas Golisano College of Computing and Information Sciences
Rochester Institute of Technology
Rochester, New York
The thesis “Improving Developer Profiling and Ranking to Enhance Bug Report
As-signment” by Andrew DiStasi has been examined and approved by the following
Exami-nation Committee:
Dr. Mohamed Wiem Mkaouer Assistant Professor, RIT Thesis Committee Chair
Dr. Christian Newman Assistant Professor, RIT
Dr. Pradeep Murukannaiah Assistant Professor, RIT
Dr. Xin Ye
Assistant Professor, CSUSM
Dr. J. Scott Hawker Associate Professor
Dedication
To my family who supported me, my teachers who instilled an early love of learning in
Acknowledgments
There are many people who have played a role in helping and supporting me through both
my entire RIT Career and my Masters studies. First, I’d like to thank my advisor, Dr.
Mohamed Wiem Mkaouer for introducing me to the topic of bug triage, as well as all his
encouragement, advice, and guidance throughout the work on my thesis. Additionally, I’d
like to thank all of the RIT faculty and staff, both in the Software Engineering and
Information Sciences and Technologies departments, who have provided support during
my time at RIT.
Next, I’d like to thank my father, Dr. Vincent DiStasi, for sparking my interest in
technology, for his never-ending support, and for making the completion of this research
possible with his generous gift of (many) virtual servers to run my code in a timely
manner. I’d also like to thank my mother, Kathleen DiStasi, and the rest of my family for
their unwavering love and support - this work would not have been possible without them.
Finally, I’d like to thank the RIT Honors Program for being my ”college family” and such
a critical part of what has made my 7 years at RIT so memorable. In particular, I am
incredibly grateful to Kerrie Bondi and Rebecca Jasen for their endless support and
guidance. I am grateful to everyone that has supported me during this journey and express
Abstract
Improving Developer Profiling and Ranking to Enhance Bug Report
Assignment
Andrew DiStasi
Supervising Professor: Dr. Mohamed Wiem Mkaouer
Bug assignment plays a critical role in the bug fixing process. However, bug assignment
can be a burden for projects receiving a large number of bug reports. If a bug is assigned to
a developer who lacks sufficient expertise to appropriately address it, the software project
can be adversely impacted in terms of quality, developer hours, and aggregate cost. An
automated strategy that provides a list of developers ranked by suitability based on their
de-velopment history and the dede-velopment history of the project can help teams more quickly
and more accurately identify the appropriate developer for a bug report, potentially
result-ing in an increase in productivity. To automate the process of assignresult-ing bug reports to
the appropriate developer, several studies have employed an approach that combines
nat-ural language processing and information retrieval techniques to extract two categories of
features: one targeting developers who have fixed similar bugs before and one targeting
developers who have worked on source files similar to the description of the bug. As
de-velopers document their changes through their commit messages it represents another rich
resource for profiling their expertise, as the language used in commit messages typically
more closely matches the language used in bug reports. In this study, we have replicated
developers for each bug report. Additionally, we have extended the study by proposing an
additional set of features to better profile a developer through their commit logs and through
the API project descriptions referenced in their code changes. Furthermore, we explore the
appropriateness of a joint recommendation approach employing a learning-to-rank
tech-nique and an ordinal regression techtech-nique. To evaluate our model, we have considered
more than 10,000 bug reports with their appropriate assignees. The experimental results
demonstrate the efficiency of our model in comparison with the state-of-the-art methods in
Contents
Dedication. . . iii
Acknowledgments . . . iv
Abstract . . . v
1 Introduction. . . 1
2 Background . . . 4
2.1 Bug Lifecycle Overview . . . 4
2.2 Version Control Overview . . . 7
2.3 Project API Documentation Overview . . . 8
3 Related Work . . . 9
4 Problem Statement . . . 13
5 Feature Engineering . . . 15
5.1 Feature Use Overview . . . 15
5.2 Text Preprocessing . . . 16
5.3 Text Comparison Algorithm . . . 17
5.4 Feature Extraction . . . 18
5.4.1 Activity-Based Features . . . 19
5.4.2 Location-Based Features . . . 23
5.4.3 Developer Profile-Based Features . . . 25
5.5 Feature Scaling . . . 27
6 Feature Combination . . . 28
6.1 Naive Aggregation . . . 28
6.2 Learning to Rank . . . 29
6.4 Joint Recommendation . . . 30
7 Experimental Methodology . . . 31
7.1 Research Questions . . . 31
7.2 Data Collection and Filtration . . . 32
7.3 Projects Used . . . 33
7.4 Database Structure . . . 34
7.5 Linking Heuristic . . . 35
7.6 Experiment Setup and Evaluation Metrics . . . 36
8 Experimental Results and Evaluation . . . 38
8.1 Feature Set Accuracy Evaluation . . . 38
8.2 Feature Combination Accuracy Evaluation . . . 42
8.3 Joint-Recommendation Accuracy Evaluation . . . 46
8.4 Evaluation of Feature Importance . . . 47
8.5 Training Size Impact Evaluation . . . 48
9 Threats to Validity and Future Work . . . 50
9.1 Threats to Validity . . . 50
9.2 Future Work . . . 51
10 Conclusion . . . 54
Bibliography . . . 55
A RQ1 Full Comparisons . . . 62
List of Tables
3.1 Feature Types Considered in Related Works . . . 9
5.1 Features used in the Ranking Model . . . 18
7.1 Subject Projects Considered for Evaluation. . . 33
8.1 Top-5 Weighted Features for each project . . . 48
List of Figures
2.1 Bug Report #384108 from Eclipse Platform UI as reported in BugZilla. . . 5
2.2 Lifecycle of a Bug . . . 6
5.1 Approach Overview. . . 15
5.2 Bug Report #384056 from Eclipse UI. . . 26
8.1 Accuracy Comparison Between Features for AspectJ . . . 40
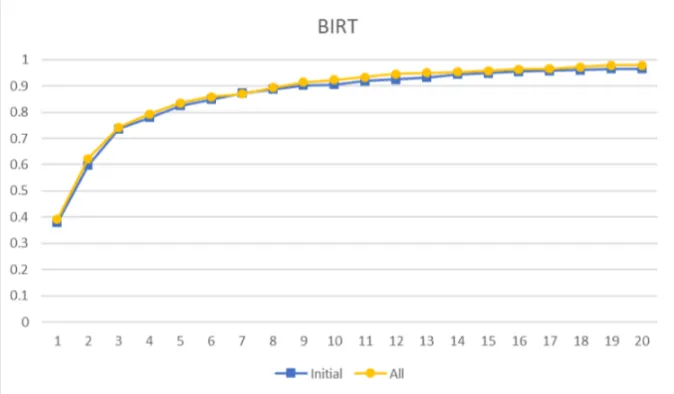
8.2 Accuracy Comparison Between Features for BIRT . . . 40
8.3 Accuracy Comparison Between Features for Eclipse Platform UI . . . 41
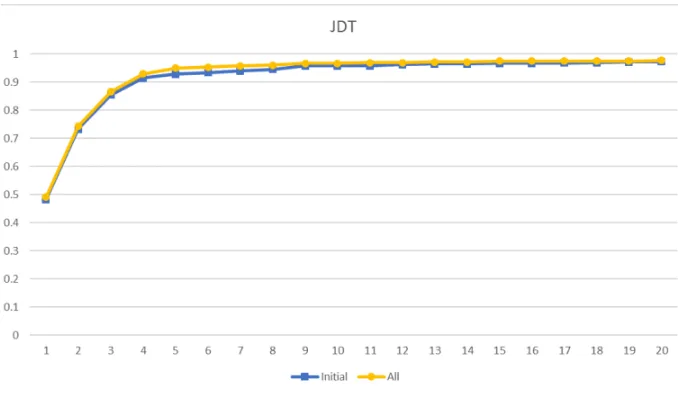
8.4 Accuracy Comparison Between Features for JDT . . . 41
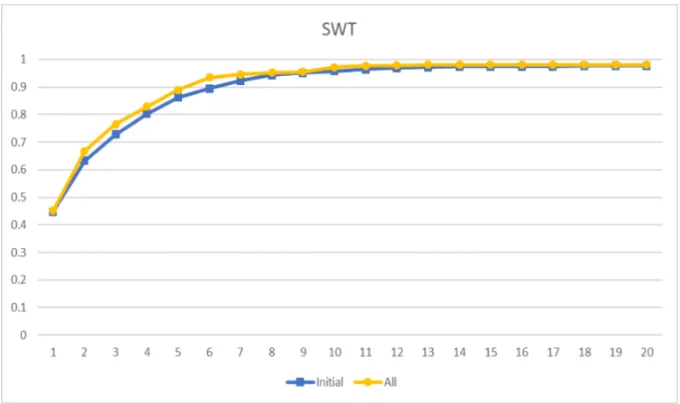
8.5 Accuracy Comparison Between Features for SWT . . . 42
8.6 Accuracy Comparison Between Features for Tomcat . . . 42
8.7 Accuracy Comparison Across Feature Combination for AspectJ . . . 44
8.8 Accuracy Comparison Across Feature Combination for BIRT . . . 44
8.9 Accuracy Comparison Across Feature Combination for Eclipse . . . 45
8.10 Accuracy Comparison Across Feature Combination for JDT . . . 45
8.11 Accuracy Comparison Across Feature Combination for SWT . . . 46
8.12 Accuracy Comparison Across Feature Combination for Tomcat . . . 46
8.13 Top-K Accuracy with Varied Training Data Sizes . . . 49
A.1 Accuracy Comparison Between All Features for AspectJ . . . 62
A.2 Accuracy Comparison Between All Features for BIRT . . . 63
A.3 Accuracy Comparison Between All Features for Eclipse Platform UI . . . . 63
A.4 Accuracy Comparison Between All Features for JDT . . . 64
A.5 Accuracy Comparison Between All Features for SWT . . . 64
Chapter 1
Introduction
Bug report assignment, the art of matching an open bug report to the developer best suited
to process it, is a critical step towards localizing and fixing a bug. Bug assignees typically
perform a variety of code reviews and changes to replicate the bug and verify the reported
issue with the purpose of localizing it. With the explosion of the number of open bug reports
and the natural increase in the number of teams and developers, matching bug reports to
suitable developers has become challenging, especially because an incorrect assignment
not only incurs a waste of a developer’s time, but also adds the overhead of re-assigning
the bug again. Compounding this problem is the rate at which bugs are reported. In 2013
alone, 3,389 bug reports were created for the Eclipse Platform product [40].
To cope with this expense, several studies have explored the design of automated
tech-niques to recommend which developer should be processing a given bug report by mining
and combining relevant information related to bug reports and the history of code changes
[11], [12], [20]. Previous studies were clustered by Shokripour [28] according to the
na-ture of information retrieved. Studies analyzing a developer’s activities and experience are
considered activity-based, while studies linking bug reports to a specific location in the
code, and so to a potential developer, are considered location-based. A recent study by
Tian et al. [32] presented a unified model that merges these activity-based and
location-based features to benefit from their advantages, at the expense of increasing complexity
through their combination. This approach utilizes a learning-to-rank algorithm for feature
combination to generate a final ranking score. Another recent study by Lam et al. [16]
in a joint recommendation approach to combine activity-based and location-based features
for the purpose of localizing bugs in the source code. Since learning-to-rank has shown
promising results in comparison with state-of-the-art approaches for both bug localization
and bug assignment [32], [41], and since a joint-recommendation approach outperformed
learning-to-rank for the problem of bug localization at low k-values [16], a study
apply-ing these considerations to the problem of automated bug assignment could offer valuable
insight and significant improvement over existing approaches.
In an effort to more completely profile the developers working on a project, we
con-sider additional activity-based features. Activity-based features heavily rely on profiling
developers using their contributions to the project in terms of code changes and previously
handled bug reports. As the majority of developers’ contributions are represented by their
code changes, and as code changes represent the largest source of bugs, linking developers’
code changes to the open bug reports has been proven to be a critical feature to improve the
bug assignment process [1]. However, bug report descriptions are written in natural
lan-guage, while the source code is represented by some programming language. As these two
languages differ in context, representation and expression, this creates a lexical mismatch,
hindering the efficiency of existing bug assignment approaches. Furthermore, developer
commit messages for bug fixing activity have been used as a feature with positive results
when addressing the problem of bug localization [26] [33], [37]. Therefore, we propose
the use of developers commit messages as a new set of features for the problem of bug
assignment. As shown in Chapter 5, commit messages are able to bridge the lexical gap as
they are written using the same natural language of bug reports, besides containing valuable
information that may not be captured by commit code changes.
To summarize, our key contributions are:
1. We reproduce the study of Tian et al. [32]. and perform a comparative study between
this approach and an approach that encompasses an increased set of developer
fea-tures. We also perform a comparative study between several ranking algorithms to
2. We enrich activity-based features by using the information extracted from commit
messages, as well as the Project API descriptions related to code developers have
interacted with, as part of the domain knowledge that can be used to better profile
developers for the purpose of bridging the lexical gap to enhance automated
assign-ment for open bug reports.
3. We explore a joint recommendation technique combining Ordinal Regression and
Learning to Rank in an effort to increase the accuracy of these ranking algorithms at
low k-values.
The rest of this paper is organized as follows. Chapter 2 describes key information
about the bug lifecycle, projects used, linking heuristics employed, and other import
back-ground knowledge to better understand this paper. Chapter 3 discusses related studies that
have motivated our study. Chapter 4 formally describes our problem statement. Chapter
5 reviews the process in which we prepare our textual data as well as how we
mathemati-cally define and calculate our feature scores. Next, we examine the four methods of feature
combination used in Chapter 6. We review our experimental setup, research questions, and
evaluation metrics in Chapter 7. We then discuss our empirical evaluation and findings in
Chapter 8. We examine threats to the validity of the study and motivate future work in
Chapter 2
Background
In this chapter we review key information about software bugs, the bug lifecycle, and other
information central to a thorough understanding of the problem space.
2.1
Bug Lifecycle Overview
Bruegge and Dutoit, in their textbookObject-Oriented Software Engineering Using UML,
Patterns, and Java, define a software bug or defect as ”a coding mistake that may cause
an unintended or unexpected behavior of the software component” [3]. Bugs can be
unin-tentionally introduced into a project for a variety of reasons, including project deadlines,
lack of communication, simple programming errors, unclear requirements, and many
oth-ers. One of the ways in which developers manage and track bugs is through the use of Issue
Tracking Systems (ITS) such as BugZilla, Mantis, and JIRA. For the purposes of this study,
we consider BugZilla to be our defining example of an ITS. BugZilla is a free and open
source web-based bug tracking software available for most operating systems that has been
utilized by thousands of projects and companies around the world, both as an
out-of-the-box solution and as the framework for a personalized bug repository. It allows developers
to track outstanding bugs, problems, issues, and change requests for many different types
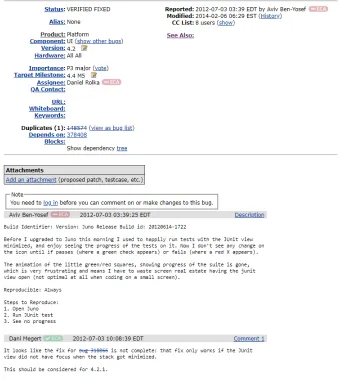
of software products. Figure 2.1 shows a bug report from the Eclipse Platform UI project
that is being managed through BugZilla. In this view, we can see critical information
re-garding the bug’s description, as well as when it was reported, its importance, and who is
Figure 2.1: Bug Report #384108 from Eclipse Platform UI as reported in BugZilla.
To better define and model the passage of a bug and its corresponding bug report
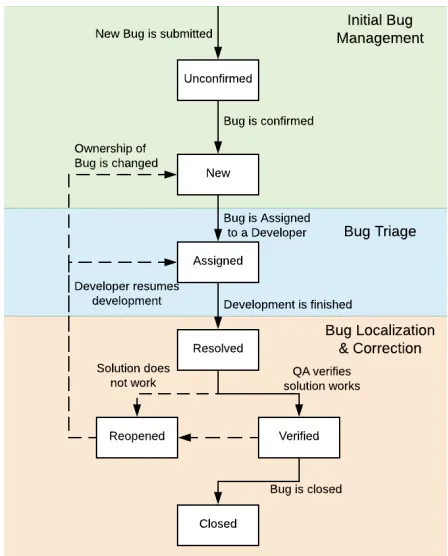
through the different stages of being identified and corrected, a bug lifecycle, with
dif-ferent states and transitions, serves as a guideline to a project team working to correct these
bugs [8]. The bug lifecycle tracks the progress of the bug through several steps across three
broad phases: Initial Bug Management, Bug Triage, and Bug Localization and Correction.
The default bug lifecycle model used by BugZilla sees the bug begin as an unconfirmed bug
report. If a developer can confirm the bug’s existence or if the bug receives enough public
Figure 2.2: Lifecycle of a Bug
faulty code and submits their updates for testing. If the tests pass verification, the bug is
marked as closed. If they fail the testing phase, the bug is reopened and the developer will
repeat the bug fixing process. This process is represented in figure 2.2
Bug Localization is a software maintenance task in which a developer uses information
from the bug report to identify and locate some section of the source code that is responsible
for the generation of the bug. When approaching this as an Information Retrieval problem,
we can consider extracted information from the bug report to be a query and the software
project to be a problem space that contains the desired search result [21]. Likewise, Bug
Triage is a software maintenance task where a bug report is assigned to a relevant developer
who is suited to fix the bug. In traditional bug repositories, these bugs are manually triaged
by a specialized developer or project manager. When approaching this as an Information
Retrieval problem, we can consider extracted information from the bug report to be a query
project to be the problem space that contains the desired search result [39].
2.2
Version Control Overview
A version control system enables multiple developers to work simultaneously on a single
project. Each developer maintains their own copy of the files, and can make changes to
these local files at their discretion. In this form, these changes do not affect the version
of the code used for production (e.g. the code end users of the system interact with), nor
do they impact the code that other developers are working with. When developers choose
to share their changes with other members of their team, they ”commit” their code to a
centralized repository that other members of the development team have access to, along
with a descriptive message summarizing any changes they have made. These changes can
then be downloaded by other developers for incorporation into their local copy.
Addition-ally, these changes can be added to the production version of the code, meaning that the
developer’s changes are now available to end users.
Version Control also enables multiple developers to simultaneously work on the same
file. If different team members edit and commit different lines within the same file, the
version control system will automatically integrate the most recent updates by each
devel-oper into that file in the centralized repository. In the event that users edit the same line and
the updates are conflicting (e.g. each commit would overwrite changes made by the other),
the system requests human assistance in reconciling the differences. Finally, the version
control system maintains a log of changes and historical versions of a project. All changes
made to the centralized repository, as well as the resultant state of the project, are saved
and accessible at any time. Furthermore, these saved changes relay information about who
edited a file, when they edited the file, and why they edited the file (per their descriptive
2.3
Project API Documentation Overview
Application Programming Interface (API) Documentation is a set of technically written
de-scriptions and instructions containing information about a given project. These documents
detail information about functions, classes, return types, arguments, and other code tokens
present in a project. This documentation, while technical in nature, is generally written in
a natural language, such as English, and is designed to be human-readable, with the aim of
empowering developers to better understand and utilize the project. Providing appropriate
documentation is commonly considered a best practice for software engineering and can
Chapter 3
Related Work
In this chapter, we highlight several approaches on bug triage and localization that
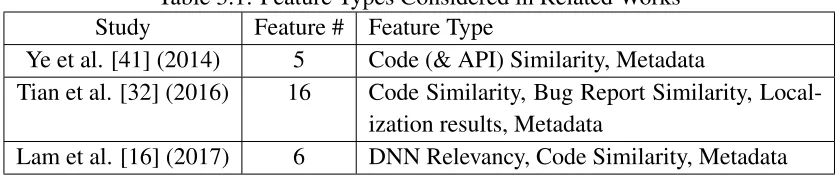
pro-foundly influenced our approach. We have identified three previous studies as particularly
relevant in guiding the direction of our approach. Tian et al. [32] and Ye et al. [41] offer
exploratory studies into recommending developers to be assigned to a bug report. Lam et
al. [16] introduce the use of Deep Learning in combination with Information Retrieval (IR)
techniques to improve the accuracy of Bug Localization activities. A summary of each
[image:20.612.100.520.426.515.2]study is shown in Table 3.1.
Table 3.1: Feature Types Considered in Related Works
Study Feature # Feature Type
Ye et al. [41] (2014) 5 Code (& API) Similarity, Metadata
Tian et al. [32] (2016) 16 Code Similarity, Bug Report Similarity,
Local-ization results, Metadata
Lam et al. [16] (2017) 6 DNN Relevancy, Code Similarity, Metadata
Ye et al. [41] implement an IR approach for bug localization that uses adaptive learning
to derive weighted features based on the source files, bug history, and API descriptions.
Using a learning to rank approach, the authors combine features to generate a list of scores
indicating the likelihood that the code responsible for the bug exists in the given file. They
employ a Vector Space Model and Cosine Similarity for ranking measures of textual
sim-ilarity, extracting features similar to those used in this study. They calculate the similarity
file enriched with API specifications for the classes and interfaces. The inclusion of
API-enriched source code better allows the study to bridge the lexical gap, by annotating the
source code (written in a programming language) with API descriptions written in natural
language. The inclusion of natural language-based annotations allows for a more effective
cosine similarity comparison between the annotated source code and the natural language
text found in the bug report. They also implement four metadata features about the bug
fixing history of the project. First, a collaborative filtering score that measures the textual
similarity of a bug report to previous bug reports that have resulted in changes to a given
file. Next, the similarity of class names mentioned in the bug report to class names in the
source code file. Finally, the Bug Fixing Recency and Frequency for a file, measuring how
recently (in months) a file has been changed and how many times within the last year a file
has been changed as a result of bug fixing activity.
The model used in [41] is evaluated on the same dataset as used in this study. They
compare their novel approach against four baselines: a standard VSM method based solely
on textual similarity between bug reports and source code, theUsual Suspectsmethod that
recommends the top k most frequently fixed files [15], the BugLocator ranking tool [23],
and the BugScout classifier tool [42]. They offer an empirical evaluation of their classifier
as compared to these methods, as well as explore issues of future utility, training size and
fold count impact, and runtime performance. Specifically, Ye et al. identify that as long as
the most recent data was included in the training set, a larger training set did not have any
positive impact on the accuracy of the classifier.
Tian et al. [32] introduce the current state-of-the-art approach for generating bug
re-port assignee recommendations. They offer a novel unified learning to rank approach that
leverages information from both developer activities and bug localization to capture 16
fea-tures representing a developer’s suitability to fix a bug identified in a bug report. They then
evaluate their results on over 11,000 bugs across three open source projects. Their assignee
recommendation features are split into two domains: activity-based features and
generates a ranked list of the most suited developers to solve a bug report. They focus
on evaluating their approach against existing activity-based [1], and location-based [29]
approaches.
Activity-based approaches recommend a developer for a particular bug report based on
how closely the developer’s expertise aligns with the information identified in the report.
We infer the developer’s expertise based on previous developer activities within the project
[1], [31]. Activity-based approaches consider information revolving around source code
previously altered by the developer and bug reports previously completed by the developer.
While mining this information offers valuable insight into the suitability of a developer to
address a bug report, it fails to consider information linking a bug report to specific source
code files [32]. Location-based approaches focus on identifying which source code file is
most similar to the bug report and then inferring which developer is best suited to alter that
source code file [28], [20], [11]. This approach relies on the completion of bug
localiza-tion to match an incoming bug report to several potential buggy localocaliza-tions and assumes that
developers who have recently touched or modified that code have substantial expertise in
addressing that bug [32]. This approach more completely considers information
correlat-ing source code files and bug reports, but is heavily reliant on the implementation of an
underlying localization technique and does not fully consider developer expertise based on
the topic of the bug report [32].
Tian et al. created disjoint test and training sets out of 10 equally sized folds of bug
reports (sorted temporally, with the oldest reports first) for each project. The ranking model
was trained on the five folds prior to a test fold, and then evaluated on a test fold to generate
a top-k ranking of developer recommendations. Results showed that their unified approach
consistently outperformed the existing activity-based and location-based baselines. For
top-1 accuracy, their model outperformed the activity-based baseline by 50.0% - 100.0%
and location-based baseline by 11.1% - 27.0%. The average weight of each feature returned
by the rankSVM tool was used to approximate the relative importance of each feature.
data is viable as explored in [41].
Lam et al. [16] implemented a joint-recommendation method employing a Deep Neural
Network (DNN) along with a revised Vector Space Model (rVSM), a form of Information
Retrieval (IR), to bridge the lexical gap and more accurately recommend files as potential
locations for bugs, especially at lower k-values. Their approach,DNNLOC, extracts textual
data from bug report and source code pairings, using the same features as [41]. They also
add a DNN-based relevancy score that learns to semantically relate terms in a bug report
and code or comment text without a reliance on measures of textual similarity, computing
how semantically and contextually relevant a source code file might be to a bug report.
Once a vector of features has been built, the features are fed through a separate
multi-layered Deep Neural Network to generate a single combined score that can be used to
rank the candidate source files in order of likelihood that they contain the relevant buggy
code. This approach was evaluated against the same dataset used by [41] and this paper.
Their results indicated a universally higher accuracy at all k-values between 1 - 20 than all
previously identified approaches, including [1], [15], [29], [41], and [42].
They also explore the impact of various components and parameters on the overall
ac-curacy of the application. Varying the size of the DNN Relevancy Estimator showed that a
hidden layer with over 1,000 nodes contributed to a higher and more stable accuracy.
Ad-ditionally, they explored the effects of training data size on the accuracy of the application.
The training dataset was split into 10 equally sized folds, with fold10containing the most
recent bug reports that were used for testing. Initially, only fold9 was used for training,
with an additional fold being added to the training set for each test. This study revealed
that increasing the size of the training set offered no benefit to the accuracy of the model,
Chapter 4
Problem Statement
As software programs become more pervasive and ubiquitous, the reliability requirements
imposed upon a software system grow increasingly stringent. Continuous systems mandate
a high percentage of system uptime, necessitating systems that can continue to function in
the face of hardware or software errors as well as necessitating constant monitoring, rapid
debugging, and potentially live patching. Even more dangerous are undetected bugs that
incorrectly alter the results of a system. Historically, the use of incorrect results caused by
undetected bugs has led to catastrophes in mission-critical [5] and safety-critical systems
[18].
In any software project of sufficient size and complexity, bugs are inevitable. Project
deadlines, ignorance of best coding practices, and developer turnover can all increase the
likelihood that a bug is created. Furthermore, software documentation is frequently
incom-plete or out of date, as systems can be complex structures assembled by different
compo-nents, and projects can grow so large or complex that any one developer rarely has
knowl-edge of the entire system [9]. As a result, software development teams can be required
to spend a great deal of time and effort fixing bugs. Hill et al. report that a large
major-ity of software cost comes exclusively from activities related to the evolution and system
maintenance of existing source code [10]. Specifically, the process of identifying,
localiz-ing, and correcting software defects is an expensive, time consumlocaliz-ing, and labor-intensive
task. Bug Localization and Bug Triage are two critical components of this process, but
are themselves manual, labor intensive, and require a great deal of expertise with regards
bug reports submitted during the development lifecycle of a project can make efficiently
locating, assigning, and addressing these bugs even more difficult.
In order to lessen the cost of these processes and reduce human debugging time,
sev-eral studies have attempted to automate bug triage and localization [16], [32], [40], [41].
However, these studies have historically lacked the accuracy necessary for wide-spread
commercial adoption. Adapting these existing approaches to more completely consider the
information available to connect a bug report and the developer most suited to address it,
as well as exploring recommendation techniques to increase accuracy at lower k-values,
offers the potential to improve the accuracy and usability of the approach to a satisfactory
Chapter 5
Feature Engineering
In this chapter, the preprocessing and feature extraction approach is detailed. First, we
introduce our overall approach to generating developer rankings. We then review all
pre-processing work performed on the text and explore the text comparison algorithm used,
before introducing all features used to connect a developer with a bug report and the
man-ner in which we normalize variance in data ranges.
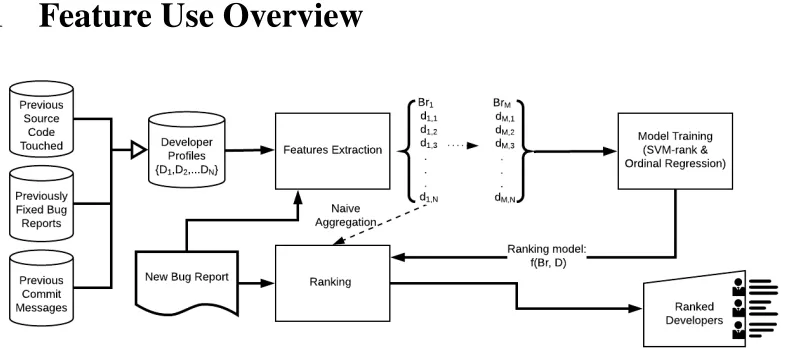
[image:26.612.113.507.379.560.2]5.1
Feature Use Overview
Figure 5.1: Approach Overview.
Figure 5.1 provides an overview of the process used to create our ranking models and
generate a ranked list of developers for a given bug report. In this process, a set of developer
profiles, composed of previous source code touched, previously fixed bug reports,
previ-ous commit messages, and other bug fixing metadata, are created and mined to generate
on a bug report. For the learning-to-rank, ordinal regression, and joint-recommendation
approaches described in Chapter 6, feature scores are extracted from each historical Bug
Report-Developer Profile pairing and used to train the ranking model (this training does
not occur in the Naive Aggregation approach). When a new Bug Report enters the system,
its feature data is extracted and is ranked either by the trained ranking model or via naive
aggregation. This creates a list of developers ranked in order of suitability to work on that
bug report. The remainder of this chapter will describe the manner in which we extract
information from the project materials to create developer profiles and how we
mathemat-ically define the features used in our ranking models. Chapter 6 describes the methods in
which we combine these features to create and train the models used to generate rankings
for each developer.
5.2
Text Preprocessing
Before feature extraction, all textual data was preprocessed using standard steps to
tok-enize, cast to lowercase, remove stop words from, and stem the input. Tokenizing is the
process of parsing natural text data into tokens - a series of delimited strings that contain no
white spaces, punctuation marks, and other non-alphanumeric characters. Casting the text
to lowercase allows for more effective comparison of text by removing any case-specific
considerations. Stop Words are a set of commonly used words that have no value in IR or
search queries. Most search engines, for example, are programmed to ignore such words.
We employed the Python NLTK standard English stopword list, which includes common
pronouns such as ”I”, ”our”, and ”their”, as well as other non-descriptive words such as
”are”, ”these”, and ”the.” Stemming is the process of reducing inflected or derived words
to their base form. As an example, both ”fixed” and ”fixing” can be stemmed to ”fix.” The
standard Porter stemming algorithm [14] in Python’s NLTK package was used to perform
this process.
Additionally, code entities in the Bug Report text that were written in camel case were
tokenized, cast to lowercase, and stemmed, or discarded if they were present in the list of
stop words. These tokens were appended to the end of the bug report description. For
example, the code token ValuePropertyDetailMapwould be split into ”value”, ”property”,
detail”, and ”map” (which are each then stemmed and appended). The initial token is not
removed from the bug report. This allows the text comparison algorithm detailed in section
5.3 to recognize components within similar code tokens that are not expressed in natural
language.
5.3
Text Comparison Algorithm
In order to numerically measure the similarity between two text documents, we must
con-sider the cosine similarity score. This study utilizes the same cosine similarity metric as
defined in [32]. The similarity between a given bug report, Br, and a given developer,D,
(i.e. φ(Br,D)) is calculated through a series of cosine similarity comparisons between two documents - Cosine(f1, f2), wheref1 and f2 are both text-based files. These files could
include bug reports, source code, or commit messages. This function transforms each
doc-ument into a vector of weight, where each word is an element of the vector. We calculate the
weight of a word using TF-IDF, or term frequency-inverse document frequency, a common
method of assigning weights in IR [22]. TF-IDF essentially measures how ”important” a
word is to a given document and is computed as:
wterm,doc=T Fterm,doc×IDFterm (5.1) In this equation, theTerm Frequency, the number of times the term appears in the
doc-ument, is multiplied by the inverse of the Document Frequency, the number of documents
that contain the term. We then use the weight vectors, w, of each document to compute
their cosine similarity:
Cosine(f1, f2) =
~ f1·f~2
||f~1|| ||f~2||
(5.2)
In this equation, f~1 andf~2 are the vectors obtained from each compared file, · is the
5.4
Feature Extraction
This section presents how features are extracted from the combination of source files, bug
reports and commit messages. Both activity-based and location-based features are used
based on Tian et al. [32] as discussed in section 3. However, we also include a comparison
based on the bug report and the developers’ previous commit messages to capture an added
dimension of developer suitability. See table 5.1 for a grouping and overview of all features
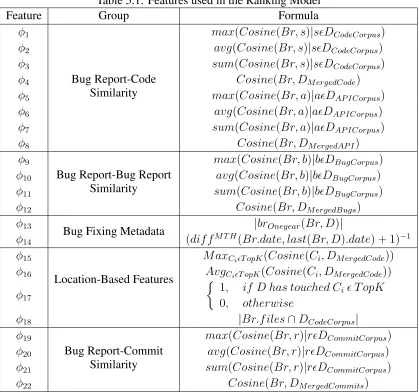
[image:29.612.101.520.294.686.2]used to generate bug report assignee recommendations.
Table 5.1: Features used in the Ranking Model
Feature Group Formula
φ1
Bug Report-Code Similarity
max(Cosine(Br, s)|sDCodeCorpus)
φ2 avg(Cosine(Br, s)|sDCodeCorpus)
φ3 sum(Cosine(Br, s)|sDCodeCorpus)
φ4 Cosine(Br, DM ergedCode)
φ5 max(Cosine(Br, a)|aDAP ICorpus)
φ6 avg(Cosine(Br, a)|aDAP ICorpus)
φ7 sum(Cosine(Br, a)|aDAP ICorpus)
φ8 Cosine(Br, DM ergedAP I)
φ9
Bug Report-Bug Report Similarity
max(Cosine(Br, b)|bDBugCorpus)
φ10 avg(Cosine(Br, b)|bDBugCorpus)
φ11 sum(Cosine(Br, b)|bDBugCorpus)
φ12 Cosine(Br, DM ergedBugs)
φ13
Bug Fixing Metadata |brOneyear(Br, D)|
φ14 (dif fM T H(Br.date, last(Br, D).date) + 1)−1
φ15
Location-Based Features
M axCiT opK(Cosine(Ci, DM ergedCode))
φ16 AvgCiT opK(Cosine(Ci, DM ergedCode))
φ17
1, if D has touched Ci T opK 0, otherwise
φ18 |Br.f iles∩DCodeCorpus|
φ19
Bug Report-Commit Similarity
max(Cosine(Br, r)|rDCommitCorpus)
φ20 avg(Cosine(Br, r)|rDCommitCorpus)
φ21 sum(Cosine(Br, r)|rDCommitCorpus)
5.4.1
Activity-Based Features
This subsection includes features that are calculated based on the bug fixing activities of
developers, including previously touched code and any relevant API descriptions, as well
as previously solved bug reports.
Bug Report-Code Similarity
Bug Report-Code Similarity refers to features that measure the similarity between a bug
report and code that a developer has interacted with in the past year. We limit the code
considered to the past year to compare the bug report to more relevant code changes from
the developer. Changes made by a developer over one year ago are likely to be far less
relevant to the developer’s expertise than more recent changes. Furthermore, if a developer
has not interacted with some file in over a year, it is likely that the source file may have been
significantly altered since the developer last interacted with it. If the bug report is similar
to code that the developer has interacted with, they are more likely to be familiar with
the programming terms and entities referenced in the bug report, as well as the code that
would require alterations to satisfy the bug report. For the purposes of this study, we define
developer interaction as any action resulting in that file’s inclusion in a commit, including
editing, addition, or deletion. For comparison, we aggregate the summary and description
into one document for each bug report,Br. The first four features are defined as follows:
φ1(Br, D) = max(Cosine(Br, s)|sDCodeCorpus)
φ2(Br, D) =avg(Cosine(Br, s)|sDCodeCorpus)
φ3(Br, D) =sum(Cosine(Br, s)|sDCodeCorpus)
φ4(Br, D) = Cosine(Br, DM ergedCode)
In the above equations,Bris the summary and description of the bug report. sis each source file withinDCodeCorpuswhereDCodeCorpusis the set of source code files in the project touched by the developer, D, during any development activity. Forφ1−3 we calculate the
values. To align the range of φ3 with the other features used in this study, we implement
feature scaling as detailed in section 5.5. Forφ4, we merge all touched source code for the
developer,D, into one document, DM ergedCode, and compute its cosine similarity withBr as a feature.
Bug Report-API Similarity
Bug Report-API Similarity refers to features that measure the similarity between a bug
report and the API documentation of classes and interfaces referenced in the source code
that a developer has interacted with in the past year. Typically, the majority of text in a
bug report is expressed in natural language (e.g., English), whereas most of the content in
source code files is expressed in a programming language (e.g., Java). Cosine similarity
functions only return non-zero values for tokens that are explicitly present in both
docu-ments, meaning that comparing two documents expressed in different forms or languages
may not result in a valuable feature. This challenge in comparing bug report text and source
code has been termed thelexical gap. In this scenario, bug reports and source code are only
considered capable of bridging the lexical gap when the source code is annotated with
ex-tensive, comprehensive comments or the bug report contains fragments of code matching
the source file, such as class names, method names, or a stack trace. However, ”in practice,
it is often the case that the bug report and a relevant buggy file share very few tokens, if
any” [40].
To help bridge the lexical gap, we consider a feature set that measures the similarity
between a bug report and the natural language-based API specifications of the classes and
interfaces used in the source code that a developer has interacted with in the past year.
For each source file, we extract references to classes and interfaces from ”import”
state-ments and in-line references. Using the project API specification, we extract the natural
the project. This technique has been previously employed in [41] to better connect bug
re-ports and source files to address the problem of bug localization. These features are defined
as follows:
φ5(Br, D) =max(Cosine(Br, a)|aDAP ICorpus)
φ6(Br, D) = avg(Cosine(Br, a)|aDAP ICorpus)
φ7(Br, D) = sum(Cosine(Br, a)|aDAP ICorpus)
φ8(Br, D) =Cosine(Br, DM ergedAP I)
In the above equations,Br andD are defined as previously described in Bug Report-Code Similarity. a is each set of API documentation for a source file within DAP ICorpus whereDAP ICorpusis the set of all API documentations for each source file touched by the developer with in the past year. To align the range of φ7 with the other features used in
this study, we implement feature scaling as detailed in Section 5.5. Forφ8, we merge all
referenced API documentation for the developer,D, into one document,DM ergedAP I, and compute its cosine similarity with Br as a feature. These features are calculated in the same manner asφ1−4.
Bug Report-Bug Report Similarity
Bug Report-Bug Report Similarity refers to features related to the similarity between a
given bug report and any bug reports that the developer has fixed prior to the bug report
being filed. Tokens appearing in bug reports that have been historically fixed by a developer
may offer insight into their areas of expertise. If the tokens in the current bug report are
similar to the historical tokens, the bug in question may fall within the developer’s areas of
expertise. These features are calculated in the same manner asφ1−8. Again, the summary
computation. These features are defined as follows:
φ9(Br, D) = max(Cosine(Br, b)|bDBugCorpus)
φ10(Br, D) = avg(Cosine(Br, b)|bDBugCorpus)
φ11(Br, D) =sum(Cosine(Br, b)|bDBugCorpus)
φ12(Br, D) =Cosine(Br, DM ergedBugs)
In the above equations,Br andD are the same as for Bug Report-Code Similarity. b
is each bug report withinDBugCorpuswhereDBugCorpusis the set of bug reports marked as ”RESOLVED FIXED”, ”VERIFIED FIXED”, or ”CLOSED FIXED” that list that
devel-oper as the author of the commit that resolved the bug report. To align the range ofφ11with
the other features used in this study, we implement feature scaling as detailed in Section
5.5. For φ12, we merge all previous bug reports for the developer,D, into one document,
DM ergedBugs, and compute its cosine similarity withBras a feature.
Bug Fixing Metadata
Bug Fixing Metadata refers to two features related to the bug fixing history of a project
- bug fixing frequency and bug fixing recency. Tian et al. assume that a developer that
has fixed a large number of bugs is typically knowledgeable about the project and could
potentially be more suitable for fixing a bug than a less experienced developer [32]. To
quantify this, we include bug fixing frequency as a feature that aggregates the count of
Bug Reports a developer has completed for a project over the past year. To align the range
of this feature with the other features used in this study, we implement feature scaling as
detailed in Section 5.5. This is defined below:
φ13(Br, D) = |brOneyear(Br, D)|
Similarly, a developer who has fixed bugs recently is also typically knowledgeable
about the current state of the project and could be more suited for fixing a bug than a
bug fixing frequency as a feature that calculates the inverse of the difference between the
dates of the given bug report and the developer’s most recently fixed bug report in months
(rounded down). In this equation we use an inverse to more harshly penalize developers
that have not interacted with the project in a longer span of time. This is defined below:
φ14(Br, D) = (dif fM T H(Br.date, last(Br, D).date) + 1)−1
5.4.2
Location-Based Features
This subsection includes features that are calculated based on the location of the code that
likely contains the bug identified in the bug report. To perform this bug localization process,
we use the learning to rank approach employed in [41]. While the DNN-based
localiza-tion approach used in [16] has offered higher accuracy in identifying potentially buggy
files, we elected to match the approach used in [32] to allow for a more valid comparison.
Implementing Lam et al.’s Localization approach has been left as a future work for this
study.
Potential Buggy Code-Related Code Similarity
To calculate these features, we perform bug localization to generate a list of the 10 source
code files that are most likely to contain code relevant to the submitted bug report. If the
developer has worked on the files where the bug is most likely to be or has worked on other
similar files, they may be well suited to addressing the bug. We then perform additional
cosine similarity calculations to identify the similarity between code the developer has
worked on within the past year and the likely buggy locations. These functions are defined
φ15(Br, D) =M AXCiT opK(Cosine(Ci, DM ergedCode))
φ16(Br, D) =AV GCiT opK(Cosine(Ci, DM ergedCode))
In the above equations,T opK is the top-k source code files identified by the bug lo-calization technique to be most likely to contain the code causing the bug described inBr. For this study, K is set to 10. Ci is each of the top-k most likely source files to contain the bug andDM ergedCodeis one document containing all touched source code for the developer within the past year. We compute the cosine similarity between each file from the
localiza-tion and the merged corpus of all code touched by a developer. We return the maximum
and average value as features.
Touched Potential Buggy Files
This feature is a simple indication of whether or not the developer has touched a file within
the top 10 files returned from bug localization used inφ15andφ16. The feature is defined
below:
φ17(Br, D) =
1, if developer D has touched Ci T opK 0, otherwise
Touched Mentioned Files
For some bug reports, developers include the names of some classes or files, either within
text or within the form of a stack trace. To capture this, we include the count of files
mentioned in the bug report that a developer has previously touched as a feature, defined
below:
In the above equation,Br.f iles is the set of source code file names appearing in the Bug Report, Br, andDCodeCorpus is the set of source code files touched by the developer,
Dto fix previous bugs. To align the range of this feature with the other features used in this study, we implement feature scaling as detailed in section 5.5.
5.4.3
Developer Profile-Based Features
This subsection introduces the rationale behind using commit messages as a potential
source of information for recommending developer assignment and then details how this
information is calculated and represented as features.
A typical bug report contains a mix of structured information, composed of a natural
language text describing the observed anomaly and potential code elements that are
in-volved, (e.g. method calls, identifiers, file names, and stack traces). As a bug-fixing commit
typically contains a similar description, relevant properties can be extracted to characterize
how the bug was processed. These properties may not necessarily be reflected in the source
code classes and methods being updated by the bug-fixing commit. To give an illustrative
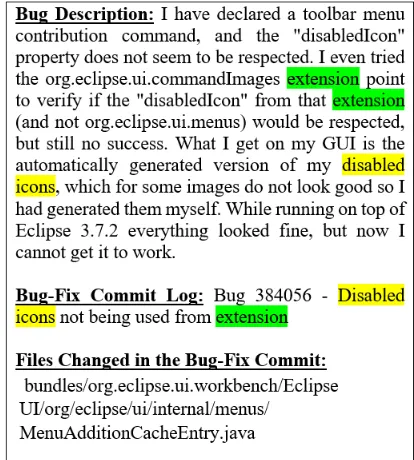
example, we consider the following bug report and its fixing-commit in Figure 5.2.
As shown in Figure 5.2, the developer describes the bug using natural language along
with mentioning classes and software versions. Various features correlate this bug report
to file changed in its fix-commit. However, in this example the changed class is only
in-novating the method with the violated property, and thus its similarity with the bug report
would be relatively low. Whereas, the examination of the commit message log reveals a
stronger connection between the bug report and the message’s description. For instance
both texts contain similar repeated keywords such asextensionanddisabled icons,
increas-ing their similarity, which enhances the effectiveness of any IR-based approaches [34], [36].
Therefore, we propose features capturing the similarity between bug reports and commit
Figure 5.2: Bug Report #384056 from Eclipse UI.
Bug Report-Commit Log Similarity
Version history and commit logs have frequently been used in development activity-related
data mining and several previous studies have used them in relating bug reports to
devel-opers [2], [30], [35], [38]. As stated above, a developer’s commit message text can offer a
brief summary of the code written or work performed. As a result, these logs can contain
text that may be valuable in matching developers with a bug report. To accommodate this
extra dimension of developer suitability, we have introduced four additional cosine
similar-ity features comparing a bug report with documents composed of the developer’s commit
messages. These features are calculated identically to φ1−4, φ5−8, and φ9−12, using the
commit logs associated with commits submitted by the developer prior to the creation of
the Bug Report as the document. To avoid falsely inflating similarity measures, any
refer-ences to the corrected bug in the commit text (e.g. ”Bug 384056” or ”Fix for Bug 384056”)
were stripped from the text prior to any comparison. Commits submitted without a
as follows:
φ19(Br, D) =max(Cosine(Br, r)|rDCommitCorpus)
φ20(Br, D) = avg(Cosine(Br, r)|rDCommitCorpus)
φ21(Br, D) = sum(Cosine(Br, r)|rDCommitCorpus)
φ22(Br, D) = Cosine(Br, DM ergedCommits)
In the above functions, the Cosine function, Br, and D are identical to φ1−12. r is
each commit message withinDCommitCorpuswhereDCommitCorpusis the set of version con-trol commit messages previously submitted by the developer during development activity.
DM ergedCommitscontains every prior commit message for that developer. The Cosine Sim-ilarities scores are computed in the same way as φ1−12. To align the range ofφ21 with the
other features used in this study, we implement feature scaling as detailed in section 5.5.
5.5
Feature Scaling
Features with a wide range of values can be detrimental when training machine learning
algorithms. Many algorithms tend to perform better when there is not a wide variation in
the range of values for a given feature and when most features have a similar range and
scale. Feature scaling normalizes all features to the same scale so that they become more
comparable with each other. For some feature φ, letφmin andφmax be the minimum and maximum observed values for that feature in the training dataset. A feature may also have
values present in the testing set that are larger than the observed maximum or smaller than
the observed minimum found in the training set. To accommodate these scenarios, we scale
the features in the testing and training dataset as follows:
φScaled =
0, ifφ < φmin φ−φmin
φmax−φmin, ifφmin ≤φ≤φmax
1, ifφ > φmax
Chapter 6
Feature Combination
This chapter reviews the four methods we have chosen to combine the features we have
extracted from the bug fixing data. Choosing the appropriate method of feature
combi-nation can be as important as choosing appropriate features. More sophisticated methods
of feature combination can be trained to identify the importance of certain features and
apply a weighting factor to emphasize the ones that have been identified as important to
the accuracy of the model. We have selected four methods of combination to provide a
more complete analysis of our features - naive aggregation, a learning to rank approach,
an ordinal regression-based approach, and a joint-recommendation approach utilizing both
learning to rank and ordinal regression.
6.1
Naive Aggregation
To illustrate the benefits offered by the use of ranking algorithms, we include a Naive
Aggregation of the features as a baseline for comparison with our other models. Feature
Score aggregation was used in earlier studies [24], [27], [43] where the number of features
is limited, so they are either weighted using trial and error or simply summed to generate a
final ranking value. No weights are applied to any of the features. The bug report/developer
pairings are then ranked in descending order by this final score. This approach is shown
below, whereφi(r, s)is each feature score andkis the total number of features:
f(Br, D) = φ(Br, D) = k
X
i=1
6.2
Learning to Rank
We include a learning-to-rank approach for combining features to allow for effective
com-parison with previous results. This approach was used in [32], [40], and [41] to generate
their final ranking score. In this approach, a ranking model is trained using historical data
that is labeled with the correct developer/bug report pairing. The model uses these values to
identify which features are of the most importance to the correct bug report/developer
par-ings and calculates corresponding weights for each feature to emphasize the features that
most contribute to a correct ranking and minimize the ones that do not. Each feature value
in the test set is then multiplied by its corresponding weight to generate a final ranking
value. The bug report/developer parings are then ranked in descending order by this final
score. This approach, as defined by [41], is shown below, where φi(r, s) is each feature score, wi is that feature’s rank assigned by the learning to rank model, and k is the total number of features:
f(Br, D) =wTφ(Br, D) = k
X
i=1
wi∗φi(r, s) (6.2)
6.3
Ordinal Regression
To provide an additional dimension of comparison, the features extracted from each dataset
were used as input into an Ordinal Regression model in the Microsoft Azure Machine
Learning Studio. An Ordinal Regression model was selected due to its suitability in
prob-lems involving predicting and ordering ranked values. Predicting an ordinal ranking is a
specialized task differentiated from predicting values on a continuous scale by the lack of
an intrinsic scale in the numbers representing rank order. For example, predicting students’
test scores could be performed by a standard regression model, but a prediction of their
class ranking would require an ordinal regression model. The model treats a ranking
prob-lem as a series of related classification probprob-lems. To address this, the algorithm uses an
extended binary classification model for each rank to indicate if the value should be ranked
A Two-Class Boosted Decision Tree classifier is used as the underlying binary
classifi-cation algorithm. This is an ensemble learning method where ensuing trees correct for the
errors of previous trees before using the entire ensemble of trees to make a joint prediction.
Boosted decision trees are typically appropriate in instances where the features are
some-what related and where many more examples are present than features - both conditions
that our dataset meets. Additionally, this algorithm is suited to a wide variety of machine
learning tasks, at the cost of being one of the more memory-intensive approaches.
Fur-thermore, Anvik et al. [1] have used a Decision Tree classifier to address bug localization.
Given this information, we feel this algorithm is the most suitable classifier for this study.
This approach, as defined by [19], is shown below:
r(x) = 1 + K−1
X
k=1
[[f(x, k)>0]] (6.3)
6.4
Joint Recommendation
Evaluations of early trials on the Eclipse UI dataset indicated that the Ordinal Regression
approach, while less accurate overall than the learning to rank approach, correctly identified
a noteworthy amount of correct developer-bug report pairings that were missed at low
k-values by the learning to rank approach. In an effort to increase the accuracy of the ranking
algorithm at low k-values, the viability of a joint recommendation technique is explored. In
this technique, the results of the ordinal regression algorithm will be used to create another
feature for use in the learning to rank approach. For a given developer, if the developer is
the top-ranked(k=1)recommendation in the ordinal regression approach, the value will be
1, otherwise the value will be 0. This feature is then used as a component of the learn to
rank approach described in section 6.2. This feature is defined as follows:
φ23(Br, D) =
1, if developer D is the ranked f irst by Ordinal Regression
Chapter 7
Experimental Methodology
In this chapter, we begin by presenting our research questions. We then introduce the
dataset used and review several corrections and filters applied to the data. Next, we
enumer-ate the database structure and linking heuristic used to connect developer commit messages
with bug reports. Finally, we review the experimental setup and evaluation metrics.
7.1
Research Questions
In attempting to identify if we can more accurately assign bug reports to software
develop-ers for a project, we present the following research questions:
1. Does a model that considers textual similarity between bug reports and version
con-trol commit messages, as well as between bug reports and project API specifications,
achieve higher accuracy than a model without those features for the problem of
au-tomated bug assignee recommendation?
2. Which method of feature combination for our features (between naive aggregation,
learning-to-rank, and ordinal regression) is most suitable for bug triage?
3. Does a joint recommendation approach offer superior accuracy as compared to its
component parts?
4. Which features are most important to the accuracy of our model?
5. Does the size of the training dataset have a significant impact on the accuracy of the
For RQ1, we compare accuracy results for the most recent fold of bug report data
between a model using just the features used by Tian et al. in [32] and a model using
those features in addition to our new features (i.e. φ5−8 and φ19−22). We use the
SVM-rank tool to implement a learning to SVM-rank-based training for our model, as is performed
in [32]. For RQ2, we take the set of features that performs better from RQ1 and apply
the three different methods of feature combination discussed in section 6 and compare
the accuracy results across each of the three approaches. For RQ3, we compare the joint
recommendation approach discussed in section 6.4 to the approaches examined in RQ2.
For RQ4, we measure the relative importance of each feature by comparing the weights
assigned by the learning-to-rank tool to each feature in the model generated for our feature
set. For RQ5, we vary the number of folds used for training for each dataset and examine
the impact of smaller training sizes on overall classifier accuracy. We track the accuracy of
the learning-to-rank model using the best performing feature set from RQ1 at k values of
1, 5, 10, and 20 across increasingly small training datasets. With each iteration, the fold
containing the oldest data will be discarded until f old9 (the most recent bug fixing data
prior to the test set) is the only fold used for training.
7.2
Data Collection and Filtration
To allow for effective comparison, we used the same dataset used by Lam et al. & Ye et
al., and partially overlap with the dataset used by Tian et al. [16], [32], [41]. This dataset
consists of bug reports, commit logs, and project sources of six open source java projects:
AspectJ, Birt, Eclipse UI, JDT, SWT, and Tomcat. A brief description of each project
is available in section 7.3. All the bug reports, source code links and buggy files, API
documentation, and the oracle of bug-to-file mappings are all publicly available1thanks to
Ye et al.
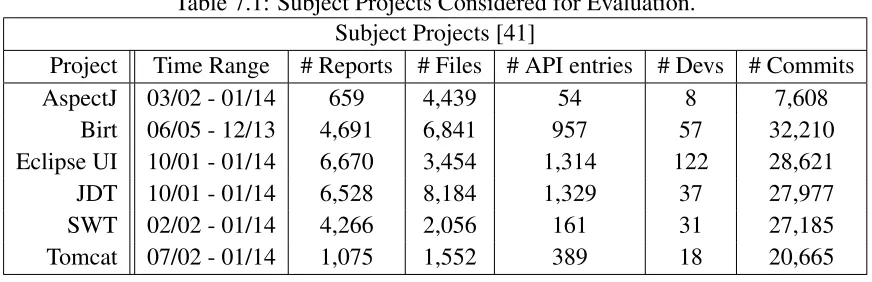
Table 7.1: Subject Projects Considered for Evaluation. Subject Projects [41]
Project Time Range # Reports # Files # API entries # Devs # Commits
AspectJ 03/02 - 01/14 659 4,439 54 8 7,608
Birt 06/05 - 12/13 4,691 6,841 957 57 32,210
Eclipse UI 10/01 - 01/14 6,670 3,454 1,314 122 28,621
JDT 10/01 - 01/14 6,528 8,184 1,329 37 27,977
SWT 02/02 - 01/14 4,266 2,056 161 31 27,185
Tomcat 07/02 - 01/14 1,075 1,552 389 18 20,665
For the purposes of this study, we only considered bug reports that were marked
”RE-SOLVED FIXED”, ”VERIFIED FIXED”, or ”CLOSED FIXED” for both training and
testing. Furthermore, we discard any bug reports that are linked to multiple git commits, as
it is unclear which fixed files and commits are relevant [41]. Additionally, we discard any
bug reports that do not have a java file present in their list of corrected files, as these are
considered to be nonfunctional reports [4].
Manual inspection of the data revealed that several developers had entered code
un-der multiple usernames over the course of several of the projects. These multiple
user-names occurred for several reasons, including switching between a username and a
dis-play name (”obesedin” → ”Oleg Besedin”), adding a middle name to a display name
(”Markus Kuppe” →”Markus Alexander Kuppe”), or simple typos (”Chris Goldthorpe”→
”Chris Goldthorep”). Each instance of duplicate usernames was manually verified by
en-suring that each account shared a common username or email address before correction.
These corrections removed one extraneous developer profile from the AspectJ Project, nine
from the BIRT project, and eleven from the Eclipse UI Project.
7.3
Projects Used
For this study, we considered benchmark datasets from six open source Java projects. These
projects offer varying time ranges, file counts, and number of developers working on the
utilized this set of benchmark datasets to address bug localization [40], [41]. This dataset
partially overlaps with the dataset used in [32] to address bug triage. All of these projects
use BugZilla as their issue tracking system and Git as a version control system. The bug
reports, source code, and API specifications for each project are all publicly accessible.
The projects considered are as follows:
• AspectJ2: an aspect-oriented programming extension for Java.
• Birt3: an Eclipse-based business intelligence and reporting tool.
• Eclipse Platform UI4: The user interfaces for the Eclipse integrated development
platform.
• JDT5: A suite of Java development tools for Eclipse.
• SWT6: A widget toolkit for Java.
• Tomcat7: A web application and servlet container.
7.4
Database Structure
BugZilla stores different information relevant to the creation, processing, and completion
of a bug report as it moves through the bug lifecycle. For each of the above projects,
several data points were mined for each bug report to create the benchmark dataset. The
information from BugZilla was augmented by mapping the report to the file changes and
commit that was responsible for their correction. This was performed prior to this study
using heuristics proposed by Dallmeier and Zimmerman in [4] as described in Section 7.5.
The relevant information extracted for each bug report is enumerated below:
2http://eclipse.org/aspectj
3https://www.eclipse.org/birt/
4https://projects.eclipse.org/projects/eclipse.platform.ui
5http://www.eclipse.org/jdt
6http://www.eclipse.org/swt
• Bug id: The six digit ID number used to identify the bug in BugZilla
• Summary: A brief message summarizing the detected bug
• Description: A longer message with more specific information about the bug
• Report time: The date and time the bug report was created
• Reporter: The developer or user who reported the bug
• Assignee: The developer who was assigned the task of fixing the bug
• Status: The working status of the bug, indicating where in the bug lifecycle it is
• Commit: The commit hash matching the Git commit that resulted in the bug being
corrected
• Author: The developer who submitted the Git commit that resulted in the bug being
corrected
• Commit time: The time at which the correcting commit was submitted
• Log: The commit message attached to the correcting commit
• Files: The files that were changed in the correcting commit
7.5
Linking Heuristic
In order to establish our ground truth - that is, which developer submitted the commit that
resulted in the correction of the bug identified in a bug report - we employ the linking
heuristic used by Dallmeier and Zimmerman to connect a bug report with the git commit
and file changes that resulted in it being marked as closed. This process is performed
for bug reports with status of”RESOLVED FIXED”,”CLOSED FIXED”, or”VERIFIED
FIXED”. In this process, project change logs are searched for phases such as ”bug 384108”
and the dates where the bug reports changed statuses are also considered. Any reports
that link to multiple git commits or revisions, as well as reports that share a fixing commit
with another report, are ignored because it is not clear which fixed file is relevant. Per
Dallmeier and Zimmerman, bug reports without fixed files are also ignored because they
are considered not functional [4]. Employing this heuristic allows us to identify the ID
(hash), author, submission time, log, and files included for the commit responsible for
submitting the accepted and verified fix to a bug identified in a bug report.
7.6
Experiment Setup and Evaluation Metrics
Our experimental setup includes two sets of comparisons. First, we examine the validity
of our included API features and commit message features by evaluating our feature set
against the feature set used in [32]. Second, we examine the appropriateness of the different
ranking algorithms by evaluating the accuracy and performance of each algorithm on our
feature set. For this study, we consider a simple naive aggregation of feature scores, the
learning-to-rank approach implemented in the rankSVM package used by Tian et al. [17],
an ordinal regression algorithm, and a joint-recommendation approach between ordinal
regression and learning-to-rank. To run this experiment, the bug fixing history of the project
was loaded into a MySQL database. A Python script was created to calculate the features
covered in section 5 and the results were fed into Joachim’s SVM-rank tool [13] and the
Microsoft Azure Machine Learning Studio.
To mitigate the risk of overfitting, we create disjoint training and test sets by sorting the
bug report data chronologically by when they were reported and divided the dataset into 10
equally sized folds where fold 10 is the most recent bug fixing data. The exception to this
rule is the AspectJ dataset. Due to its smaller size, the dataset was split into 3 equally sized
folds, where fold 3 is the most recent bug fixing data. For each bug report, we calculate
the feature scores and aggregate them through one of the mentioned scoring functions for
each pairing of a developer and the bug report. We then rank these files in descending
Figure
Outline
Related documents