Programme for International
Student Assessment (PISA) 2003
Initial Report on
Programme
for
International
Student Assessment (PISA)
2003
Initial Report on Scotland’s
Performance in Mathematics,
Science and Reading
Graham Thorpe
This report is a publication of the research group within Information, Analysis and Communication Division, which is responsible for providing analytical services within the Scottish Executive Education Department (SEED). Their work is part of a multidisciplinary unit (consisting of researchers, economists and statistics staff) and the staff undertakes and funds economic analysis and social research in the fields of: school education; children, young people and social work: architecture; and tourism, culture and sport.
The views expressed in this report are those of the author(s) and do not necessarily reflect those of the Scottish Executive or any other organisation(s) by whom the author(s) is or are employed.
Acknowledgements
The author would like to thank Liz Levy, Information, Analysis & Communication Division (IAC) for editing, checking data and providing some additional analysis; and Rik Kay (IAC) for assembling and formatting the report. Both the SCRE Centre and the Scottish Executive Education Department express their gratitude to the schools and individuals who took part in the PISA 2003 as mentioned in the Introduction.
Copyright © December 2004, Scottish Executive Education Department
A limited number of additional copies may be obtained from the Dissemination Officer, Information, Analysis and Communication Division, Scottish Executive Education Department, Victoria Quay, Edinburgh EH6 6QQ (telephone 0131-244-0316) or e-mail
recs.admin@scotland.gsi.gov.uk. Copies of this report and our other education research
Contents
Executive summary... 1
Introduction... 1
Student Proficiency in Mathematical Literacy... 1
Student Proficiency in Reading Literacy... 2
Student Proficiency in Scientific Literacy... 3
Chapter 1: Introduction ... 4
Design of PISA 2003 ... 4
PISA 2003 International Report... 5
PISA in Scotland ... 5
The Scottish Report... 6
Trends in Mathematics and Science Study (TIMSS) 2003... 6
Domestic Survey of Attainment ... 7
Chapter 2: Student Proficiency in Mathematical Literacy ... 8
How Mathematical Literacy is Defined ... 8
How Mathematical Literacy was Assessed in PISA 2003 ... 8
Four Content Areas ... 9
Process ... 9
Situation ... 10
How the Mathematical Literacy Results are Reported ... 10
Summary of Mathematics Results for the OECD and for Scotland... 11
[image:4.595.86.523.97.761.2]Proficiency Levels ... 11
Table 2.1. Percentage of students at each level of proficiency on the mathematics literacy scale ... 12
Figure 2.a. Percentage of students at each level of proficiency on the combined mathematics scale ... 12
Mean Scores in Mathematics Literacy ... 12
Table 2.2. Student performance on the mathematics scale, all students and by gender ... 13
Table 2.3: OECD countries whose mean scores differ significantly from the Scottish mean, or do not differ significantly from this. ... 14
Changes in Mean Scores in Mathematics Between PISA 2000 and PISA 2003... 14
Space and Shape... 14
Figure 2.b. Differences in scores between PISA 2000 and PISA 2003 on the mathematics space & shape scale ... 15
Change and Relationships ... 15
Figure 2.c. Differences in scores between PISA 2000 and PISA 2003 on the mathematics change & relationships scale... 16
Gender Differences in Mathematical Literacy ... 16
Figure 2.d. Gender differences in mathematics mean score (score difference in favour of males) ... 16
Figure 2.e. Mathematics combined results scale: comparison of male and female student attainment for OECD and Scotland... 17
Table 2.4: Mean score and proportion of students reaching top three proficiency levels
for each content area... 18
Table 2.5. Student performance on mathematics sub-scales, country mean scores ... 19
Table 2.6. Number of OECD countries with mean scores ... 20
Variation in Combined Mathematics Scores Between Low and High Achievers... 21
Figure 2.f. Difference in mathematics combined score between students at the 25th and 75th percentile levels of attainment ... 22
Chapter 3: Student Proficiency in Reading Literacy ... 23
How Reading Literacy is Defined ... 23
How Reading Literacy was Assessed in PISA 2003 ... 23
How the Reading Literacy Results are Reported ... 23
Summary of Reading Results for the OECD and Scotland. ... 24
Proficiency Levels ... 24
Table 3.1. Percentage of students at each level of proficiency on the reading literacy scale ... 24
Figure 3.a. Percentage of students proficient at each level of reading literacy ... 25
Mean Scores in Reading Literacy ... 25
Table 3.2. Student performance on the reading scale, all students and by gender... 26
Table 3.3. OECD countries whose mean scores differ significantly from the Scottish mean... 27
Changes in Mean Scores in Reading between PISA 2000 and PISA 2003 ... 27
Figure 3.b. Differences in scores between PISA 2000 and PISA 2003 on the reading scale ... 27
Scores in Reading for Students at Various Percentile Levels of Attainment... 28
Table 3.4: Scores attained by students at the lower end of the ability scale in reading literacy in PISA 2000 and PISA 2003 ... 28
Gender Differences in Reading ... 29
Figure 3.c. Gender differences in mean score in reading literacy (score difference in favour of males) ... 29
Variation in Reading Scores Between Low and High Achievers. ... 30
Figure 3.d. Difference in reading literacy scores between students at the 25th and 75th percentile levels of attainment ... 30
Chapter 4: Student Proficiency in Scientific Literacy ... 31
How Scientific Literacy is Defined ... 31
How Scientific Literacy was Assessed in PISA 2003 ... 31
How the Scientific Literacy Results are Reported ... 31
Summary of Science Results for the OECD and Scotland... 32
Mean Scores in Scientific Literacy ... 32
Table 4.1. Student performance on the science scale, all students and by gender... 32
Table 4.2. OECD countries whose mean scores differ significantly from the Scottish mean... 33
Changes in Mean Scores in Science Between PISA 2000 and PISA 2003 ... 33
Scores in Science for Students at Various Percentile Levels of Attainment... 34
Figure 4.b. Gender differences in mean score in science literacy (score difference in
favour of males) ... 35
Variation in Science Scores Between Low and High Achievers... 36
Figure 4.3. Difference in science literacy scores between students at the 25th and 75th percentile levels of attainment ... 36
Appendix A... 37
Results for the United Kingdom... 37
Appendix B... 39
Summary Proficiency Level Descriptors for Mathematical Literacy... 39
Appendix C ... 40
Summary Proficiency Level Descriptors For Reading Literacy ... 40
Executive summary
Introduction
The OECD Programme for International Student Assessment (PISA) assesses the performance in reading literacy, mathematical literacy and scientific literacy of 15 year old students in its member countries.
PISA examines young people's ability to use their knowledge and skills to meet real-life challenges rather than whether they have mastered a specific school curriculum.
In PISA 2003, the main subject assessed was mathematics, with reading and science forming the minor domains.
Scotland took part in PISA 2003 as an independent National Centre, meaning that it participated fully in all PISA activities as though it were a full country including separate quality monitoring and adjudication of test administration.
Over 275,000 students took part in PISA 2003 from 41 participating countries (all 30 OECD countries and 11 non-OECD ‘partner’ countries). Although the United Kingdom as a whole failed to meet the rigorous sampling criteria for the study (meaning that its results are not considered sufficiently reliable to be reported in full) Scotland and Northern Ireland did, separately, meet the criteria and their results are reported in an annex to the international report.
The intended sample for Scotland was of 108 schools and 35 pupils in each of these. The school sample was a stratified, random sample representative of all mainstream secondary schools in Scotland (local authority, grant-aided, and private schools). Of the 108 Scottish schools that were recruited to the study, 98 returned completed tests and questionnaires, a response rate of 90%. Just over 2,700 students completed tests and questionnaires.
This report presents results for Scotland and the 29 OECD countries that fully met the OECD criteria for acceptability. It does not report on results from the ‘partner countries’.
This present report is concerned with the main set of test results from the study. Further themed reports planned for 2005 are likely to report on the questionnaire data gathered from schools and pupils, the relationships between these data and the results obtained in mathematics, and the domain of problem solving (which was additional in PISA 2003).
Student Proficiency in Mathematical Literacy
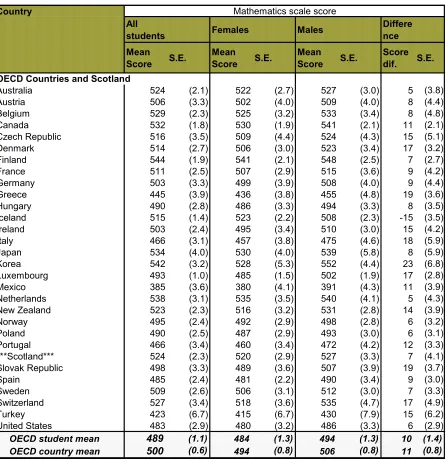
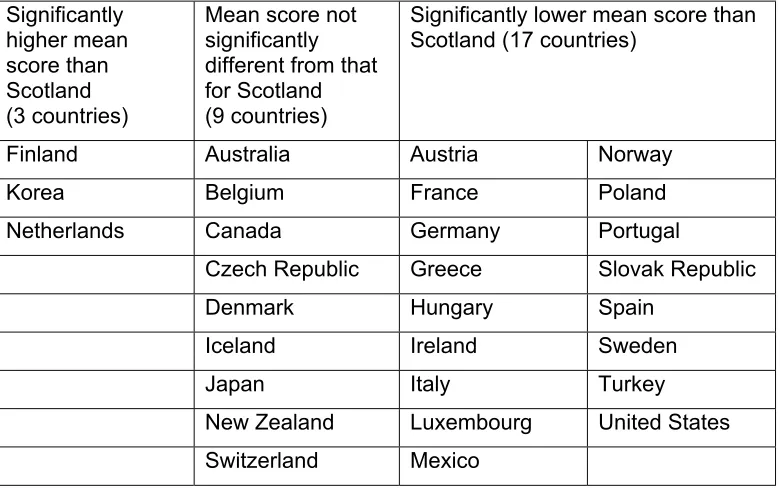
Scotland’s mean score in mathematics is 524. This is significantly above the OECD average. Eight OECD countries have mean scores higher than Scotland but only Finland, Korea, and The Netherlands have mean scores that are significantly higher.
In mathematics literacy, male students outperformed female students in all countries except Iceland. For the 29 OECD countries as a whole, the average difference is close to 11 points. In Scotland it is 7 points.
PISA 2003 reports on student performance at six ‘proficiency levels’ – descriptions of the kind of mathematical competency demonstrated by students. Just below one-third (31%) of students across the OECD area as a whole performed at the top three proficiency levels (Level 4 or above) and 3.5% at the highest level, Level 6. In Scotland, 41.2% of students attained Level 4 or better and 3.9% achieved Level 6.
As well as assessing overall performance in mathematics, PISA 2003 assessed pupil performance in 4 ‘content areas’: Space and shape (which draws upon the discipline of geometry); Change and relationships (which relates most closely to algebra); Quantity
lies within the area of probability and statistics). The mean scores for Scotland in each of the four content areas are significantly higher than those for the OECD as a whole.
Both in respect of the OECD taken as a whole and relative to the individual countries that constitute the OECD, Scottish students do very well in the content area of Uncertainty. Only one OECD country had a mean score in this area that was significantly higher than that of Scotland. Change and Relationships is the next strongest area. Only two OECD countries have higher mean scores than Scotland. In the other two content areas, Scotland’s performance is good but not strong (nine countries have a mean score that is significantly higher than that of Scotland’s in Space and Shape and five countries have a mean score that is significantly higher in Quantity).
In each content area, male students attain higher mean scores than females both in the OECD as a whole and in Scotland.
It is not possible to compare overall performance in mathematics in PISA 2000 and 2003 (for any participating country). The only valid comparison is confined to the two content areas of
Space and Shape and Change and Relationship. Performance could be compared across
25 OECD countries and Scotland.
The average score in Space and Shape across these 25 countries as a whole did not change significantly. On a common scale, the mean score in PISA 2000 was 494, while that in PISA 2003 was 496 points. Scotland showed a slight, though non-significant drop in performance, with a mean score in PISA 2000 of 511 points and in PISA 2003, of 507 points. The average score in Change and Relationship showed a significant increase. On a common scale, the mean score in PISA 2000 was 488, while that in PISA 2003 was 499 points. Although Scotland’s mean score in this content area (529) is one of the highest in PISA 2003, this mean decreased since PISA 2000 by 1 point.
PISA 2003 provides encouraging evidence that Scotland is succeeding in ‘closing the gap in attainment’. One of the ways in which PISA measures equity in attainment is by comparing the score gap between students at the 75th percentile level and those at the 25th percentile.
The smallest gap (115 points) is found in Finland. Scotland has the same score gap as Finland.
Student Proficiency in Reading Literacy
Scotland’s mean score of 516 is (statistically) significantly above that for the OECD as a whole. Only the three top performing OECD countries on the PISA 2003 reading literacy scale (Finland, and Korea and Canada) had mean reading scores that were significantly higher than that of Scotland.
In every OECD country the mean reading score for female students is significantly higher than that for male students. On average, across the OECD, the difference in performance between female and male students is 34 points. In Scotland, the difference was 24 points. Overall, 55% of students in the OECD attained the top 3 proficiency levels in reading literacy (Levels 3,4 and 5) and 8% attained the highest level, Level 5. In Scotland, 68% performed at the top three levels and 9% at Level 5.
Between PISA 2000 and 2003 mean score in reading literacy in Scotland dropped by 11 points - a drop that is of borderline statistical significance (i.e. significant at the 10% level of significance but not at the 5% level).1
1 The level of significance refers to the odds that the difference between the scores is due to there
Although there has been a drop in Scotland’s mean score, this drop has not been experienced across all ranges of ability. Despite the trend across the OECD as a whole, the performance of our lowest 25% of students has improved (though not significantly).
Scotland’s score gap in reading between students at the 75th percentile level and those at
the 25th percentile level is 116. Only 4 countries had a score gap that was narrower than this.
The smallest gap (105 points) is again found in Finland.
In PISA 2000, Scotland’s score gap (between the 25th and 75th percentiles) in reading was
136 points. This means that between 2000 and 2003, our score gap narrowed by 15%. No other OECD country narrowed its score gap by as much as this.
Student Proficiency in Scientific Literacy
Scotland's mean score in science literacy (514) is significantly above the OECD average. Of the eight OECD countries with higher mean scores than Scotland, only the top three countries (Finland, Japan and Korea) can be said with certainty to have students who do better, on average, than those in Scotland.
While in general male students did better than females in the OECD at large, this is not universally the case. In Scotland there is a difference of 8 points in favour of male students, but this difference is not statistically significant.
Scotland’s mean science score fell between PISA 2000 and PISA 2003, but the 8 point drop, from 522 to 514 points, is not statistically significant.
The drop in performance in Scotland was more or less uniform across the whole ability range. Performance by students at the very lowest levels of ability, those at the 5th percentile
and 10th percentile levels fell by approximately 5 points, while those at the 25th 75th 90th and
95th percentile levels fell by between 7 and 9 points.
In Scotland, the score gap between students at the 75th percentile level and those at the 25th
level was 140 points. Scotland’s rating on this equity scale is neither particularly good nor particularly bad, compared with the OECD countries.
Chapter 1: Introduction
The OECD established its Programme for International Student Assessment (PISA) to assess the performance in reading literacy, mathematical literacy and scientific literacy of 15 year old students in its member countries. The results from the studies contribute school outcome measures to the OECD’s educational indicators programme2. Since PISA’s
inception its scope has broadened to include OECD countries as well. These non-OECD countries are referred to as “partner countries”.
The first PISA survey took place in 20003, the second in 2003, and work has started on the
third, to take place in 2006. Each study focuses in turn upon one of the above three literacies, while allocating a subsidiary role to the other two. Consequently, the whole series has a major cycle of nine years. In PISA 2000 the majority of assessment items were in reading literacy and the minority in mathematics and science literacy, while in PISA 2003 the majority are in mathematical literacy, the other two domains playing the minor roles. In PISA 2006 the majority are in scientific literacy. To provide continuity between studies and a measure of change over the three-year intervals, a proportion of the test items from previous studies are re-used in subsequent ones.
The scope of PISA has grown. In 2003 an additional, subsidiary, domain of problem solving was added to the other three, though this is not to be carried forward to 2006. (The results of the problem-solving tests are not reported in this initial report but will be reported on in 2005.) A trial of computer-based assessment will form part of PISA 2006.
The domains covered by PISA are defined in terms of:
•
The content or structure of knowledge that students need to acquire•
The processes that need to be performed•
The contexts, or situations, in which knowledge and skills are applied.PISA examines young people's ability to use their knowledge and skills to meet real-life challenges rather than whether they have mastered a specific school curriculum. For instance, PISA defines reading literacy as the ability to understand, use and reflect on written texts in order to participate effectively in life. Its concern is not one of making a parallel assessment to those provided by school examinations.
PISA provides a broad assessment of comparative learning outcomes towards the end of compulsory schooling to guide policy decisions and provide insights into factors that contribute to the development of knowledge and skills, and the extent to which these factors are common to different countries.
Design of PISA 2003
In 2003 over 275,000 students took part in PISA from 41 participating countries4. All 30
member countries of the OECD participated and 11 non-OECD, partner, countries. One OECD country, the United Kingdom5, failed to meet the rigorous sampling criteria for the
study, meaning that its results are not considered sufficiently reliable to be reported in full. Scotland and Northern Ireland did, separately, meet the criteria. Consequently, this report
2 See OECD (OECD, 2003) 3 See OECD (OECD, 2001)
4 Note that the OECD counts full national entities as “countries”. Thus the UK is counted once only in
this figure of 41, although England with Wales, Scotland, and Northern Ireland participated as three independent units within the actual study. Similar situations held in other “countries”.
gives results for Scotland and 29 OECD countries only. The UK and the partner countries are not included in this national report.
Pencil and paper assessments were used to assess students, with two hours of assessment for each student. Various questions types were used, including multiple choice questions and questions requiring students to construct their answers. Each student’s particular assessment tasks were drawn from a total of six and a half hours of assessment items, with different students taking different combinations of items from this pool. This combination spanned all the topics being assessed in the 2003 survey, namely: mathematics, reading, science and problem solving. Students also completed a 30 minute questionnaire and senior teachers completed a questionnaire about their schools. Test sessions were supervised by external administrators in most countries, including Scotland.
PISA 2003 International Report
The OECD is to publish the first results from the 2003 study in ‘Learning for Tomorrow’s
World – First Results from PISA 2003’, (OECD, 2004). The results will also appear in the
OECD’s annual compilation of educational indicators Education at A Glance. Subsequently, a number of thematic reports will be produced. These will primarily concentrate on the findings from the mathematics section of the study. All these reports can be found on the OECD web-site at “http://www.oecd.org/”.
Following OECD convention, the report gives two OECD values for the various results it tabulates, eg, two values for the overall mean scores are tabulated, not just the single value that might be expected. The first of the two values (the OECD average) is the average of each of the individual country averages. The second value (the OECD total) is weighted to take account of the different numbers of 15 year-old students in each of these countries. Thus, while the USA contributes equally to the first value, it makes a much larger contribution to the second. Iceland on the other hand while also contributing equally to the first value, contributes much less to the second. The first index is useful for comparing how a country compares with a typical OECD country, the second for comparing the performance of students in any one country with all students in the OECD. We have tried to ensure that, in determining which value to use in the following analysis, we are consistent with the approach that is used in the PISA 2003 international report.
PISA in Scotland
Scotland is not a member country of the OECD, but a part of the United Kingdom. For the PISA 2003 study it operated as an independent National Centre, meaning that it participated fully in all PISA activities as though it were a full country. This allowed for greater input into the planning stages of the programme as well as separate quality monitoring and adjudication of test administration. Structural differences in secondary schooling between Scotland and the other parts of the United Kingdom were more readily managed by treating Scotland as a distinct National Centre, and the results were more readily analysed by the International Study Centre as a consequence. Additionally, results for Scotland will appear in tables in the annex to the international report on the study, enabling the standing of Scotland to be readily compared with that of other countries, unlike PISA 2000, where results were listed for the whole of the UK only.
Of the 108 Scottish schools, 98 returned completed tests and questionnaires, a response rate of 90%. Just over 2,700 students completed tests and questionnaires. These response rates met the OECD’s strict criteria for acceptability. The SCRE Centre and the Scottish Executive Education Department is very grateful to the schools and pupils that agreed to take part in PISA 2003. We understand the many demands that are placed on schools and on 15 year olds and that participation in PISA creates some disruption at a time when many are preparing for exams. We are pleased that schools see PISA as an important and worthwhile study and hope that this initial report and, in particular, the further reports planned for 2005 helps highlight the value of participation.
The Scottish Report
As already noted, this report presents results for Scotland and the 29 OECD countries that fully met the OECD criteria for acceptability. Comparative results for the UK are not given, as the OECD considered these too unreliable (see Annex A for explanation). No results for the 11 non-OECD partner countries are given: readers wishing to know about any of these countries should refer to the main, international reports. Similarly, those wishing to know how Northern Ireland fared should refer to its national report.
The decision to limit the report to Scotland and the OECD was one of expediency. To have reported results for all 41 countries, would have meant excessively long tables and charts. As the 29 OECD countries included most countries whose results would be of interest to a Scottish readership, including most European Union countries, this was the best compromise. It also seemed to be an approach that was consistent with the presentation of the results in the international report where, as already mentioned, international averages are based on the performance of OECD countries only.
This present report is concerned with the main set of test results from the study. Further themed reports planned for 2005 are likely to report on the questionnaire data gathered from schools and pupils, the relationships between these data and the results obtained in mathematics, and the domain of problem solving (which was additional in PISA 2003).
This first Scottish report has been written at the same time as the international report and has drawn heavily on the results presented in that report. Clearly, one unavoidable consequence of this is that it may not be possible to carry through to the Scottish report all the last minute editorial revisions made to the international report. Some of the values reported in the Scottish report may, consequently, differ from those in the published International report. Any such discrepancies should be slight and should not change any conclusions drawn about the Scottish performance.
Trends in Mathematics and Science Study (TIMSS) 2003
At the same time as taking part in PISA 2003, Scotland also took part in the Trends in Mathematics and Science Study (TIMSS) which is run by The International Association for the Evaluation of Educational Achievement (IEA). TIMSS measures mathematics and science performance at P5 and S2. This study reported on 14th December 2004 and the
results show that our performance in mathematics is not significantly different from the international average at P5 but is significantly higher than this average at S2. In science, our performance was significantly above the international average at both P5 and S2.
other important difference between PISA and TIMSS is the stage at which students are assessed. While PISA assesses pupils towards the end of compulsory schooling (and therefore assesses the cumulative impact of schooling), TIMSS assesses pupils in middle primary and in early secondary.
For further detail about TIMSS and Scotland’s performance in this study, see http://timss.bc.edu/.
Domestic Survey of Attainment
Chapter 2: Student Proficiency in Mathematical Literacy
How Mathematical Literacy is Defined
The following paragraphs briefly outline the definition and assessment of mathematics literacy used for PISA. A full account is to be found in The PISA 2003 Assessment
Framework, 2003 (OECD) and in Chapter 2 of the international report on the PISA 2003
survey results referred to earlier.
Centrally, the PISA study is predicated upon an understanding of mathematics as now being of significance for all adults in society rather than just for a minority of specialists as has been assumed, either overtly or implicitly, in previous studies. The concern is consequently not with how well students confront problems designed specifically to assess the concepts and techniques taught at school but whether they can stretch out beyond these potentially restrictive and artificial problems to apply their learning to situations similar to those they will meet as adults in their working and personal lives. Whereas the primary objective of many national examination systems is to ascertain whether or not the student has acquired the necessary mathematical foundation to see him, or her, into higher education in some specialism, the primary objective in PISA is to establish the extent to which those now leaving school will be able to meet the mathematical demands of living at the beginning of the 21st Century.
The tasks simulate, as closely as possible within the limitations of an assessment context, situations that students could well encounter in their present and future lives, with many items drawn from real-life examples provided by the participating countries. An expert group of mathematical educators was responsible for the selection, and formulation, of items. They applied themselves to ensuring that the final selection of items effectively tapped into students’ ability to activate the mathematical knowledge and skills needed to solve such problems.
As problems in everyday life rarely present themselves with the mathematical route to their solution apparent, so in PISA, students have to decode the tasks set and translate them into a suitable mathematical form before they can start to solve them. Process and situation are key factors in the PISA concept of mathematical literacy. Simple technical, or even conceptual, competence in mathematics is not enough. Students must also demonstrate the ability to unravel the core of each task and, when a unique solution exists, find a suitable mathematical model for solving it or, when one does not exist, the model they judge provides the best answer to the task set.
How Mathematical Literacy was Assessed in PISA 2003
The assessment of mathematics was set in a framework defined by three factors6: the
mathematical content of the tasks, the processes required for interpreting each task in a mathematical form, and the various situations in which such tasks might be encountered. Four content zones were covered:
space and shape
change and relationships quantity, and
uncertainty.
Tasks were categorised at three levels of process: the reproduction cluster
the connection cluster, and the reflection cluster.
Tasks were set in four situational contexts: personal
educational and occupational public, and
scientific.
A brief description of these follows.
Four Content Areas
Space and shape, as the name implies, draws upon the discipline of geometry. It requires
students to recognise similarities and differences in the shapes of objects when presented in different representations and in different dimensions, as well as the concepts of relative position and movement.
Change and relationships relates most closely to algebra. It involves, besides an
understanding of the functional dependency between variables, an awareness of inequalities, equivalence, divisibility, etc, as well as a recognition that relationships can be expressed in various mathematical forms, and that changing between representations may be the key to solving a problem.
Quantity covers those aspects of mathematics bearing upon number. Students have to
demonstrate competence in the many facets of this, from an understanding of relative size, and the use of numbers as representations of objective properties of bodies, through to the higher level of quantitative reasoning, which requires the understanding of the meaning of arithmetical operations.
Uncertainty lies within the area of probability and statistics. PISA regards the understanding of statistical ideas and the ability to follow statistical arguments as of increasing importance, if citizens are to participate effectively in democratically organised societies.
Process
The process of translating a problem to an appropriate mathematical formulation, is rarely achieved in one single step. A complete formulation often requires several levels of conceptual refinement. Similarly, the actual mathematics needed to solve it may require several different levels of proficiency. Some steps may be straightforward arithmetic, others may require careful algebraic manipulation. Finally, the complete answer to a problem may require several partial solutions, each at different conceptual levels. Therefore, real-life problems will rarely fall neatly into one single level of any framework devised to categorise process. Consequently, the main value of such a framework lies in confirming that the desired conceptual range is adequately covered by the collection of items used. It has less value for the reporting of results. The framework adopted by PISA assembled cognitive activities into three clusters, loosely hierarchical in structure. These are:
The reproduction cluster covers those competencies necessary to solve familiar, routine
problems. Students essentially utilise practised knowledge, standard methods, and straightforward calculations.
The connections cluster comprises competencies that students have to deploy to solve
those problems which, although set in a familiar situation, do not present an immediately recognisable solution. Such problems typically involve a greater degree of interpretation for their solution than those in the previous cluster.
Situation
Students were presented with situations that they could conceivably meet in their own lives and which mathematical methods would help them analyse and resolve. Such situations fell into four broad categories: personal, educational/occupational, public, and scientific. A short description of each follows.
Personal situations relate directly to the student’s own daily life. They have at their core the ways in which the individual perceives and is affected by an immediate, personal context. The student has to utilise their mathematics to appreciate, or interpret, some specific aspect of each situation.
Educational/occupational situations include settings that could arise in a student’s school or work life. The core of these situations is how particular school and work settings present students with problems requiring a mathematical solution.
Public situations require students to observe aspects of their broader surroundings. They are generally situations located in the community and their core consists of the relationships that exist between the operative factors. A mathematical evaluation of the aspects of such relationships that have consequences for public life is wanted.
Scientific situations comprise those more abstract contexts typically involving a technological process, a theoretical one, or an explicitly mathematical problem. PISA includes within this situation abstract problems frequently confronted in the mathematics classroom, without attempt at contextualisation.
How the Mathematical Literacy Results are Reported
Results are presented in two principal ways.
The first uses a scale of scores obtained by modelling the patterns of item responses from each student. As each student sat just one booklet from the thirteen test booklets used in the assessment, statistical modelling of the responses is necessary to place all students on a common score scale. This scale was set to have a mean across OECD countries of 500 and a range such that two-thirds of students would score between 400 and 6007. Scales were
derived for each of the four content areas, and for mathematics as a whole.
The second method of reporting results uses six ‘proficiency levels’ – descriptions of the kind of mathematical competency demonstrated by students. Summary descriptions of the proficiency levels are provided in Appendix B. Full descriptions can be found in the OECD publications arising from the study, which have been mentioned already. Descriptions of the highest and lowest levels are given below for convenience. Each test item used in PISA 2003 was matched to one of the six proficiency levels, and students were then placed at a specific proficiency level depending on how they had answered the set of items allocated to this level. More specifically, a student was placed at a particular proficiency level if he or she could be expected to answer correctly at least 50% of a hypothetical range of items spread evenly across the difficulty range for that level.
At Level 6, the highest level:
“ .. students can conceptualise, generalise, and utilise information based on their investigations and modelling of complex problem situations. They can link different information sources and representations and flexibly translate among them. Students at this level are capable of advanced mathematical thinking and reasoning. These students can apply this insight and understanding along with a mastery of symbolic formal mathematical operations and relationships to develop new approaches and
7 The 2003 results were used for this. Thus, the scale is not the same as that in the report on PISA
strategies for attacking novel situations. Students at this level can formulate and precisely communicate their actions and reflections regarding their findings, interpretations, arguments, and the appropriateness of these to the original situations.”
At Level 1:
“...students can answer questions involving familiar contexts where all relevant information is present and the questions are clearly defined. They are able to identify information and to carry out routine procedures according to direct instructions in explicit situations. They can perform actions that are obvious and follow immediately from the given stimuli.”
Summary of Mathematics Results for the OECD and for Scotland
Proficiency Levels
Results for the combined mathematics scale are given in Table 2.1. Figure 2.a presents the same results in graphical form and orders countries on the basis of the percentage of their students that reach Level 2 or above. Results for the individual broad content areas will be presented later.
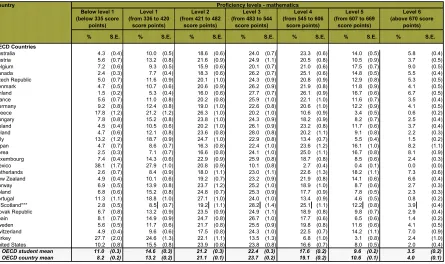
Just below one-third (31%) of students across the OECD area as a whole performed at the top three levels of mathematics (Level 4 or above), and 3.5% at the highest level, Level 6. In broad terms, although OECD country results do vary widely, Belgium, Korea, and Japan, have the greatest proportions of their students achieving both the top three levels jointly, and Level 6, the topmost, as well. Mexico has the lowest proportion of its students at these levels.
With 41.2% of Scottish students attaining Level 4 or better Scotland is well placed on the broader criterion covering Levels 4 to 6, but placed similarly to OECD students as a whole on the narrower criterion, with 3.9% of students achieving Level 6.
Table 2.1. Percentage of students at each level of proficiency on the mathematics literacy scale
Country Proficiency levels - mathematics
Below level 1 (below 335 score
points)
Level 1 (from 336 to 420
score points)
Level 2 (from 421 to 482
score points)
Level 3 (from 483 to 544
score points)
Level 4 (from 545 to 606
score points)
Level 5 (from 607 to 669
score points)
Level 6 (above 670 score
points)
% S.E. % S.E. % S.E. % S.E. % S.E. % S.E. % S.E.
OECD Countries
Australia 4.3 (0.4) 10.0 (0.5) 18.6 (0.6) 24.0 (0.7) 23.3 (0.6) 14.0 (0.5) 5.8 (0.4)
Austria 5.6 (0.7) 13.2 (0.8) 21.6 (0.9) 24.9 (1.1) 20.5 (0.8) 10.5 (0.9) 3.7 (0.5)
Belgium 7.2 (0.6) 9.3 (0.5) 15.9 (0.6) 20.1 (0.7) 21.0 (0.6) 17.5 (0.7) 9.0 (0.5)
Canada 2.4 (0.3) 7.7 (0.4) 18.3 (0.6) 26.2 (0.7) 25.1 (0.6) 14.8 (0.5) 5.5 (0.4)
Czech Republic 5.0 (0.7) 11.6 (0.9) 20.1 (1.0) 24.3 (0.9) 20.8 (0.9) 12.9 (0.8) 5.3 (0.5)
Denmark 4.7 (0.5) 10.7 (0.6) 20.6 (0.9) 26.2 (0.9) 21.9 (0.8) 11.8 (0.9) 4.1 (0.5)
Finland 1.5 (0.2) 5.3 (0.4) 16.0 (0.6) 27.7 (0.7) 26.1 (0.9) 16.7 (0.6) 6.7 (0.5)
France 5.6 (0.7) 11.0 (0.8) 20.2 (0.8) 25.9 (1.0) 22.1 (1.0) 11.6 (0.7) 3.5 (0.4)
Germany 9.2 (0.8) 12.4 (0.8) 19.0 (1.0) 22.6 (0.8) 20.6 (1.0) 12.2 (0.9) 4.1 (0.5)
Greece 17.8 (1.2) 21.2 (1.2) 26.3 (1.0) 20.2 (1.0) 10.6 (0.9) 3.4 (0.5) 0.6 (0.2)
Hungary 7.8 (0.8) 15.2 (0.8) 23.8 (1.0) 24.3 (0.9) 18.2 (0.9) 8.2 (0.7) 2.5 (0.4)
Iceland 4.5 (0.4) 10.5 (0.6) 20.2 (1.0) 26.1 (0.9) 23.2 (0.8) 11.7 (0.6) 3.7 (0.4)
Ireland 4.7 (0.6) 12.1 (0.8) 23.6 (0.8) 28.0 (0.8) 20.2 (1.1) 9.1 (0.8) 2.2 (0.3)
Italy 13.2 (1.2) 18.7 (0.9) 24.7 (1.0) 22.9 (0.8) 13.4 (0.7) 5.5 (0.4) 1.5 (0.2)
Japan 4.7 (0.7) 8.6 (0.7) 16.3 (0.8) 22.4 (1.0) 23.6 (1.2) 16.1 (1.0) 8.2 (1.1)
Korea 2.5 (0.3) 7.1 (0.7) 16.6 (0.8) 24.1 (1.0) 25.0 (1.1) 16.7 (0.8) 8.1 (0.9)
Luxembourg 7.4 (0.4) 14.3 (0.6) 22.9 (0.9) 25.9 (0.8) 18.7 (0.8) 8.5 (0.6) 2.4 (0.3)
Mexico 38.1 (1.7) 27.9 (1.0) 20.8 (0.9) 10.1 (0.8) 2.7 (0.4) 0.4 (0.1) 0.0 (0.0)
Netherlands 2.6 (0.7) 8.4 (0.9) 18.0 (1.1) 23.0 (1.1) 22.6 (1.3) 18.2 (1.1) 7.3 (0.6)
New Zealand 4.9 (0.4) 10.1 (0.6) 19.2 (0.7) 23.2 (0.9) 21.9 (0.8) 14.1 (0.6) 6.6 (0.4)
Norway 6.9 (0.5) 13.9 (0.8) 23.7 (1.2) 25.2 (1.0) 18.9 (1.0) 8.7 (0.6) 2.7 (0.3)
Poland 6.8 (0.6) 15.2 (0.8) 24.8 (0.7) 25.3 (0.9) 17.7 (0.9) 7.8 (0.5) 2.3 (0.3)
Portugal 11.3 (1.1) 18.8 (1.0) 27.1 (1.0) 24.0 (1.0) 13.4 (0.9) 4.6 (0.5) 0.8 (0.2)
***Scotland*** 2.8 (0.5) 8.5 (0.7) 19.2 (1.1) 28.2 (1.4) 25.1 (1.1) 12.2 (0.8) 3.9 (0.4) Slovak Republic 6.7 (0.8) 13.2 (0.9) 23.5 (0.9) 24.9 (1.1) 18.9 (0.8) 9.8 (0.7) 2.9 (0.4)
Spain 8.1 (0.7) 14.9 (0.9) 24.7 (0.8) 26.7 (1.0) 17.7 (0.6) 6.5 (0.6) 1.4 (0.2)
Sweden 5.6 (0.5) 11.7 (0.6) 21.7 (0.8) 25.5 (0.9) 19.8 (0.8) 11.6 (0.6) 4.1 (0.5)
Switzerland 4.9 (0.4) 9.6 (0.6) 17.5 (0.8) 24.3 (1.0) 22.5 (0.7) 14.2 (1.1) 7.0 (0.9)
Turkey 27.7 (2.0) 24.6 (1.3) 22.1 (1.1) 13.5 (1.3) 6.8 (1.0) 3.1 (0.8) 2.4 (1.0)
United States 10.2 (0.8) 15.5 (0.8) 23.9 (0.8) 23.8 (0.8) 16.6 (0.7) 8.0 (0.5) 2.0 (0.4)
[image:18.595.71.526.376.620.2]OECD student mean 11.0 (0.3) 14.6 (0.3) 21.2 (0.3) 22.4 (0.3) 17.6 (0.2) 9.6 (0.2) 3.5 (0.2) OECD country mean 8.2 (0.2) 13.2 (0.2) 21.1 (0.1) 23.7 (0.2) 19.1 (0.2) 10.6 (0.1) 4.0 (0.1)
Figure 2.a. Percentage of students at each level of proficiency on the combined mathematics scale
Below Level 1 Level 1 Level 2 Level 3 Level 4 Level 5 Level 6
Source: OECD PISA 2003
5 7 8 8 9 9 10 10 10 10 11 10 12 11 12 12 13 13 14 12 14 15 15 15 16 19 19 21 25 28
1 2 2 3 3 5 4 5 5 5 5 7 5 6 5 6 6 7 7 9 7 7 8 8 10 11
13 18
28 38
17 18 18 19 19 20 19 21 16 20 20 24 22 22 23 24 19 23 25 25 24 24 27 25 26 22 21 24 26 23 28 22 24 24 26 23 26
20 24
26 28 25 25 25 25
23 26 25 27 24 24
24 23 20 13 10 26 25 25
23 25
24 23 22 23 22 22 21
21 22 20 20 20 19 19
21 19 18
18 18 17 13 13 11
7 3 17 17 15 18 12
16 14 14 12 14 12 17 13
12 9 12 11 10 9
12 8 8 7 8 8 5 5 3
3 0
7 8 5
7 4 8 6 7 4 7 4
9 5 3 2 4 4 3 3 2
16 16 18 28
4 2 2 1 2 1 2 0 1 2 100 75 50 25 0 25 50 75 100 F inl and Kor ea Cana da Nethe rlands ***S co tland* ** Japan Aus tr alia Swi tz er land Ic elan d New Z ealand Denm ar k Bel gium Cz ec h R
epublic Franc
e Irela nd Swe den Aus tr ia Slo vak Republ ic Norwa y Ge rm an y Lux em bour g Pol and Spa in Hung ar y Unit ed State s Por tu gal Italy G reec e Tu rke y M exi co Percentage of students
Mean Scores in Mathematics Literacy
Table 2.2. Student performance on the mathematics scale, all students and by gender
Country
All
students Females Males
Differe nce Mean
Score S.E.
Mean Score S.E.
Mean Score S.E.
Score dif. S.E. OECD Countries and Scotland
Australia 524 (2.1) 522 (2.7) 527 (3.0) 5 (3.8)
Austria 506 (3.3) 502 (4.0) 509 (4.0) 8 (4.4)
Belgium 529 (2.3) 525 (3.2) 533 (3.4) 8 (4.8)
Canada 532 (1.8) 530 (1.9) 541 (2.1) 11 (2.1)
Czech Republic 516 (3.5) 509 (4.4) 524 (4.3) 15 (5.1)
Denmark 514 (2.7) 506 (3.0) 523 (3.4) 17 (3.2)
Finland 544 (1.9) 541 (2.1) 548 (2.5) 7 (2.7)
France 511 (2.5) 507 (2.9) 515 (3.6) 9 (4.2)
Germany 503 (3.3) 499 (3.9) 508 (4.0) 9 (4.4)
Greece 445 (3.9) 436 (3.8) 455 (4.8) 19 (3.6)
Hungary 490 (2.8) 486 (3.3) 494 (3.3) 8 (3.5)
Iceland 515 (1.4) 523 (2.2) 508 (2.3) -15 (3.5)
Ireland 503 (2.4) 495 (3.4) 510 (3.0) 15 (4.2)
Italy 466 (3.1) 457 (3.8) 475 (4.6) 18 (5.9)
Japan 534 (4.0) 530 (4.0) 539 (5.8) 8 (5.9)
Korea 542 (3.2) 528 (5.3) 552 (4.4) 23 (6.8)
Luxembourg 493 (1.0) 485 (1.5) 502 (1.9) 17 (2.8)
Mexico 385 (3.6) 380 (4.1) 391 (4.3) 11 (3.9)
Netherlands 538 (3.1) 535 (3.5) 540 (4.1) 5 (4.3)
New Zealand 523 (2.3) 516 (3.2) 531 (2.8) 14 (3.9)
Norway 495 (2.4) 492 (2.9) 498 (2.8) 6 (3.2)
Poland 490 (2.5) 487 (2.9) 493 (3.0) 6 (3.1)
Portugal 466 (3.4) 460 (3.4) 472 (4.2) 12 (3.3)
***Scotland*** 524 (2.3) 520 (2.9) 527 (3.3) 7 (4.1)
Slovak Republic 498 (3.3) 489 (3.6) 507 (3.9) 19 (3.7)
Spain 485 (2.4) 481 (2.2) 490 (3.4) 9 (3.0)
Sweden 509 (2.6) 506 (3.1) 512 (3.0) 7 (3.3)
Switzerland 527 (3.4) 518 (3.6) 535 (4.7) 17 (4.9)
Turkey 423 (6.7) 415 (6.7) 430 (7.9) 15 (6.2)
United States 483 (2.9) 480 (3.2) 486 (3.3) 6 (2.9)
OECD student mean 489 (1.1) 484 (1.3) 494 (1.3) 10 (1.4)
OECD country mean 500 (0.6) 494 (0.8) 506 (0.8) 11 (0.8)
Positive differences indicate that males perform better than females, Negative differences indicate that females perform better than males.
Mathematics scale score
Table 2.3: OECD countries whose mean scores differ significantly from the Scottish mean, or do not differ significantly from this.
Significantly higher mean score than Scotland (3countries)
Mean score not significantly different from that for Scotland (9 countries)
Significantly lower mean score than Scotland (17 countries)
Finland Australia Austria Norway
Korea Belgium France Poland
Netherlands Canada Germany Portugal Czech Republic Greece Slovak Republic
Denmark Hungary Spain
Iceland Ireland Sweden
Japan Italy Turkey
New Zealand Luxembourg United States
Switzerland Mexico
Changes in Mean Scores in Mathematics Between PISA 2000 and PISA
2003
As mathematics was the primary domain in PISA 2003 more mathematics items were used for this survey than in PISA 2000: 85 items in 2003, compared with 31 in PISA 2000. Twenty (20) of the PISA 2000 items (those not publicly released in the reports on that study) were re-used in 2003 to provide a common core for the two studies.
Several factors conspire against drawing strong conclusions about changes in countries’ mean scores between the two surveys. The three principal factors are: firstly, the relatively small number of items linking the two studies; secondly, the fact that the items carried forward were not distributed evenly across the four content areas of mathematics, but came largely from just two, namely Space and Shape, and Change and Relationships; and thirdly, that context changes between the booklets used in 2000 and those in 2003 introduce appreciable statistical uncertainty into the matching of the scales for each survey. For these reasons, comparisons between the two surveys are necessarily general in nature and confined to the two content areas mentioned.
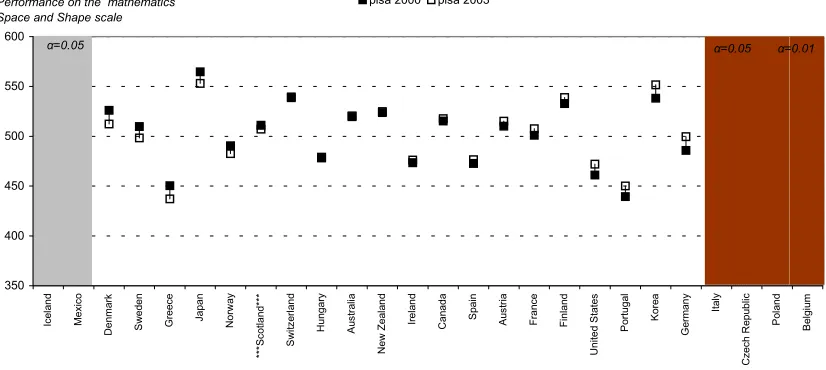
Space and Shape
Performance could be compared across 25 OECD countries and Scotland. Figure 2.b shows the comparison in graphical form. Small black squares denote the PISA 2000 mean scores and small white squares, the PISA 2003 ones. Shaded areas show countries with significantly different mean scores between the two surveys.
The average score across these 25 countries as a whole did not change significantly. On a common scale, the mean score in PISA 2000 was 494, while that in PISA 2003 was 496 points. Four OECD countries show a significant improvement in mean score and two a significant drop. The four showing these improved scores are: Belgium, The Czech Republic, Italy, and Poland. The two showing a drop in scores are: Iceland and Mexico.
at a number of levels of attainment, the 5th, 10th, 25th 75th, 90th and 95th percentile levels, ie
[image:21.595.82.495.190.375.2]the 5% of students at the lowest level through to the 5% at the highest level, scores change by 5 points at most. A difference of 5 points is well within the plausible limits of statistical uncertainty.
Figure 2.b. Differences in scores between PISA 2000 and PISA 2003 on the
mathematics space & shape scale
Countries with statistically significantly higher performance in PISA 2000 Countries with statistically significantly higher performance in PISA 2003
Source: OECD PISA 2003 350 400 450 500 550 600 Ic el an d M exico D e nm ar k S w ed en Gr ee ce Jap a n Nor w ay *** S co tla nd *** Sw itze rl an d Hun gar y Au st ra lia New Zea la n d Ir ela nd Can ada Sp a in Au st ri a Fra nc e F inlan d United S ta te s P ort uga l Ko re a Ge rm an y Ita ly Czech R epu bli c Po la n d Be lg iu m
pisa 2000 pisa 2003
Performance on the mathematics Space and Shape scale
α=0.05
α=0.05 α=0.01
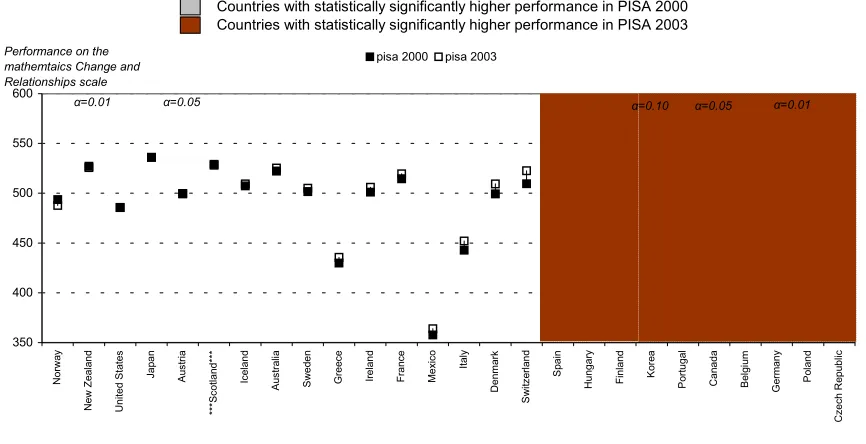
Change and Relationships
Performance in this content area could be compared also across 25 OECD countries and Scotland. Figure 2.c shows the comparison in graphical form. For these the average score did, in contrast to Space and Shape, show a significant change. On a common scale, the mean score in PISA 2000 was 488, while that in PISA 2003 was 499 points. Ten OECD countries show a significant improvement in mean score and none a significant drop. The ten showing improved scores are: Belgium, Canada, Czech Republic, Finland, Germany, Hungary, Korea, Poland, Portugal, and Spain.
The Scottish mean score decreased, but by just 1 point, between the two surveys. As with
Space and Shape, there was no significant difference in performance observable at any
level of attainment. The greatest difference at any level of attainment in Change and Relationships was just 3 points.
Although not visible in Figure 2.c, all but four OECD countries showed an increase in attainment in this content area between 2000 and 2003. This would imply that it is an area that many countries are focusing on developing, in which case Scotland’s relative stand-still may be worrying. On the other hand, Scotland’s score of 529 is already one of the highest and it may be that other countries are merely now catching up. Of the five countries with higher mean score than Scotland in PISA 20038: two (Korea and Japan) already had higher scores than us in 2000; three (Belgium, Canada and Finland) made gains of between 14 and 22 points to enable them to leap-frog over Scotland.
Figure 2.c. Differences in scores between PISA 2000 and PISA 2003 on the
mathematics change & relationships scale
Countries with statistically significantly higher performance in PISA 2000 Countries with statistically significantly higher performance in PISA 2003
Source: OECD PISA 2003 350 400 450 500 550 600 Nor w ay New Zea la n d United S ta te s Jap a n Au st ri a *** S co tla nd *** Ic el an d Au st ra lia S w ed en Gr ee ce Ir ela n d Fra nc e M exico Ita ly D e nm ar k Sw itze rl an d Sp ai n Hun gar y F inlan d Ko re a P ort uga l Can ada Be lg iu m Ge rm an y Po la nd Czech R epu bli c
pisa 2000 pisa 2003
Performance on the mathemtaics Change and Relationships scale
α=0.05
α=0.10
α=0.01 α=0.05 α=0.01
[image:22.595.86.384.416.701.2]Gender Differences in Mathematical Literacy
Figure 2.d. Gender differences in mathematics mean score (score difference in favour of males) -15 5 5 6 6 6 7 7 7 8 8 8 8 9 9 9 11 11 12 14 15 15 17 17 17 18 19 19 23 15 7
-30 -20 -10 0 10 20 30
Iceland Netherlands Australia Poland Norway United States Sweden United Kingdom ** Scotland ** Finland Belgium Austria Hungary Japan France Spain Germany Mexico Canada Portugal New Zealand Ireland Czech Republic Turkey Denmark Switzerland Luxembourg Italy Slovak Republic Greece Korea
olds achieve higher than female in all the countries except Iceland. The range of score differences is large. Korea shows the highest difference, at 23 points but many countries also show large differences. For the 29 OECD countries as a whole, the average difference is close to 11 points. In Scotland the mean score for male students is 7 points above that for female students. In PISA 2000 Scottish male students were 5 points ahead of female. The almost universal better performance by males contrasts with the position in reading literacy where, as will be seen later, the situation reverses and females do better than males.
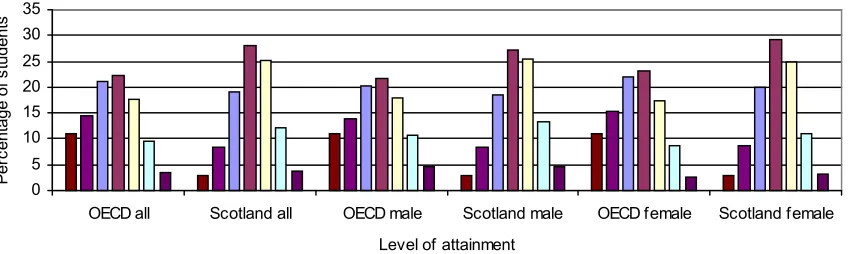
Figure 2.e. Mathematics combined results scale: comparison of male and female student attainment for OECD and Scotland
Mathematics combined results scale
0 5 10 15 20 25 30 35
OECD all Scotland all OECD male Scotland male OECD female Scotland female
Level of attainment
(below level 1, level 1, level 2, level 3, level 4, level 5, level 6)
P
er
centage of
s
tudents
The final two paragraphs of this section focus on the performance of male and female students in Scotland relative to those in the OECD as a whole. The next section of the chapter details the results for each of the four content areas: Space and Shape, Change and Relationships, Quantity, and Uncertainty.
Figure 2.e shows the percentages of OECD and Scottish male and female students attaining the various levels of performance on the combined mathematics scale. Relative to the OECD, as already noted, a greater percentage of students in Scotland attain Levels 4, 5, and 6, the higher levels, though an almost equal percentage reaches Level 6. Equally, fewer Scottish students fall below Level 3 than in the OECD as a whole: while 69% of Scottish students attain Level 3 or better, the corresponding figure for the OECD as a whole is 53%. This pattern is mirrored, with slight variation, for both male and female students, with 71% of Scottish male students and 68% of female attaining Level 3 or better, compared with 55% and 52% respectively in the OECD overall.
Comparing students within Scotland, a greater percentage of male students than female attain the higher levels of performance, but this difference in attainment only shifts in their favour one level above Level 3, at Level 4. While 43% of male students attain Level 4 or above, just 39% of female students do so.
Mathematical Literacy in PISA 2003 – Attainment in the Four Broad
Content Areas
This section presents the results for: Space and shape
Change and relationships Quantity, and
Uncertainty.
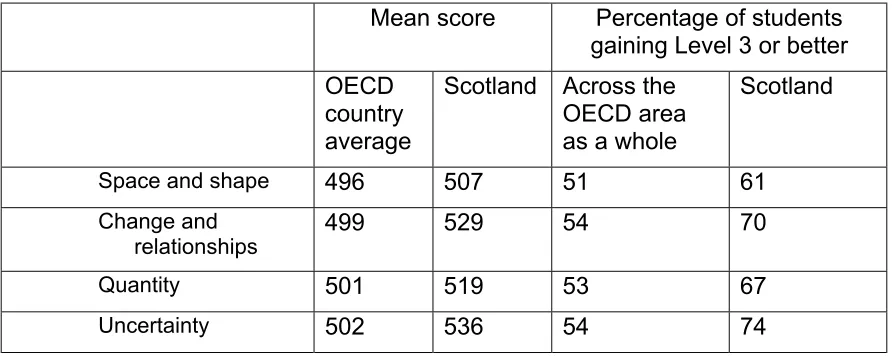
Table 2.4: Mean score and proportion of students reaching top three proficiency levels for each content area
Mean score
Percentage of students
gaining Level 3 or better
OECD
country
average
Scotland Across
the
OECD area
as a whole
Scotland
Space and shape
496 507 51
61
Change and
relationships
499 529 54
70
Quantity
501 519 53
67
Uncertainty
502 536 54
74
Each content area shows a broadly similar pattern for Scotland and the whole OECD to that noted above for the overall performance levels. The mean scores for Scotland on every sub-scale are significantly higher than those for the OECD as a whole, and the proportions of Scottish students above Level 3 are, in general, substantially higher than those for the OECD as a whole.
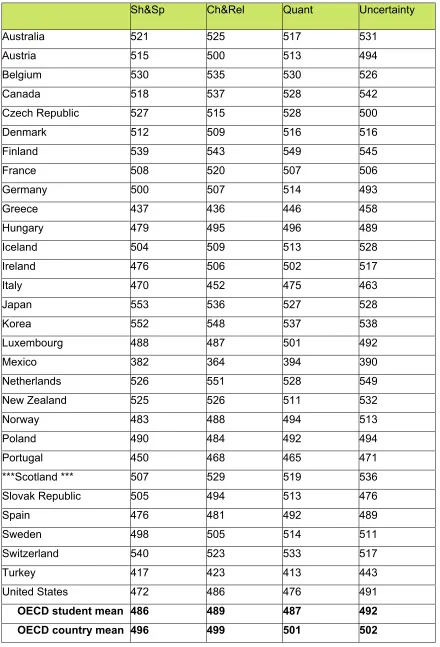
Table 2.5. Student performance on mathematics sub-scales, country mean scores
Sh&Sp Ch&Rel Quant Uncertainty
Australia 521 525 517 531
Austria 515 500 513 494
Belgium 530 535 530 526
Canada 518 537 528 542
Czech Republic 527 515 528 500
Denmark 512 509 516 516
Finland 539 543 549 545
France 508 520 507 506
Germany 500 507 514 493
Greece 437 436 446 458
Hungary 479 495 496 489
Iceland 504 509 513 528
Ireland 476 506 502 517
Italy 470 452 475 463
Japan 553 536 527 528
Korea 552 548 537 538
Luxembourg 488 487 501 492
Mexico 382 364 394 390
Netherlands 526 551 528 549
New Zealand 525 526 511 532
Norway 483 488 494 513
Poland 490 484 492 494
Portugal 450 468 465 471
***Scotland *** 507 529 519 536
Slovak Republic 505 494 513 476
Spain 476 481 492 489
Sweden 498 505 514 511
Switzerland 540 523 533 517
Turkey 417 423 413 443
United States 472 486 476 491
OECD student mean 486 489 487 492
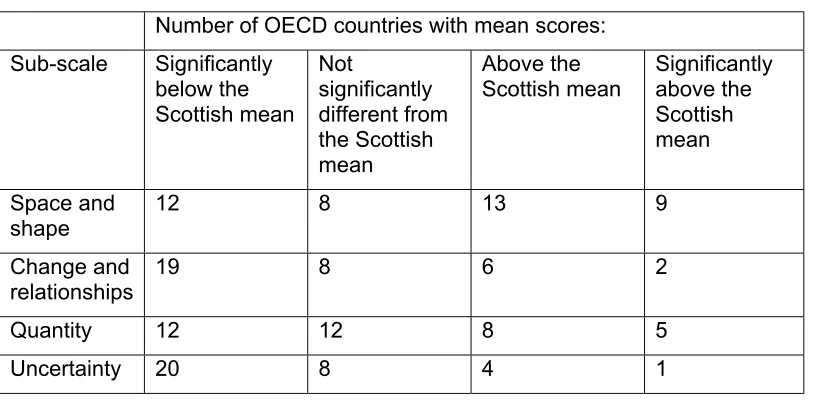
Table 2.6. Number of OECD countries with mean scores
Number of OECD countries with mean scores: Sub-scale Significantly
below the Scottish mean
Not
significantly different from the Scottish mean
Above the Scottish mean
Significantly above the Scottish mean
Space and shape
12 8 13 9
Change and relationships
19 8 6 2
Quantity 12 12 8 5
Uncertainty 20 8 4 1
Both in respect of the OECD taken as a whole and relative to the individual countries that constitute the OECD, Scottish students do very well in the content area of Uncertainty. The Scottish mean score is significantly above the OECD mean, just four countries have higher mean scores and only one of these has a significantly higher mean score than Scotland.
Change and Relationships is the next strongest area. Six countries have higher mean scores than Scotland, two of them significantly higher. The Scottish mean score is significantly above the OECD mean score, and the percentage of students attaining Level 3 or above is well above the OECD percentage.
In the other two content areas, the picture is less clear. Scottish performance is good but not strong. In Space and Shape, the difference between the Scottish mean score and the OECD value, though significant, is the smallest of the four differences. Similarly the difference in percentages of students attaining Level 3 or above is the smallest of the four differences. Thirteen (13) countries have higher mean scores, nine significantly so. Quantity has the second smallest difference in mean score, and similarly the second smallest difference in percentage of students at Level 3 or above. Eight countries have higher mean scores than Scotland, five significantly so.
Parallel to what has been found for the combined mathematics scores, in each content area, male students attain higher mean scores than female both in the OECD as a whole and in Scotland. The percentages of male students attaining Level 3 or above are similarly greater than those for female students.
In Space and Shape, 63% of Scottish male students gained Level 3 or above compared with
58% of female students, while for the OECD as a whole, the corresponding comparison is 53% of males and 48% of females. The mean score for Scottish males (514) is 13 points higher than that for females (501), slightly less than the difference of 17 points in the OECD as a whole. Scottish males scored 9 points above OECD males: Scottish females, 13 points above OECD females9.
In Change and Relationships, 72% of Scottish male students gained Level 3 or above,
compared with 69% of female students. In the OECD as a whole, 55% of male students attained these levels, and 52% of female. The mean score for Scottish males (535) is 11 points higher than that for females (524), the same as the difference in the OECD as a
9 Slight discrepancies between these four figures, and equally between those below, arise from
whole. Scottish males scored 30 points above OECD males; Scottish females, 31 points above OECD females.
In Quantity, Scottish male and female students did equally well in respect of proficiency Levels 3 and above, with 67% of both genders reaching these levels, while in the OECD as a whole, the two results were almost equal, at 54% and 52%, respectively. The mean score for Scottish males (521) was 4 points higher than that for females (517), slightly less than the difference of 6 in the OECD as a whole. Scottish males scored 17 points above OECD males; Scottish females, 19 points above OECD females.
In Uncertainty, male and female students in Scotland performed almost equally well in
respect of attainment at proficiency Levels 3 or above, with 75% of males and 74% of females reaching these levels, while in the OECD, the gap was wider, with 56% of male students attaining these levels and 52% of female. The mean score for Scottish males (538) was 5 points higher than that for females (533), markedly less than the difference of 13 points in the OECD as a whole. Scottish males scored 30 points above OECD males; Scottish females, 37 points above OECD females.
It is reassuring to note that Scotland has scored so highly in the area of Uncertainty. From 2001, SQA changed the arrangements for Standard Grade Mathematics examinations to introduce statistical content papers at all levels. (This was to maintain consistency with the Intermediate 1 and 2 courses which were introduced as part of the Higher Still initiative). In addition to all pupils being taught statistics as part of their National Qualification courses at S3 and S4, many schools introduced an element of statistics into their courses at S1 and S2 to improve the continuity and progression of pupils’ learning.
Variation in Combined Mathematics Scores Between Low and High
Achievers
Figure 2.f shows the score gap between students at the 75th percentile level, ie those at the
top end of the attainment range, and those at the 25th level, ie, those at the bottom of the
Figure 2.f. Difference in mathematics combined score between students at the 25th and 75th percentile levels of attainment
300 350 400 450 500 550 600 650 700
Finland
***S cotla
nd*** Irelan
d
Mexic o
CanadaPortuga l
Spai n
Iceland Poland Denma
rk
Gree ce
Fran ce
Kore a
Luxem bour
g
Norw ay
Slov ak R
epub lic
Swed en Italy
Hungar y
United S tates
Aust ralia
Aust ria
Turk ey
Switz erland
Czec h Repu
blic
Nether lands
New Z ealandJapan
Germ any
Belg ium
m
at
hem
at
ic
s s
cal
e
sc
or
e
Chapter 3: Student Proficiency in Reading Literacy
How Reading Literacy is Defined
Reading literacy as defined in PISA focuses on the ability of students to use written information in situations that they encounter, or may encounter, in their lives. Reading literacy is understanding, using and reflecting on written texts, in order to achieve one’s goals, to develop one’s knowledge and potential and to participate in society. This notion goes beyond the traditional notion of decoding information and literal interpretation of what is written, towards more applied tasks.
How Reading Literacy was Assessed in PISA 2003
The assessment of reading for PISA 2003, as in PISA 2000, was framed along three dimensions: the type of reading task, the form and structure of the reading material, and the use for which the text was intended. Three broad types of task were used. Some required the retrieval of information, others the interpretation of the texts, and others called for reflection and evaluation of the texts. The text forms themselves were classified as ‘narrative’, ‘expository’, ‘descriptive’, ‘discursive’, ‘instructive’, and ‘documentary’. Both continuous and non-continuous prose forms as well as charts, tables, diagrams, etc, were used. A wide variety of intended uses were covered under such categories as ‘personal use’, ‘occupational use’, and ‘reading for education’. Further discussion of how the assessment was constructed is to be found in Chapter 6 of the International Report and in more detail in the PISA 2003 Assessment Framework (OECD, 2003).
Reading literacy was the main topic in PISA 2000, but a minor one in PISA 2003. Twenty eight of the 132 items used in PISA 2000, constituted the test of reading in PISA 2003. These 28 items were carefully chosen to give as balanced a picture of attainment in reading literacy as could be achieved within the limitations imposed by the study design, while at the same time providing a sound cross-section of the items used in PISA 2000. Each of the three aspects of reading: ‘retrieval’, ‘interpretation’, and ‘reflection’ were covered; as was the full difficulty range of the PISA 2000 items.
How the Reading Literacy Results are Reported
The more limited scope of the PISA 2003 assessment restricts the reporting of the 2003 results to the single combined scale of attainment, and not the three distinct sub-scales also used in PISA 200010: ‘retrieving information’, ‘interpreting texts’, and ‘reflecting and evaluating texts’. Results are, however, still reported by overall proficiency levels as well as by a scale score.
Appendix C gives a summary of the descriptions of performance expected at each proficiency level, and the full definitions can be found in the international reports on PISA 200011. Descriptions of the lowest and highest proficiency levels are provided below for
illustration. Each test item used in PISA 2003 was matched to one of the six proficiency levels and students were then placed at a specific proficiency level depending on how they had answered the set of items allocated to this level. More specifically, a student was placed at a particular proficiency level if he or she could be expected to answer correctly at least 50% of a hypothetical range of items spread evenly across the difficulty range for that level.
10 A comprehensive treatment of performance in these three aspects of reading literacy can be found
At Level 5, the highest level:
“Students proficient at Level 5 on the reading literacy scale are capable of completing sophisticated reading tasks, such as managing information that is difficult to find in unfamiliar texts; showing detailed understanding of such texts and inferring which information in the text is relevant to the task; and being able to evaluate critically and build hypotheses, draw on specialised knowledge, and accommodate concepts that may be contrary to expectations.”
At Level 1:
“Students at Level 1 can recognise an author’s main theme or purpose in a text about a familiar topic, if this is prominent; they can make connexions between information in a text and common everyday knowledge; and they can locate one or more pieces of explicitly stated information in a text.”
The PISA 2003 results are scaled on the same scale as used in PISA 2000. This scale was set to a mean of 500 for the 27 OECD countries that participated in that study and a range such that two-thirds of students scored between 400 and 600. As the Slovak Republic and Turkey joined the OECD in 2003 and The Netherlands met all the technical standards in 2003, but not in 2000, and conversely for the UK, 29 OECD countries are now included in the PISA 2003 results. For these 29 countries, the overall OECD mean for reading literacy is 494, while the range remains unchanged.
Summary of Reading Results for the OECD and Scotland.
[image:30.595.77.524.425.730.2]Proficiency Levels
Table 3.1. Percentage of students at each level of proficiency on the reading literacy scale
Country Proficiency levels
Below level 1 (less than 335 score points)
Level 1 (from 335 to 407
score points)
Level 2 (from 408 to 480
score points)
Level 3 (from 481 to 552
score points)
Level 4 (from 553 to 626
score points)
Level 5 (above 626 score
points)
% S.E. % S.E. % S.E. % S.E. % S.E. % S.E. OECD Countries and Scotland
Australia 3.6 (0.4) 8.2 (0.4) 18.3 (0.6) 28.4 (0.8) 26.9 (0.8) 14.6 (0.7)
Austria 7.3 (0.8) 13.4 (1.0) 22.6 (1.0) 27.4 (1.0) 21.0 (1.0) 8.3 (0.8)
Belgium 7.8 (0.7) 10.0 (0.6) 18.2 (0.6) 26.0 (0.8) 25.4 (0.8) 12.5 (0.5)
Canada 2.3 (0.2) 7.3 (0.5) 18.3 (0.6) 31.0 (0.7) 28.6 (0.6) 12.6 (0.5)
Czech Republic 6.5 (0.9) 12.9 (0.9) 24.7 (1.0) 30.3 (1.3) 19.3 (1.1) 6.4 (0.6)
Denmark 4.6 (0.6) 11.9 (0.7) 24.9 (1.1) 33.4 (1.1) 20.0 (1.0) 5.2 (0.5)
Finland 1.1 (0.2) 4.6 (0.4) 14.6 (0.6) 31.7 (0.8) 33.4 (0.7) 14.7 (0.7)
France 6.3 (0.7) 11.2 (0.7) 22.8 (0.8) 29.7 (1.1) 22.5 (0.9) 7.4 (0.6)
Germany 9.3 (0.8) 13.0 (0.9) 19.8 (0.8) 26.3 (0.8) 21.9 (1.0) 9.6 (0.6)
Greece 10.2 (0.8) 15.0 (0.8) 25.0 (1.2) 27.3 (1.1) 16.8 (1.2) 5.7 (0.7)
Hungary 6.1 (0.7) 14.4 (0.9) 26.7 (0.9) 30.2 (1.1) 17.6 (1.1) 4.9 (0.6)
Iceland 6.7 (0.6) 11.8 (0.7) 23.9 (0.8) 29.7 (1.0) 20.9 (0.8) 7.1 (0.6)
Ireland 2.7 (0.5) 8.3 (0.7) 21.2 (1.2) 32.4 (1.3) 26.2 (1.2) 9.3 (0.7)
Italy 9.1 (0.9) 14.8 (0.8) 24.9 (0.8) 28.3 (1.0) 17.8 (0.7) 5.2 (0.3)
Japan 7.4 (0.8) 11.6 (0.8) 20.9 (1.0) 27.2 (1.1) 23.2 (1.1) 9.7 (0.9)
Korea 1.4 (0.3) 5.4 (0.6) 16.8 (1.0) 33.5 (1.2) 30.8 (1.1) 12.2 (1.1)
Luxembourg 8.7 (0.4) 14.0 (0.7) 24.2 (0.7) 28.7 (1.0) 19.1 (0.9) 5.2 (0.4)
Mexico 24.9 (1.5) 27.1 (1.2) 27.5 (1.0) 15.6 (1.0) 4.3 (0.6) 0.5 (0.1)
Netherlands 2.1 (0.5) 9.4 (0.9) 23.4 (1.1) 30.7 (1.3) 25.6 (1.1) 8.8 (0.7)
New Zealand 4.8 (0.5) 9.7 (0.6) 18.5 (0.9) 26.3 (0.9) 24.3 (0.9) 16.3 (0.8)
Norway 6.4 (0.6) 11.8 (0.8) 21.4 (1.2) 29.0 (1.0) 21.5 (0.8) 10.0 (0.7)
Poland 5.3 (0.5) 11.5 (0.7) 24.4 (0.8) 30.0 (0.9) 20.7 (0.9) 8.0 (0.6)
Portugal 7.6 (0.9) 14.4 (0.9) 25.9 (1.0) 30.5 (1.1) 17.9 (1.0) 3.8 (0.5)
***Scotland*** 2.6 (0.4) 8.2 (0.8) 21.2 (1.0) 33.0 (1.2) 26.0 (1.0) 9.0 (0.7)
Slovak Republic 8.0 (0.8) 16.9 (1.0) 28.4 (1.0) 27.7 (1.1) 15.4 (0.7) 3.5 (0.4)
Spain 7.4 (0.7) 13.7 (0.7) 26.1 (0.7) 29.6 (0.8) 18.2 (0.9) 5.0 (0.5)
Sweden 3.9 (0.5) 9.4 (0.7) 20.7 (1.0) 29.9 (1.5) 24.8 (1.2) 11.4 (0.7)
Switzerland 5.4 (0.5) 11.3 (0.7) 22.7 (1.1) 30.9 (1.4) 21.9 (0.9) 7.9 (0.8)
Turkey 12.5 (1.2) 24.3 (1.5) 30.9 (1.4) 20.8 (1.4) 7.7 (1.1) 3.8 (1.2)
United States 6.5 (0.7) 12.9 (0.9) 22.7 (1.1) 27.8 (1.0) 20.8 (0.9) 9.3 (0.7)
Figure 3.a. Percentage of students proficient at each level of reading literacy
Below Level 1 Level 1 Level 2 Level 3 Level 4 Level 5
Source: OECD PISA 2003
155 17 18 18 21 21 19 21 23 18 23 21 21 23 24 25 23 20 24