The career aspirations and other characteristics of
Australian para-professional engineering students
David Dowling
University of Southern Queensland dowling@usq.edu.au
Abstract: During 2010 more than 300 students currently studying a para-professional engineering course at an Australian institution completed an online questionnaire about their educational and work experiences, and their career aspirations. Students from vocational educational and training institutions, universities and two dual-sector institutions across Australia were invited to participate in the study.
This paper reports on a preliminary analysis of some of the raw data from 327
engineering students, 40% of whom are studying an Associate Degree course, 45% an Advanced Diploma, and 15% a Diploma. The key finding was that only 16% of the respondents intend to pursue a career as an Engineering Associate, with 75% indicating that they plan to undertake further studies, and 51% reporting that they have a career goal to become a Professional Engineer. These unexpected results challenge a long-held assumption that students in Australian Advanced Diploma and Associate Degree
programs will pursue careers as Engineering Associates.
Introduction
Many institutions within the Australian tertiary education system offer programs in para-professional engineering including Technical and Further Education (TAFE) institutions, universities, and dual sector institutions. Two types of award are recognised at this level, which is Australian Qualifications Framework (AQF) level 6: The vocational education and training (VET) Advanced Diploma and the higher education (HE) Associate Degree. Traditionally higher education awards have been provided by universities, both public and private, while vocational education and training awards have been provided by TAFE institutes and, more recently, registered training organisations (RTO). However, this distinction between the two sectors has become blurred over the last five years as some VET institutions now offer HE programs and some universities are registered as RTOs and offer VET programs.
The primary aim of these para-professional engineering programs is to provide graduates with the academic requirements for them to practice as an Engineering Associate. However, many institutions, like the University of Southern Queensland (USQ) seek to provide students with an educational platform from which they can articulate into higher level programs such as a bachelor of engineering. King (2008, p. 8) reported that this approach has wide support in the engineering sector:
‘In contemplating any major revisions to the engineering education system, all those consulted in the review agree that the system must allow students and graduates to transfer between qualification pathways with maximum efficiency, in terms of allowed credit and study duration.’
During the period between 2005 and 2008 the University of Southern Queensland experienced rapid, and unplanned, growth in the commencing enrolments in its two-year Associate Degree of
Engineering program. In 2008 the commencing enrolments in the program reached 337, nearly three times the annual average in the five year period up to 2005.
career aspirations. Two hundred and forty seven mainly off-campus distance education students completed the questionnaire during the period 2007-2009.
The results revealed that 63% of those students had a career goal to become a Professional Engineer, while only 13.4% intended to pursue a career as an Engineering Associates (Dowling, 2010a). This unexpected result challenged a long-held assumption that students in Australian programs at this level would pursue careers as Engineering Associates. If the findings from this USQ study are
representative of the career aspirations of all students in Australian Advanced Diploma and Associate Degree programs then they may have important implications for engineering workforce planning and employers who recruit Engineering Associates.
To test this hypothesis the author initiated a more extensive study into the perspectives, motivations and career aspirations of engineering students in Diploma, Advanced Diploma and Associate Degree programs at universities and VET institutions around Australia.
Research Questions
While the objectives of this study were based on the earlier study, they were broadened, to include aspects of VET education, and deepened, to gather more detailed information about some of the topics. These changes were made after extensive consultation with Engineers Australia staff and engineering teachers from VET institutions and universities. The main research questions for the project are:
1. Why did the students choose their current engineering program?
2. What educational and work experiences did the students have prior to entering their current program?
3. What type, and how much, work are students undertaking during their studies? 4. What role are the student’s employers playing in their studies?
5. What are the career aspirations of the students?
6. What is their understanding of the role of Engineering Associates?
There was widespread support for the study, particularly in the VET sector, because it seems that this is the first study to seek student perspectives on a range of issues relevant to their careers and their programs of study.
This paper reports on the results and preliminary findings for some of the research questions. Further analysis of the data is required before the answers to the remaining questions can be reported.
Methodology
During the period between November 2009 and March 2010 a questionnaire was developed to gather information regarding the background, motivations, career aspirations and expectations of para-professional engineering students enrolled in Advanced Diploma and Associate Degree programs at universities and VET institutions across Australia. Following the extensive consultation with the relevant stakeholders the final questionnaire had 51 short answer or multiple choice questions. They were arranged into seven sections, as follows:
x Section 1 and 2 contained ten questions regarding the students personal characteristics and educational background;
x Section 3 included eight questions pertaining to the student’s current institution, program and study mode;
x Section 4 had eight questions concerning the students current employment, and for those already working in the engineering industry, the types of support they received from their employer, and their prospects for career progression in their organisation at the completion of their program;
x Section 5 contained twelve questions about their reasons for choosing their current institution and program;
x Section 6 included six questions which explored their career aspirations; and
After extensive testing the online questionnaire for paraprofessional engineering students was deployed on the 30thof March 2010 for students in para-professional engineering programs at
Chisholm Institute of Technology, Canberra Institute of Technology, Central Queensland University, RMIT University, Southbank Institute of Technology, Sydney Institute (Ultimo Campus), the University of South Australia, and the University of Southern Queensland.
The questionnaire was taken offline on the 5thof April for a period of three days while the program was adjusted to correct an error in the data capture process for six of the questions. The questionnaire was redeployed on 8thApril and remained open until 9thof August. During this time the questionnaire was also made available to students from Central Institute, Western Australia, the Panorama Campus of TAFE SA, and Victoria University.
Results
A total of 327 valid student responses were received during the four month period that the
questionnaire was available online, with students from nine institutions completing the questionnaire. The number of responses for each question varies because:
x some questions were not relevant, for example, the on-campus students did not answer the questions about distance education; and
x some students chose not to answer some questions.
A supplementary survey was released to the one hundred students who completed the questionnaire prior to 5thApril as their response may have contained incomplete answers to six of the questions. Twenty one students completed these additional questions. For these six questions there are 248 complete responses. It should be noted that some of the six questions were not relevant for many of the students.
Demographics
[image:3.595.121.476.442.552.2]The majority of the participating students were male domestic students as shown in Table 1. Only 10.8 % of the students were female, and 12.4% were international students.
Table 1: The gender of domestic and international students
Gender
Domestic Students International Students Total
No. % of total No. % of total No. %
Female 31 9.8% 3 1.0% 34 10.8%
Male 245 77.8 36 11.4% 281 89.2%
Total 276 87.6 39 12.4% 315 100.0%
The ages of the students at the time they commenced their current program are shown by category in Table 2, which also shows the age profiles by study mode.
Table 2: Commencing age of students by study mode
Commencing Age On
campus
Off campus
All Modes
Less than 18 years old 2.8% 6.7% 5.8%
18 – 19 years old 18.1% 33.6% 30.4%
20 – 24 years old 20.8% 28.9% 27.0%
25 – 29 years old 9.7% 14.2% 13.2%
30 – 39 years old 34.7% 10.3% 15.6%
40 – 49 years old 11.1% 5.5% 6.8%
50 – 59 years old 1.4% 0.8% 0.9%
[image:3.595.144.449.603.759.2]Figure 1 shows the age profiles of four cohorts of students: On-campus students; off-campus students; full-time students; and part-time students. It clearly shows the differences in the age profiles of the students in each study mode, with the majority of on-campus students being less than 24 while the distance education students are spread across the age range with the largest group being in the 30-39 age category. As expected the profiles of the on-campus and full-time cohorts are similar, as are the profiles of the off-campus (distance education) and part-time students.
Figure 1: A comparison of the ages of on-campus, off-campus, part-time, and full-time students
Forty one percent of the students completed their secondary studies in a metropolitan school, 26% at a school in a regional city, 11% in a rural school, and 22% overseas. Forty-five percent of the students reported that they were eligible for entry into a bachelor of engineering program.
[image:4.595.73.522.520.744.2] [image:4.595.73.524.522.746.2]Fifty three percent of the students had previously studied at a university or VET institution. Table 3 shows the programs they had previously studied and whether they had completed those programs. The table clearly shows that only a small number of prior tertiary students transferred between sectors before commencing their current program.
Table 3: Previous studies by current program
Sector
Award Previously studied
Number of previous tertiary students by current program
Current
Associate Degree students
Current
Advanced Diploma students Completed Not Completed Completed Not Completed
HE
Degree 6 15 8 22
Associate Degree 1 8 0 2
HE Totals 7 23 8 24
VET
Advanced Diploma 4 2 3 11
Diploma 17 4 6 3
Certificate IV 20 2 9 3
Certificate III 21 0 22 1
Apprenticeship 18 0 9 1
VET Totals 80 8 49 19
Total number of students 87 31 57 43
0% 5% 10% 15% 20% 25% 30% 35% 40% 45%
Less than 18
18 - 19 20 - 24 25 - 29 30 - 39 40 - 49 50 - 59 60 or older
P
e
rcentag
e
of
Res
pondent
Age at Commencement
Part-time
Full-time
On Campus
Program
The students were asked to indicate the factors that influenced their decision to study engineering. They did this by selecting one of the following degrees of influence for each of the nine factors listed in the question: major influence; minor influence; no influence. They were also able to nominate another factor in the ‘Other’ category and nominate the degree of influence for that factor.
The major influences were: I like finding out how things work; I like building things; Good
employment opportunities;and Good pay when I graduate. Some students nominated the need to be challenged and the prospects of career progression in the ‘Other’ category as major influences on their decision to enrol in an engineering program. Surprisingly, recommendation by friends, family, employers, or careers advisors had the least influence on their decision.
The students were asked to indicate what they believe are the differences between an Advanced Diploma and an Associate Degree program by indicating whether they agreed or disagreed with five statements. The majority of students believe that, when compared to an Advanced Diploma, an Associate Degree encourages higher level thinking, is more employment orientated, and provides a better pathway to an engineering degree program. They also believe that an Associate Degree is less practical than an Advanced Diploma.
Forty percent of the respondents were studying an Associate Degree, with the remaining students studying for VET awards, 45% were studying an Advanced Diploma and 15% a Diploma. Forty percent of the students reported they were in civil engineering programs, 25% in mechanical or mechatronic engineering programs, 17% in electrical or electronic engineering programs and 17% were studying programs in other fields such as aerospace engineering, telecommunications engineering, and computer systems engineering.
The students were asked to indicate whether they were studying full-time or part-time. For the purposes of this survey students were advised that they were regarded as full-time students if they were enrolled in at least 75% of the subjects listed for the current semester or term. Sixty eight percent of respondents reported they were studying full-time.
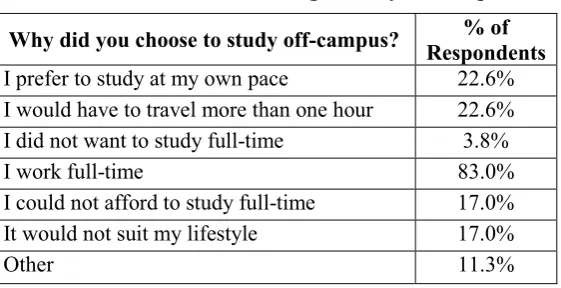
[image:5.595.160.441.514.658.2]Seventy eight percent of the students were studying on-campus and 22.1% were off-campus students studying via distance education or online. Those students who indicated that they were studying off-campus were able to specify the reasons for choosing this mode of study. They were able to select more than one of the options for this question. The results for this question are shown in Table 4.
Table 4: Reasons for choosing to study off-campus
Why did you choose to study off-campus? % of
Respondents
I prefer to study at my own pace 22.6%
I would have to travel more than one hour 22.6% I did not want to study full-time 3.8%
I work full-time 83.0%
I could not afford to study full-time 17.0%
It would not suit my lifestyle 17.0%
Other 11.3%
The most significant reason students gave for choosing off-campus study was their commitment to full-time work. It is also important to note that 17% of the students could not afford to study on-campus.
Employment
they were currently working in engineering. Table 5 shows the percentage of the employed students by ‘hours worked per week’ categories and the number of students in those categories for each of the study modes and patterns.
Table 5: The average number of hours worked per week
Average number of hours
worked each week Students% of all
The number of respondents by category Full-time Part-time On-campus Off-campus
5 - 9 hours 11.3% 32 5 32 5
10 - 14 hours 7.0% 23 0 22 1
15 - 19 hours 9.2% 27 3 28 1
20 - 24 hours 9.2% 24 6 27 3
25 - 29 hours 4.6% 12 3 15 0
30 - 34 hours 0.6% 2 0 2 0
35 - 39 hours 13.1% 11 32 22 21
40 - 45 hours 10.7% 0 34 9 25
More than 45 hours 5.5% 1 17 4 14
Totals 71.2% 132 100 161 72
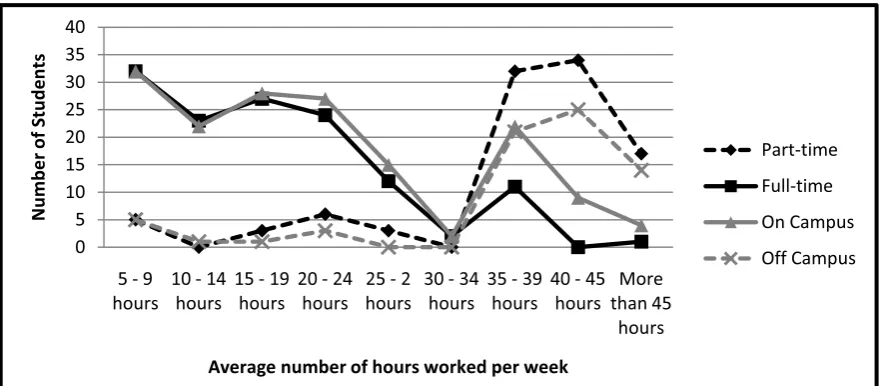
These data were used to produce the chart shown as Figure 2. The chart shows that up to the 24-29 hour category the hours worked by the students in each category would fit with expected patterns. The 30-34 hour category appears to a transition zone with few students reporting that they fit in this category. The results for the 35-39 hour category are unexpected and indicate some full-time students are also working full-time. Most of the students who reported that they work 40 or more hours per week fit into expected patterns, particularly those working more than 45 hours.
Figure 2: Hours worked by students by study patterns
Of the 95 respondents who were working in engineering, 72 stated that there was a career path for Engineering Associates in their organisation. The following roles were selected by more than 50% of these students as being available on their career path: Team leader; supervisor; project manager; and design supervisor. The students reported that the most common barriers to progression in their organisation were: The requirement for further engineering qualifications; the small size of the organisation; competition with other equally qualified graduates; and the male dominance of the profession.
0 5 10 15 20 25 30 35 40
5 - 9 hours
10 - 14 hours
15 - 19 hours
20 - 24 hours
25 - 2 hours
30 - 34 hours
35 - 39 hours
40 - 45 hours
More than 45
hours
Number of
S
tudents
Average number of hours worked per week
Part-time
Full-time
On Campus
[image:6.595.72.515.427.620.2]Eighty seven students reported that their employer supported them in their studies. The types of support the employers provided are shown in Table 6, which lists the number of students who selected each option –where students could select more than one option.
Table 6: Types of support provided to students by their employer
Type of support Number of students
Provides a mentor 22
Gives me time off for study and exams 67
Pays my program fees upfront 23
Refunds my program fees when I pass 32
Pays for my text books 22
Gives me time off to attend on-campus activities 34
Pays travel and accommodation costs when I attend on-campus activities 20
Career aspirations
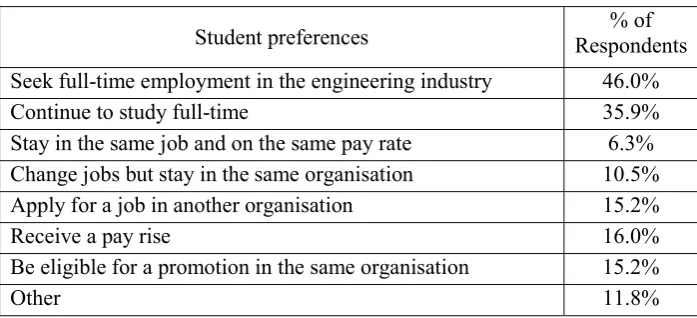
Table 7 provides an indication what the students plan to do when they complete their current program. They could select one or more of the options in the table. The most popular option listed in ‘other’ category was that they would seek part-time employment in the engineering industry while continuing to study full-time in another program.
Table 7: The students’ post graduation plans
Student preferences Respondents% of
Seek full-time employment in the engineering industry 46.0%
Continue to study full-time 35.9%
Stay in the same job and on the same pay rate 6.3% Change jobs but stay in the same organisation 10.5%
Apply for a job in another organisation 15.2%
Receive a pay rise 16.0%
Be eligible for a promotion in the same organisation 15.2%
Other 11.8%
Seventy five percent of the students stated that they plan to enrol in another tertiary program when they complete their existing program. Of these, the majority plan to enrol in other engineering programs such as a bachelor of engineering (57%) or a bachelor of engineering technology (12%).
Only 16.3% of the students stated that their career goal was to work as an Engineering Associate, the career their current program prepares them for. The career goals of the remaining students were to be a Professional Engineer (51.1%), a project manager (16.0%) or an Engineering Technologist (4.2%).
Discussion
The results of a preliminary analysis of the data gathered in this survey provide an insight into the perspectives of current Australian para-professional engineering students. The demographic data demonstrates the great diversity of the students undertaking para-professional engineering education programs in Australia. The students were drawn from rural, regional and metropolitan areas in Australia and from overseas countries. The educational background of the participants was also diverse, with 53% having previously studied at a university or VET institution and 35% indicating they were school leavers. Interestingly, 45% of the students chose to enrol in a para-professional program despite the fact they were eligible to study a bachelor of engineering program.
[image:7.595.123.472.356.515.2]on-campus students are working up to 25 hours a week and some between 30 and 40 hours per week. Further analysis of this data will be undertaken to identify the types of work being undertaken by these students and the programs they are enrolled in.
This study revealed that 75% of participating students plan to undertake further study and more than 50% of them have a career goal to work as a Professional Engineer. These results confirm the findings of the previous study of USQ Associate Degree students where it was found that nearly 81% of the participants planned to undertake further study and that nearly 63% of them had a career goal to work as a Professional Engineer (Dowling, 2010a). Time will tell whether they realise this goal.
The fact that so many students from diverse educational backgrounds aspire to embark on further study, particularly in a bachelor of engineering program, underlines the need for efficient articulation pathways. There will need to be greater collaboration between the higher education and vocational education sectors if this to be achieved (Dowling, 2010b).
Perhaps the most important finding was that only 16% of the students planned to work as an Engineering Associate which confirms the findings from the USQ study where less than 14% of the Associate Degree students planned to work as an Engineering Associate (Dowling, 2010a). With such a small number of students citing an Engineering Associate as their career goal, this could lead to skill shortages in this employment category.
Conclusion
The study described in this paper was undertaken to test if the findings from a smaller single institution study of the career aspirations of Associate Degree in Engineering students were
representative of the perspectives of engineering Associate Degree and Advanced Diploma students at other institutions across Australia.
The preliminary findings reported in this paper indicate that those findings were representative and that there is cause for concern about a number of issues relating to para-professional engineering education in Australia. The fact that only 16% of the students plan to work as Engineering Associates has implications for both engineering educators and employers. This finding, and the fact that 75% of the participants reported that they plan to undertake further study, should challenge engineering educators to review the aims of their para-professional programs. These findings should also challenge employers to take a more pro-active role in enhancing the careers of Engineering Associates to make them more attractive to the students in para-professional engineering programs.
References
Dowling, D. (2010a, July 2010). The career aspirations of Associate Degree students: Implications for
engineering educators and the profession. Paper presented at the EE2010 Conference: Engineering Education 2010 - Inspiring the next generation of engineers, Birmingham, UK.
Dowling, D. (2010b, December 2010). A review of para-professional engineering education in Australia: Exploring the VET-HE divide. Paper presented at the Australasian Association for Engineering Education Conference: AaeE 2010 Past, Present and Future, Sydney.
King, R. (2008). Engineers for the Future: addressing the supply and quality of Australian engineering graduates for the 21st century. Sydney.
Acknowledgements
The work reported in this paper was funded by a USQ Senior Fellowship and by the USQ IACT project. The author also acknowledges the assistance of Ms Megan Brodie in gathering and analysing the data.