After-school Science and
Engineering Clubs
Evaluation
Research Report DCSF-RW071
Ken Mannion
Centre for Science Education
Mike Coldwell
Research Report No DCSF-RW071
After-school Science and Engineering Clubs
Evaluation
Ken Mannion, Centre for Science Education
Mike Coldwell, Centre for Education and Inclusion Research
Sheffield Hallam University
Views expressed in this report are not necessarily those of the Department for Children, Schools and Families or any other Government department.
Acknowledgements
The authors of this report are:
Ken Mannion, Co-director, Centre for Science Education, Sheffield Hallam University
Mike Coldwell, Co-director, Centre for Education and Inclusion Research, Sheffield Hallam University
Centre for Science Education, Sheffield Hallam University (case studies)
Stuart Bevins Marilyn Brodie Jon Carpenter Richard Walton
Centre for Education and Inclusion Research, Sheffield Hallam University (all other elements)
Ning Tang Ruth Barley Caroline Cripps Mike Holland
1 Executive Summary ... 1
2 Introduction... 5
2.1 Key Points ...5
2.2 The programme...5
2.3 Programme aims...5
2.4 The policy context ...6
2.5 Aims of evaluation...8
2.6 Structure of report ...9
3 Methodology ... 10
3.1 Key Points ...10
3.2 Overall methodology ...10
3.3 Individual elements of the evaluation...12
3.4 Analysis...12
4 Profiles and Contexts... 14
4.1 Key Points ...14
4.2 School contexts...14
4.3 Club contexts ...16
4.3.1 Staffing ...16
4.3.2 Composition of Clubs ...17
5 Findings... 20
5.1 Processes and project focuses ...20
5.1.1 Selection ...20
5.1.2 Club organisation ...21
5.1.3 Engagement with other organisations and support...23
5.1.4 Celebration events ...26
5.1.5 Pupil views on club organisation ...26
5.1.6 Activities ...28
5.1.7 Competitions ...31
5.1.8 Links to classroom and teaching...31
5.2 Outcomes...33
5.2.1 For pupils ...33
5.2.2 For staff and school: individual staff...42
5.2.3 For staff and school: department level ...47
5.2.4 For staff and school: whole school level ...47
6 Discussion and Suggestions for Development ... 49
6.1 Key Points ...49
6.2 Teacher suggestions...49
6.3 Discussion...50
6.4 Barriers and promoters ...52
6.5 Suggestions for development: policy and implementation ...54
6.5.1 Setting up and running Clubs...54
6.5.2 Promoting enhancement and extension of the KS3 curriculum ...54
6.5.3 Creating increased impact on members ...55
6.5.4 Creating impact beyond Club sessions...55
7 References ... 56
1 Executive Summary
The project
Around 250 schools were funded from 2007-2009 to set up and run After School Science and Engineering Clubs (ASSECs) over two years. They aimed to:
● enhance and extend the Key Stage Three curriculum;
● improve attainment in, interactions with and experiences of science among those pupils
already showing interest and ability in these subjects;
● encourage these individuals to consider continuing their education in STEM; and
● improve collaboration between schools, and between schools and industry and the
research base.
A model hypothesising how enabling aims (iii and iv above) could lead to the realisation of the impact aims (i and ii above) was used to inform the methodology
Methodology
Multiple methods were used including:
• a two stage pupil survey in 50 schools, including both club members, and similar pupils who were not club members (reference group). Note, this was not a control group, so comparisons between club members and the reference group were useful but limited
• a survey of staff other than club leaders in these 50 schools
• a survey of all club leaders
• telephone interviews with club leaders of 20 schools
• case studies of 10 schools
• a brief survey of 20 schools that decided not to run clubs at all
In the event, 174 schools - 71% of the 245 schools which have ASSECs - were involved in the evaluation, including schools which participated in the club leaders survey (158), other club staff survey (22), two pupil surveys (47), club leaders' phone interviews (20) and case studies (10). In addition, 23 schools that decided not to set up a club were briefly asked about their decision.
School and Club Profiles and Contexts
Schools were deliberately targeted by the DCSF to be offered club funding if they were high achieving but had a ‘low conversion rate’ of those achieving Key Stage 2 level 5 Science to Key Stage 3 level 7. Consequently club schools had higher than average percentages of pupils obtaining 5 or more A*-Cs including English and Mathematics, and had more positive than average recent Ofsted reports. Overall, the schools that responded to the club leader survey were typical of the entire club school cohort, however, there was a slight bias in the pupil survey towards smaller schools (<1000 pupils).
Findings
Selection of pupils to join the clubs
• A large majority of schools (79%) used the identification of pupils as being gifted and talented as a recruitment tool, or used open ‘invitation’ methods (74%), with most schools using more than one method. Only 29% of schools used borderline level 6 to 7 (predictions of attainment in key stage 3 tests) as a criterion. Many club leaders
Club organisation
• Most clubs (79%) had a core membership that attended every session, whilst a few clubs (5%) invited additional pupils to specific sessions. A small minority (9%) had different sets of pupils for each activity. In some schools older pupils were used as mentors. Club activity programmes were mainly developed by teachers, although in a minority of cases, pupils' ideas were taken into account.
Engagement with other organisations and support
• Museums and similar venues were most popular with clubs in terms of organising visits, with businesses being the main source of visitors to schools. The motivational value of events such as competitions was recognised, although in a minority of schools there was a view that the required time commitment was problematic.
• Most rural schools had not recognised the potential of agriculture and the rural economy as being suitable examples of STEM (Science, Technology, Engineering and
Mathematics) business.
• The good practice workshops (organised by the Science, Technology Engineering and Mathematics Network or STEMNET) provided the most opportunity for school
interaction, being attended by over 50% of schools but other inter-school links were scarce. Schools valued the BA (British Association for the Advancement of Science) and STEMNET web resources available to support clubs, although a minority of schools were not aware of their existence. Support, where accessed, from SETPOINTs, and the role of the STEMNET regional directors, was valued.
Pupil views on club organisation
• The majority of pupils (80%) thought their club was well organised and over 90% thought that they did interesting things in the club, and the majority of pupils' views about their involvement in their club became more positive the longer they had been a member.
• Most pupils thought they had developed their understanding of what engineers and scientists do (69% and 75%), although most discussions with pupils during case study visits revealed a lot of ongoing misconceptions. More pupils thought the club had helped their understanding of science (64%) and design and technology (D&T) (49%) than mathematics (40%).
Activities and competitions
• The most popular activities (all carried out in 50% or more of schools) were energy and environment, flight and/or rockets, building (and sometimes racing) cars, robotics and electronics. Other research evidence1 shows that prevalence of ‘cars and rockets’
activities may be counterproductive with girls
• The majority (62%) of schools had run between 3 and 6 different club topics. Almost all schools (98%) had organised some form of celebration event.
Impacts on pupils
• The vast majority of club leaders and other staff saw improvements in practical skills, self-confidence and thinking skills of pupils. A significant majority also noted changing attitudes to and understanding of science, maths and engineering. However, when asked about outcomes relating to achievement, a small majority (e.g. 56% for science) were unsure whether there had been any change, and a small minority (e.g. 3% for science) disagreed that pupils were showing improved achievement, whilst 4% of leaders strongly agreed, and 38% agreed, that pupils were achieving higher in science.
• Pupils who participated in the clubs were, perhaps unsurprisingly, more likely to have positive attitudes to learning related to science and engineering, compared with the reference group, and were more likely to have sustained their interest and enjoyment in science over time. This was particularly true for girls and Year 8 and 9 pupils. Club members were more likely than reference group pupils to state they intend to carry on in education post-16 and go to university.
• Both club members and the reference groups showed a marked preference for studying science post 16 and at university compared with engineering or mathematics. Very low numbers of girls (club members and reference groups) intended to study engineering. However, where it was possible to match pupil responses to the two surveys, the evaluation team found that club members were more likely to have become more positive towards studying engineering at university compared with reference group members, and this was particularly true for girls and Year 9 pupils.
• The pupil surveys suggest that club members are more interested in future science and engineering careers compared with the reference group pupils. Again, girls showed far less interest in engineering as a career. Girls were more likely to have become more positive as a result of club membership about wanting to become a scientist compared with the reference group.
Impacts on club leader and other staff
• Significant majorities of club leaders identified new equipment, better understanding of the STEM agenda, increased STEM profile in school, enhanced collaboration within and between departments, and between parents and schools, and enhanced classroom practice as being benefits of club activity.
• Around half of other staff involved in the clubs had received training for their
involvement. Involvement in clubs increased other staff members’ perceived level of understanding of science and engineering careers and the STEM agenda, and the majority of respondents indicated their enthusiasm for STEM subjects had grown through involvement in their club.
• There had been a positive impact on staff-pupil relationships, and over half of the club leader respondents indicated a positive impact on their classroom practice and on their subject knowledge. A majority of these respondents indicated an increase in
co-operation within and between departments. A large minority of staff identified time to prepare for and to run clubs as the biggest challenge.
Other impacts on the school
Case Studies
• The case studies looked in more detail at 10 schools, and these sought to identify contextual factors that may affect how clubs were run, and club impact. In all case studies, the hypothesis that enabling aims (aims 1 and 2) led to the achievement of impact aims (aims 3 and 4) was supported providing strong confirmation that the programme is able to generate at the least short-term outcomes of increased engagement, enjoyment and enthusiasm.
• Club activities that allow pupils to think creatively and work independently create the biggest positive impact on attitudes, as does including pupils in decision making and choice of activities. Transferring club practice into normal teaching sessions was not evident in case study schools, possibly due to the short period clubs had been in operation.
Discussion and Suggestions for Development
• Evidence from all strands of the evaluation show that the aims of the programme are being achieved. However, more positive effects have been seen for science than for mathematics and engineering.
• Some schools have not recognised the availability of support from the clubs website and promotion of the site may need to be improved.
• Management support for clubs is important if they are to have impact in the wider school beyond club sessions.
• Club activities need to be chosen along the interests of the target group to ensure clubs retain their membership e.g. a prevalence of ‘cars and rockets’ activities may be
counterproductive with girls.
• STEMPOINT brokerage activity has the potential to address issues of under-utilisation of external resources (e.g. SEAs, visits, enhancement and enrichment schemes).
• Good practice case studies, coupled with CPD, can address issues such as equality and diversity stereotyping, effective management of club activity, and the use of agriculture and the rural economy as a STEM context.
• There is a need for more Mathematics activities for clubs.
2 Introduction
2.1 Key Points
Around 250 schools were funded from 2007-2009 to set up and run After School Science and Engineering Clubs (ASSECs) over two years.
They aimed to:
• enhance and extend the Key Stage Three curriculum;
• improve attainment in, interactions with and experiences of science among those pupils already showing interest and ability in these subjects;
• encourage these individuals to consider continuing their education in STEM; and
• improve collaboration between schools, and between schools and industry and the research base.
A model hypothesising how enabling aims (iii and iv above) could lead to the realisation of the impact aims (i and ii above) was used to inform the methodology
2.2 The programme
The After School Science and Engineering Clubs (ASSEC) programme was established in England following the commitment made in the March 2006 in the Ten Year Science and Innovation Investment Framework 2004-2014: Next Steps.
It is intended that the clubs will contribute to ensuring that the UK has a strong supply of people with STEM skills and to improve young peoples’ engagement and interaction with STEM. The Chancellor of the Exchequer committed £5 million to establishing 250 schools to set up and run Science and Engineering Clubs over two years. (2007-09).
As part of the October 2007 pre-budget report and comprehensive spending review
statement, the Government announced plans to fund a further 250 schools through the Science and Engineering Clubs programme. This second cohort of club schools will commence in September 2008.
The ASSEC programme has been managed on behalf of the DCSF by STEMNET, with further support from the British Association for the Advancement of Science (the BA), the national network of Science Learning Centres, and the Specialist Schools and Academies Trust.
2.3 Programme aims
The clubs aim to:
• enhance and extend the Key Stage Three curriculum;
• improve attainment in, interactions with and experiences of Science among those pupils already showing interest and ability in these subjects;
• encourage these individuals to consider continuing their education in STEM; and
• improve collaboration between schools, and between schools and industry and the research base.
2.4 The policy context
Prior to the Roberts Review, SET for Success (HMT/Roberts, 2002), which looked at the
national situation regarding the supply of scientists and engineers in the UK, a complete picture had not been constructed of the problem of declining progression into STEM subjects. A key aspect of the Review was its focus on the whole supply chain, starting with school STEM education, and leading ultimately through to highly qualified research scientists and engineers working in research and industry. The problem that stimulated the review was not new. Ever since the rise of the ‘industrialised society’ in the nineteenth century, Britain has had problems producing the right number of scientifically and technically capable people, compared to its competitors (Burgess, 1985). However, the seismic shifts in the global economy occurring in the late 20th century and the increasing importance of Science-based innovation in ensuring national competitiveness set a difficult-to-ignore alarm bell ringing. The most coherent response to the issue was captured in Sir Gareth Robert’s seminal report, and in the various responses from government, particularly the 2004-2014 Science and innovation investment framework (H.M.Treasury, DTI, DfES 2004)), and the Next Steps March 2006 update of policy. The latest statement on STEM policy, Race to the top (Sainsbury, 2007) reiterates and expands on these points.
The Roberts Review cited evidence of increasing attainment in STEM subjects, but of ongoing decline in progression into the study of STEM subjects and careers.
'There is much concern that, during their time in school and further education, pupils are turning away from the study of Science, technology, Engineering and Mathematics. This is a significant factor in explaining the difficulties experienced by employers in recruiting people with high level Science and Engineering skills.' (Roberts, 2002, p33)
Some commentators have argued that market forces, e.g. increasing salary levels in STEM employment, or importing skills from abroad, were more likely to provide solutions to the STEM skills shortage (Shamos, 1995 - cited in Osborne et al 2003). This has been a widely held view in some sections of the Science education academic world. However, Osborne goes on to cite evidence of a direct link between national prosperity, and the proportion of Science and
Engineering graduates in a population (Osborne et al 2003)2, which suggests that it would be
foolhardy not to address the identified problem of the ‘drift away’ from STEM subjects at school. The Roberts Review identified a number of significant issues that need to be addressed to reverse the decline in progression rates. These include:
• Shortages in the supply of Science and Mathematics teachers
• Out of date scientific laboratories and equipment
• The ability of courses to inspire and interest students
• Ineffective or inadequate careers advice and guidance
He went on to make a series of recommendations, which provide the main thrust of the policy initiatives described in 2004-14 Investment Framework document, with further impetus provided by Next Steps (2006).
Coherence and co-ordination in STEM support: demand side, and supply side
Implementation of many of the recommendations and policy initiatives as set out in the 2004-14 Science and innovation investment framework, and the Next Steps policy update is now
underway, based on the STEM Programme Report (DTI, DfES, 2006). A forward plan, taking the Actions set out in the STEM report, is now being implemented, structured around a series of 11 Action Programmes, as identified in Race to the top (Sainsbury, 2007).
Box 1.1
Action Programmes to raise standards and increase equality and diversity through
Recruitment of Teachers and Lecturers
AP1 Improving the recruitment of teachers and lecturers in shortage subjects Lead Organisation: TDA
Continuing professional development of teachers and lecturers
AP2. Improving teaching and learning through CPD for Mathematics teachers Lead Organisation: NCETM
AP3. Improving teaching and learning through CPD for Science teachers Lead Organisation: National Science Learning Centre
AP4. Improving teaching and learning by engaging teachers with Engineering and technology Lead Organisation: RAEng
Enhancing and enriching the curriculum, both inside and outside the classroom, to motivate students towards STEM
AP5. Enhancing and enriching the Science curriculum Lead Organisation: SCORE AP6. Enhancing and enriching the teaching of Engineering and technology across the curriculum Lead Organisation: RAEng
AP7. Enhancing and enriching the teaching of Mathematics Lead Organisation: ACME
AP8. Improving the quality of advice and guidance for students (and their teachers and parents) about STEM careers, to inform subject choice Lead Organisation: The National STEM Careers Co-ordinator (at Sheffield Hallam University)
AP9. Widening access to the formal Science and Mathematics curriculum for all students, including access to triple Science and second Mathematics GCSE Lead Organisation: DCSF
AP10. Improving the quality of practical work in Science Lead Organisation: SCORE Improving infrastructure and delivery mechanisms
AP11 Programme to build capacity of the national, regional and local infrastructure Lead Organisation: DCSF
These initiatives are designed to impact positively on a variety of measurable factors, but all lead to two key indicators; improvements in pupil attainment, and improvement in progression rates into post-compulsory school study of STEM subjects and careers, including teaching. These have long been national priorities. Improvement in attainment, in all subjects, has been a constant theme of government policy for many years and some success has been achieved in terms of a general year-on-year rise in key stage assessment results and GCSE pass rates. However, and paradoxically, this has been achieved against a backdrop of an ongoing decline in the popularity of careers and qualifications in STEM subjects, in particular the physical Sciences, Engineering and Mathematics. More pupils are gaining A and A* grades in Science and Mathematics, but fewer of them are choosing these, or STEM subjects in general, post 16. This twin indicator approach is reflected in the two impact aims for the Initiative, that is,
• improving attainment in, interactions with and experiences of Science among those pupils already showing interest and ability in these subjects;
• encouraging these individuals to consider continuing their education in STEM.
• enhancing and extending the Key Stage Three curriculum;
• improving collaboration between schools, and between schools and industry and the research base.
Clearly, it is not as simple as this, but this mutually supportive relationship between enabling aims and impact aims provided a simple foundation upon which the evaluation has been built. Interestingly, much effort is being put into rationalising the supply side of the STEM Market to make it more intelligible to teachers. The ASSEC initiative provides a way for the demand side to become more effective in making use of that market, through the potential for schools to develop more coherent STEM policies and practices. Investigating the degree to which schools are maximising their involvement in the Initiative in this way has been an important aspect of the evaluation, as it would be an indicator of longer term sustainability of the uptake of STEM interventions, including but not restricted to ongoing club involvement.
2.5 Aims of evaluation
At an early point, the evaluation team interpreted the DCSF’s aims for ASSEC in order to construct a hypothesis that the team believe the initiative is setting out to test. That is, After School Science and Engineering Clubs (involving E&E activity and collaborations with external organisations) will increase pupil attainment and positive disposition to STEM progression.
Enabling aims Mechanism Impact aims
Enhancing and extending the
Key Stage Three curriculum
Improving attainment in, interactions with and
experiences of Science among those pupils already showing interest and ability in these subjects
ASSEC Improving collaboration
between schools, and
between schools and industry and the research base
Encouraging these individuals to consider continuing their
education in STEM
Including the supplementary issue of barriers to setting up such clubs, the team interpreted the DCSF’s requirements as requiring 3 evaluation elements:
1) A process evaluation (focussing on Enabling aims), to produce realistic recommendations about
a) best practice; and
b) consequent recommendations for an envisaged wider roll out of this initiative, in coming years.
2) Pupil progress as determined by
a) the professional judgement of teachers and others; b) intended subject choice at GCSE and A-Level c) Attitude of pupils to STEM subjects;
d) Attitudes to future careers in STEM areas;
e) Changes in any other general attitudes towards school, work, education etc. 3) An identification of barriers to schools’ participation in the scheme
These elements should combine to answer 3 research questions:
b) What are the impressions of those running and/or leading the clubs on the impact that they are having in terms of attainment and confidence in STEM subjects and the later choice of STEM subjects? (To be answered via element 2)
c) What other effects have ASSECs had on practitioners within the schools? (To be answered via element 1).
Given the open system nature of the ASSEC initiative, that is, each club will have unique characteristics (club format, school background, participating subjects, involvement with external organisations etc) the evaluation team have tried to contextualise the answer(s) to the question what works, to create a what works, for whom, in what circumstances, and to what outcomes?, through the use of a methodological mix involving quantitative as well as qualitative analysis.
2.6 Structure of report
3 Methodology
3.1 Key Points
Multiple methods were used including:
• a two stage pupil survey in 50 schools, including both club members, and similar pupils who were not club members (reference group). Note, this was not a control group, so comparisons between club members and the reference group were useful but limited
• a survey of staff other than club leaders in these 50 schools
• a survey of all club leaders
• telephone interviews with club leaders of 20 schools
• case studies of 10 schools
• a brief survey of 20 schools that decided not to run clubs at all
• In the event, 174 schools - 71% of the 245 schools which have ASSECs - were involved in the evaluation, including schools which participated in the club leaders survey (158), other club staff survey (22), two pupil surveys (47), club leaders' phone interviews (20) and case studies (10). In addition, 23 schools that decided not to set up a club were briefly asked about their decision.
3.2 Overall methodology
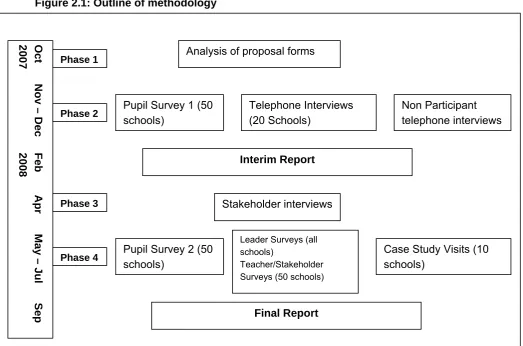
[image:14.595.36.560.401.747.2]The evaluation team implemented an inter-related, multiple method methodology. The methodology and sampling strategies that were initially proposed are summarised in Figures 2.1 and 2.2 below.
Figure 2.1: Outline of methodology
Phase 4 Phase 3 Phase 2 Phase 1
2007
2008
Oct
Nov – Dec
Feb
Apr
May – Jul
Sep
Final Report Interim Report
Pupil Survey 2 (50
schools) Teacher/Stakeholder Surveys (50 schools) Leader Surveys (all
schools) Case Study Visits (10
schools)
Non Participant telephone interviews
Stakeholder interviews Telephone Interviews (20 Schools)
Pupil Survey 1 (50 schools)
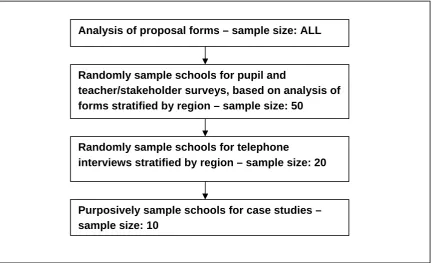
As Figure 2.1 indicates, a 4 phase study was undertaken. The Research Brief reported on data collection for phases 1 and 2. This final report utilises data from these earlier phases, and integrates them with findings from phases three and four. Figure 2.2 outlines the sampling strategy.
Figure 2.2: Outline of sampling strategy
Randomly sample schools for pupil and
teacher/stakeholder surveys, based on analysis of forms stratified by region – sample size: 50
Randomly sample schools for telephone
interviews stratified by region – sample size: 20
Purposively sample schools for case studies – sample size: 10
Analysis of proposal forms – sample size: ALL
[image:15.595.73.510.130.393.2]To gain the initial sample of 50 schools, the team created a matrix of schools involved in the programme (using data from proposal forms) according to region and prior involvement in a club. The team also took account of whether pupils were mainly selected or the club was open o all in our sampling. The team then randomly ordered the schools in each ‘cell’ of the matrix, and invited schools, starting at the top of the order, to take part in the pupil (see Phase 2 and Phase 4) and other staff survey (see Phase 4) elements of the evaluation. This enabled the team to create a stratified random sample of 50 schools in this way.
Table 2.1 Summary of evaluation methodology
Evaluation method Total schools invited (n)
Schools participating(n)
% response rate
Individuals participating
(n)
Club leaders' survey 245 158 65% 158
Other club staff survey 45 22 49% 53
1st pupil survey 50 45 90% 1019
2nd pupil survey 45 37 80% 1068
Both pupil surveys 45 34 76% 603*
Club leaders' phone interviews
20 20 100% 20
Non-participant telephone survey
43 23 53% 23**
Case study visits 10 10 100% 75
* 603 pupils stated to have participated in both surveys; 421 returned completed questionnaires for both surveys.
Table 2.1 indicates the extent of coverage achieved in the evaluation. In fact, overall, 174 schools - 71% of the 245 schools which have Science and Engineering Clubs - were involved in the evaluation, including schools which participated in the club leaders survey (158), other club staff survey (22), two pupil surveys (47), club leaders' phone interviews (20), case studies (10). In addition, 23 schools which had not set up a Science and Engineering Club participated in the non-participant telephone survey.
The evaluation also involved in a significant number of pupils, both club members and
members of the reference group: 1019 for the first pupil survey and 1068 for the second (Table 2.1). Among the pupil survey participants, 603 stated that they participated in both surveys, although only 421 returned completed questionnaires for both surveys.
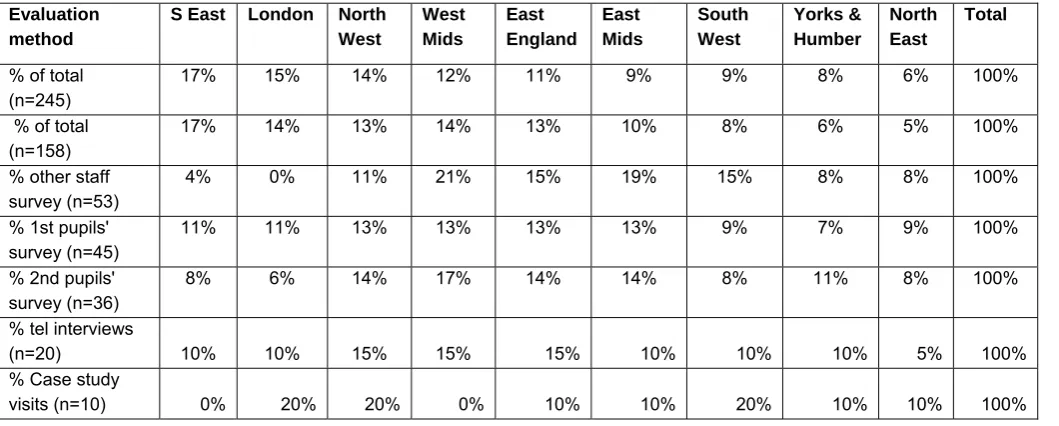
[image:16.595.45.575.272.485.2]Table 2.2 below indicates that the club leader survey was broadly representative by region. South East and London clubs were under-represented in most other elements of the research; otherwise, there was no systematic under or over-representation of schools in particular regions.
Table 2.2: Regional distribution Clubs
Evaluation method
S East London North West West Mids East England East Mids South West Yorks & Humber North East Total
% of total (n=245)
17% 15% 14% 12% 11% 9% 9% 8% 6% 100% % of total
(n=158)
17% 14% 13% 14% 13% 10% 8% 6% 5% 100% % other staff
survey (n=53)
4% 0% 11% 21% 15% 19% 15% 8% 8% 100%
% 1st pupils' survey (n=45)
11% 11% 13% 13% 13% 13% 9% 7% 9% 100% % 2nd pupils'
survey (n=36)
8% 6% 14% 17% 14% 14% 8% 11% 8% 100%
% tel interviews
(n=20) 10% 10% 15% 15% 15% 10% 10% 10% 5% 100% % Case study
visits (n=10) 0% 20% 20% 0% 10% 10% 20% 10% 10% 100%
3.3 Individual elements of the evaluation
For detailed information about the individual elements of the evaluation please see Annex 1.
3.4 Analysis
A discussion of the analysis of the first phase of pupil questionnaires, the telephone interviews and the non-participant interviews is included in the interim Research Brief.
For the leader survey, data were input to SPSS and frequency tables or charts generated for all questions. All relevant results are presented as percentages with total numbers annotated. For analysis of the club projects the evaluation team also used Excel, conducting some bivariate analyses, but variable and often low numbers for individual responses precluded reliable statistical analysis in many cases.
Quantitative data collected from the pupil surveys was input in an SPSS dataset for each of the two surveys. The pupil surveys are analysed and presented in two forms here. First, the team include a comparison of responses across the entire group at point one and point two,
both questionnaires, the team conduct an analysis of changes in expressed views at the two survey points. This gives a more robust picture of change, although given that the surveys were completed at an early point in the programme - but not before the programme began - this analysis is likely to underplay some real changes that are related to engagement in the programme. Together with the other data sources, however, these two analyses reveal a rounded view of impacts from a range of viewpoints and data sources.
For the wider staff survey, quantitative data were inputted to SPSS and frequency tables or charts were generated for all questions comparing data from teaching staff and non-teaching staff. Due to the small numbers of respondents all relevant results are presented as values. Variable and often low numbers for individual responses preclude reliable statistical analysis. Qualitative data were collated under a number of broad headings and analysed using a thematic approach.
4 Profiles and Contexts
4.1 Key Points
Schools were deliberately targeted by the DCSF to be offered club funding if they were high achieving but had large numbers of level 5 to level 7 non-conversions.
Consequently club schools had higher than average percentages of pupils obtaining 5 or more A*-Cs including English and Mathematics, and had more positive than average recent Ofsted reports.
Overall, the schools that responded to the club leader survey were typical of the entire club school cohort, however, there was a slight bias in the pupil survey towards smaller schools (<1000 pupils).
4.2 School contexts
School profiles were created for all 243 schools that completed the ASSEC proposal process to the specified time limits. In addition to this, two other schools took part in the leader's survey but were not included in our school profile sample as the evaluation team do not have access to their proposal information. Schools were deliberately targeted by the DCSF to be offered club funding if they were high achieving but had large numbers of level 5 to level 7 non-conversions.
The following data were collected for all 243 schools:
• school name
• region
• school specialism
• location
• admissions type
• selective status
• age range, size
• gender mix
• percentage obtaining 5 A*-C's at GCSE or equivalent
• percentage obtaining 5 A*-C's including Mathematics and English
• attendance data
• overall Ofsted judgements
These data were collected from ASSEC proposal forms and online resources (schools' own websites, schoolsnet, DCSF and Ofsted websites) and inputted to SPSS. Frequency tables were generated for all variables.
As can be seen from Table 2.2, our survey sample was spread across all 9 regions in England. Overall our sample was distributed proportionately. All schools were asked to take part in the leaders' survey and a regionally stratified sample of 50 schools was created for the other staff survey as well as both pupil surveys.
The location of the respondents who took part in the leader and pupil surveys are representative of our overall sample (see table 3.1 in Annex 3).
'Getting home is an issue. When we set up the club we had to make sure the kids were aware that we could provide transport. And we do provide transport for about a third of the group. That comes out of the budget. If we hadn't set that up I don't think we would have got half the
applicants we did get, because most of the students are bussed in the morning and back again at night. So we did have to offer that, being in a rural school. I don't think being a rural school influences what we do in the club, I think what we've been doing is such a general topic it would apply no matter where you are. We don't really consider where we are in terms of what we do, we just think of what would interest the students.' School 7
While the rural location of the above school has not influenced the focus of the club or type of activities run funding has given schools in deprived, urban areas the opportunity to run activities and go on trips which previously would not have been possible:
'[This is an] urban deprived area so children can't go on trips, pay for activities. Funding has allowed club to run different activities which school wouldn't normally be able to run.' School 12
The geographical location of schools has posed different challenges to clubs. Clubs have responded to these challenges in different ways dependant on their particular environments.
Table 3.2 (which can be found in Annex 3) indicates that each of our survey samples is broadly representative of the overall sample of all clubs in terms of admissions type. It does indicate, however, that the clubs engaged in the programme are more likely to be Foundation or Voluntary Aided schools, and less likely to be Community schools.
Similarly, our survey samples are representative of the overall sample in terms of the selective status of schools (see Table 3.3 in Annex 3). However, selective schools are over-represented significantly in the schools with clubs.
Table 3.4 (which can be found in Annex 3) shows that 47% of our overall sample had a STEM specialist status, in line with national figures for all secondary schools. The respondents of our leader survey are broadly representative of this with 50% of schools having a STEM
specialism. However STEM specialist schools are over represented in our other 3 surveys. Table 3.5 (which can be found in Annex 3) shows that the leader survey sample is
representative of the overall sample in terms of school size, but it should be noted that the largest and smallest schools are under-represented in the pupil and other staff surveys. Sizes of schools with clubs are broadly representative of all secondary schools in England.
Table 3.6 (which can be found in Annex 3) shows that the majority of the schools (79%) in our overall sample are mixed. The remainder are split relatively evenly between Boys’ schools (9%) and Girls’ schools (11%). All four of our surveys reflect this. The proportion of schools with clubs that are single sex is well above the proportion nationally. Since single sex schools are much more likely to be selective than mixed schools3, this is in line with the over-representation
of selective schools in the sample of schools with clubs noted above.
To give an indication of the representativeness of the samples in terms of attainment (measured by the percentage of the cohort obtaining five or A* to Cs including Mathematics and English at GCSE or equivalent) and attendance (measured by overall percentage absence), the team utilised published DCSF performance tables data for 2007. Table 3.7 (which can be found in Annex 3) shows that the data for all aspects of the research were close to the figures for all clubs, with only the other staff survey and Pupil survey w showing a slight mismatch. The overall data for clubs shows that the schools with clubs had similar attendance to schools across England, but were higher performing, by an average of 12.5 percentage points. This is not surprising as schools were deliberately targeted by the DCSF to be offered club funding if they were high achieving but had large numbers of level 5 to level 7 non-conversions.
In examining Ofsted judgments (Table 3.8 in Annex 3), it can be seen that, as with other aspects our research, the leader survey is representative of the overall sample. The judgements of the schools with clubs when compared with judgements for all secondary in England 2007/8 indicate that the schools with clubs are judged to be performing better, on average, than secondary schools in England.
4.3 Club contexts
4.3.1 Staffing
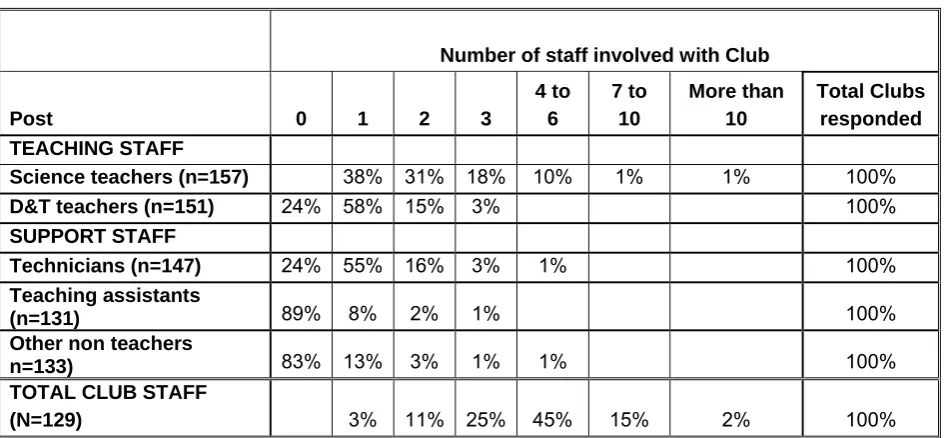
[image:20.595.71.544.263.482.2]Table 3.1 below indicates the spread of staff across clubs. All clubs included Science teachers, with over 10% including 4 or more. 75% involved D&T teachers, but in most cases this was just one teacher. Similar numbers involved technicians, but very few involved other support staff. Typically, a club involved 4-6 staff, with 97% involving more than one member of staff.
Table 3.1 Number of different types of staff involved with each Club
Number of staff involved with Club
Post 0 1 2 3
4 to 6
7 to 10
More than 10
Total Clubs responded
TEACHING STAFF
Science teachers (n=157) 38% 31% 18% 10% 1% 1% 100%
D&T teachers (n=151) 24% 58% 15% 3% 100%
SUPPORT STAFF
Technicians (n=147) 24% 55% 16% 3% 1% 100%
Teaching assistants
(n=131) 89% 8% 2% 1% 100%
Other non teachers
n=133) 83% 13% 3% 1% 1% 100%
TOTAL CLUB STAFF
(N=129) 3% 11% 25% 45% 15% 2% 100%
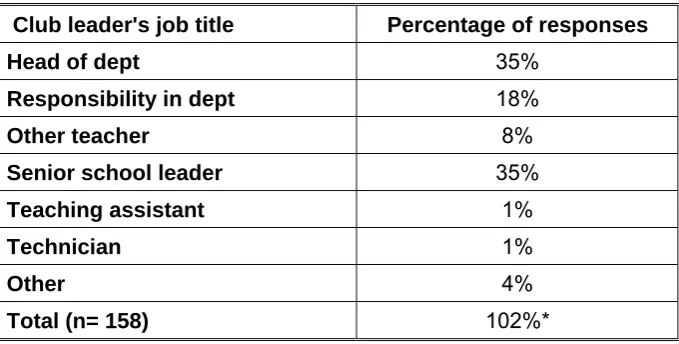
Table 3.2 Club leader roles
Club leader's job title Percentage of responses
Head of dept 35%
Responsibility in dept 18%
Other teacher 8%
Senior school leader 35%
Teaching assistant 1%
Technician 1%
Other 4%
Total (n= 158) 102%*
*% are rounded up to the nearest whole number
Of the 53 staff who took part in the additional staffing survey, the majority (74%) of responses were received from Science departments, one response was received from a teaching
assistant working across departments and the remaining 25% were received from people working within other STEM departments. As with the leader survey, this revealed a difference when compared with the intentions laid out in the proposal forms regarding collaboration with departments out with the STEM subjects, in which 14% of schools stated on their proposal forms that they were planning on involving teaching staff who worked out with STEM departments. These other departments included Geography, Art, English and Religious Studies, all of which have important and stimulating connections with Science. Of course, our finding does not necessarily mean that non-STEM staff are not involved in ASSEC clubs, but rather that they did not respond to our survey. 36 responses were received from teaching staff with the remaining 17 from non-teaching staff.
4.3.2 Composition of Clubs
Figure 3.1 indicates that, from the leaders' survey, there were 19 girls' schools, 14 boys'
Figure 3.1: Proportions of boys and girls in individual Science Clubs (%)
Table 3.3 Characteristics of pupil survey respondents
First survey (n=1019)
Year group Year 7 Year 8 Year 9
% 17 54 29
Gender Boy Girl
% 49 50
Ethnicity White Black Asian Mixed Other NA
% 85 2 4 5 1 3
Free school meal Yes No DK NA Club member Class
% 6 92 2 0 5 7
Science Club member Yes No NA Boys Girls
% 48 49 4 56 43
Second survey (n=1068)
Year group Year 7 Year 8 Year 9
% 26 46 28
Gender Boy Girl
% 47 52
Ethnicity White Black Asian Mixed Other NA
% 85 2 4 4 1 3
Free school meal Yes No DK NA Club
member
Class
% 4 92 3 1 5 4
Science Club member Yes No NA Boys Girls
% 47 52 1 54 45
Participated in the first pupil survey
Yes (n=603) No NA
% 57 40 4
Time in ASSEC (n=500) <1 month 1-3 months
4-6 months
7-12 months
>12 months
% 3 7 18 59 13
In the first pupil survey, nearly equal numbers of club members and reference groups
completed the questionnaire, but slightly more reference group pupils took part in the second. Over half of the first survey respondents (54%) and 46% of the second survey respondents were in Year 8, though the second survey had 9% more Year 7 pupils, compared with the first survey. Amongst the total respondents of the first survey there is an almost equal gender distribution, whereas slightly more girls than boys participated in the second survey. However within the Science clubs, there are more boys. This is consistent with the findings from the club leader survey (see Figure 3.1) suggesting a slightly unbalanced gender composition in the clubs with more boys (53%) than girls (47%) taking part in the programme nationally.
Looking at the ethnic balance of respondents, the majority of respondents (88.8%) classified themselves as White British, and 11.2% as belonging to other ethnic groups. 5.2% were entitled to free school meals. These figures are lower than the national average4 for secondary school pupils from minority ethnic groups (19.5%) and entitled to free school meals (13.1%). According to the second pupil survey, the majority of members have been in clubs for more than 6 months (72%); with 13% of them for more than one year. 18% of club members have taken part in the clubs for 4-6 months, and only 10% for less than 4 months.
This composition of pupil survey respondents provides a dataset which enables an examination of attitudes towards Science and Engineering by comparing different groups of pupils. In
addition, 60% of the second survey respondents (603 of 1068) participated in both pupil
surveys which means the pupil data collected allows the team to explore further the changes of pupils' attitudes over time.
4 DCSF (2008)
SFR09/2008: Pupil characteristics and class sizes in maintained schools in England, January 2008
5 Findings
5.1 Processes and project focuses
5.1.1 Selection
Key points - Selection of pupils to join the clubs
• A large majority of schools (79%) used the identification of pupils as being gifted and talented as a recruitment tool, or used open ‘invitation’ methods (74%), with most schools using more than one method. Only 29% of schools used borderline level 6 to 7 (predictions of attainment in key stage 3 tests) as a criterion.
• Many club leaders identified competition from other after school activities, e.g. drama club, music lessons, after school sports activities, as a barrier to recruitment.
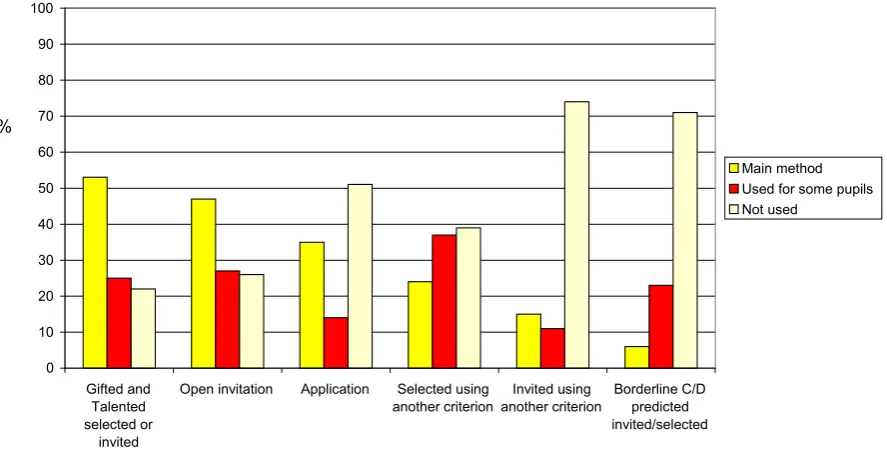
[image:24.595.92.536.423.648.2]The leader surveys indicated that a variety of methods were used to recruit pupils to the club. Figure 4.1 shows that the over half used a 'gifted and talented' criterion as main method of recruitment, and over three quarters (78.5%) used it in some form. Open invitation was the next most popular, used in 74% of cases. It is interesting that only 29% of clubs used Borderline predicted Level 6/7 as a selection criterion, since under-performance at the expected level at KS3 was one of the reasons used for selecting schools to be involved. It should be noted that 33% of the clubs surveyed used more than one main method, and around 30% had refused to allow at least some pupils to join the club.
Figure 4.1: Methods of recruitment to Clubs (%)
100
Open invitation Gifted and
Talented selected o invited
r 90
80 70
%
60
Not used
Used for some pupils Main method 50
40 30 20 10 0
Application Selected using another criterion
Invited using another criterion
Borderline C/D predicted invited/selected
The telephone interviews supported this finding that a variety of selection processes were used to recruit club members and that a mixed methods approach was popular. Many teachers stated that enthusiasm for being in the club was as important as ability:
showed interest. The idea was it is meant to enhance the curriculum in an enjoyment not learning sense, so to let in anyone who might want to enjoy Science.' School 13.
Other schools focussed purely on ability:
‘I went to the top two sets that we had and offered it up there to start with, we were sort of looking for a number in the 15 range, if we had many more kids, managing it would be a bit more tricky so we went for two fairly good groups, we kind of got that angle from the people who were running it that they were the sort of kids that they wanted.’ School 4
Some innovative selection strategies included producing a mini scientific project and involving outside 'real life' scientists to interview potential club members:
'If they want to come along they have to do a project about a famous scientist. If they show enough work and commitment they can come along. It's working well. I wrote to them all, started with 16 of the 25 who had responded, and had a waiting list at the end of last year. As Y9s went to Y10, we could accept those on the waiting list. Kids want to come along and see what they do, and then do the project.' School 1
Some teachers were surprised by the pupils who wanted to join the club which allowed them to see the benefit of their mixed approach to selection:
'That was surprising, the different groups of students that applied for it. The students that we thought would apply didn't, I don't know why, because we told them could have transport home and we made sure that anybody could come. But we had a completely different group. We had the one or two who are really committed to technology, that wasn't a huge surprise, but in the Science, like some of the girls who applied we just had no idea that they would be interested at all.' School 7
While club membership was in some settings seen as a reward for good behaviour within school others took the opposite approach to enthuse those students who normally don't engage with Science within the classroom:
'There were one or two students who applied and we didn't think it would be appropriate, based mainly on the way they behave in Science and technology lessons, we felt if they couldn't behave in those lessons they didn't deserve to be rewarded for that bad behaviour by getting extra clubs. Even within the club we've told them that if their behaviour in school deteriorates we will have to ask them to leave. Whereas if their behaviour in school did improve we could change our decision.' School 7.
Many club leaders stated that they were competing with other extra-curricular activities and clubs (both within and out with school) when recruiting and retaining club membership:
'There were some we wanted to come who weren't enthusiastic about it, some it was not their top priority, some just had something on every night of the week, either at home or at school. This school does a lot of after school clubs it's also an arts college so there's lots of drama and productions, and sport, and music.' School 8
5.1.2 Club organisation
Key points - Club organisation
• Most clubs (79%) had a core membership that attended every session, whilst a few clubs (5%) invited additional pupils to specific sessions. A small minority (9%) had different sets of pupils for each activity.
• In some schools older pupils were used as mentors
According to the club leader survey, the vast majority of clubs (79%) involved a single core group. A very few invited others to occasional activities (5%) and perhaps most interestingly 9% invited a different sets of pupils for each activity. Having got the group together, again the vast majority of clubs carried out projects over several weeks (96%) and involved the pupils
themselves in planning the activities (92%) at least some of the time (see Table 4.1 below). Almost all the clubs operated on weekdays after school, which some telephone interviewees mentioned as allowing more time and a more relaxed environment than a lunchtime club, and 15% additionally met at weekends for particular events. Six clubs met always or usually at weekends, and very small numbers met during the school day, usually for reasons of transport.
Table 4.1: aspects of Club organisation
Always Most of
the time
Some of the time
Rarely Never n=
Meet at weekends 2% 3% 10% 19% 66% 135
Involve pupils in planning activities
12% 29% 51% 5% 3% 150
Carry out projects over several weeks
31% 41% 24% 3% 1% 157
Involve older pupils to support the sessions
18% 16% 23% 19% 24% 143
Using older pupils as mentors, sometimes by accident, was seen as being beneficial both to club members and to the helpers themselves in the telephone studies:
'One year 11 doing BTEC was making fun of the club - saying my little brother’s got to go to the club, and had been winding him up. Then she found out about building solar powered racers she ended up wanting to come along and give a hand, so we have a few Year 11s almost helping us by teaching.' School 1.
The telephone interview data indicated that different approaches were taken to organising and running activities. Some club leaders organised the activities while others involved club members in decision making. These data reveals that 17 out of the 20 clubs interviewed were entirely staff-led with only 3 involving club members in overall decision making:
‘The first meeting we had, I got their feelings on what they wanted to do, obviously I had my ideas about what I wanted to do, they basically just wanted to blow things up or make cars, some of the original ideas I had were to do some fun activities to start with, and we did some work on sensor and how sensors work, and they bring a lot of the stuff in, they have ideas, and then we use those ideas to go forward, I have my topics and projects that we want to do, but they bring things in too, I do get their ideas.’ School 4
The club was set up 'in collaboration with the SETPOINT Director. He suggested some ideas and I discussed them with colleagues. The pupils had already described their ideas so it was very collaborative I think.' School 11
The teacher-led approach implemented by the majority of clubs had a strong impact on the subject focus of activities ran in the club with one teacher remarking that the clubs' focus is 'driven by what staff can and want to do' (School 15). Similar sentiments were expressed by other respondents (ASSEC Interim Report 2008):
There was some evidence in the Case Study schools that the degree of pupil choice or input affected motivation, with high levels of engagement shown were pupils were able to make decisions about themes and activities to be carried out.
5.1.3 Engagement with other organisations and support
Key points - Engagement with other organisations and support
• Museums and similar venues were most popular with clubs in terms of organising visits, with businesses being the main source of visitors to schools.
• The motivational value of events such as competitions was recognised, although in a minority of schools there was a view that the required time commitment was
problematic.
• Most rural schools had not recognised the potential of agriculture and the rural economy as being suitable examples of STEM (science, technology, engineering and
mathematics) businesses.
• The good practice workshops (organised by the Science, Technology Engineering and Mathematics Network or STEMNET) provided the most opportunity for school
interaction, being attended by over 50% of schools but other inter-school links were scarce.
• Schools valued the BA (British Association for the Advancement of Science) and STEMNET web resources available to support clubs, although a minority of schools were not aware of their existence. Support, where accessed, from SETPOINTs, and the role of the STEMNET regional directors, was valued.
The Leaders' survey indicated that there was a range of engagement with visits to and from different organisations and institutions. Figure 4.2 indicates that museums or similar (such as discovery centres) were most popular with clubs, followed by visits to a range of other
[image:27.595.70.532.569.760.2]institutions including go-kart or motor-racing, "Brainiac" at local theatres and the Centre for Alternative Technology in Wales and then university visits. It is interesting to note that less than 10% of clubs visited a business and only a fifth had been visited by one, however some visits to workplaces such as dockyards were classified as "other" rather than "business". Some visits from non-business professionals, such as a pathologist, archaeologist, optician and astronaut, were also successful. Several schools visited other schools and/or went out to take part in competitions. Eighteen percent had no involvement with visits or visitors.
It can be seen, from open comments in the other staff data, that the contacts that were made and maintained through club visits were viewed by teachers as being a major benefit of the programme, for example one noted that:
'Industrial links give an opportunity to motivate students and participate in activities not allowed in curriculum due to time constraints.'
A mixed response regarding club visits and links to external organisations is also clear from the telephone interview data. Again twelve out of the twenty schools have made, or plan to make industrial links. These links seem to be connected to the length of time the schools or individual staff members have been involved in out of school Science, technology and Engineering activities.
However, it should also be noted that out of the eight schools that had not made any industrial links, seven mentioned that they thought making contact with businesses was problematic. The reasons for this included limited teachers’ time, the time needed to maintain and sustain these links as well as the apparent lack of Science-based industry in rural areas:
'No, we haven't unfortunately, the area we're in there aren't really any local industrial links. Because it is a rural area we don't have those sort of links in the area, but it would be nice to make those links. The industry is mostly arable farming; yes I suppose we could see that as a Science and technology industry these days, we hadn't really thought about it like that.' School 7
This view of the scarcity of STEM-related external resources (e.g. businesses) in rural areas also came across in several Case Study schools. It perhaps indicates a need to promote agriculture and the rural economy as suitable exemplars of STEM business and contexts. Interschool links were sporadic amongst the schools who took part in the telephone interviews. Schools with pre-existing clubs were more likely to have some links with other schools either through competitions, or shared activities. As would be expected, these links tended to be between schools that were located in the same geographical area. This is a greater challenge for rural schools.
Data from the telephone interviews also reveals that schools were to varying degrees aware of the broader STEM agenda. This resulted in teachers having a variety of attitudes to STEMNET and SETPOINTs. A positive attitude to STEM was expressed by club leaders from six out of the twenty schools while another six appeared to be unaware of STEM related issues.
A number of schools drew attention to the practical and helpful resources available on the ASSEC website particularly in regard to ideas and examples of club activities:
'So the ideas really came from the Science and Engineering Club thing, the materials that came from them, "this is your starting point" and it was easy to go from there. You go through the website and booklet, sign up for things and they send you more details.' School 8.
At the other end of the spectrum one teacher who stated that he “wasn’t aware that there was a STEM agenda” at his school and was also sceptical of policy initiatives in general, was
surprisingly impressed with the ASSEC initiative:
Given the central role of SETPOINTs5 in providing schools with access to STEM enhancement
and enrichment activities, the low level of involvement in clubs is worth noting. Six schools positively referred to SETPOINT, though two schools were basing this on future plans to interact with SETPOINT rather than on past or current experience.
Only seven of the twenty schools indicated that external contacts had influenced their plans for the clubs. Thirteen schools stated that they had received no external input at the club's
planning stage though some did mention that they had sought help at this point in the process. The level of external input noted above is greater than indicated by this. This may be indicative of the way some schools view external support organisations (e.g. STEMNET, SETPOINT) as project and activity providers rather than sources of guidance in developing enhancement and enrichment activities.
Among newer staff members the initial STEMNET meeting to set up the club was valued. The same individuals stated that opportunities for further networking would be welcome (See the ASSEC Interim Report, 2008).
[image:29.595.84.532.373.628.2]As illustrated in Figure 4.3, the leaders' survey indicated that schools made use of a variety of support, the most popular being SETPOINT (68%), with other teachers and universities used more than industrial contacts. It should be noted that 5% of the schools that took part in the leader survey said they had received no external support at all.
Figure 4.3: Sources of support (leaders' survey)
Major support Some support
56%
35%
35%
34%
34%
27%
23%
18% 5%
12%
8%
5%
4%
3%
5%
3%
5% No support
SETPOINT
University
Local teachers
Local Business
Professional Associations
Other Schools
Big Business*
Local Authority
30% 40%
0% 10% 20% 50% 60%
Percentage of schools
(* "big business” includes national/international business or industry)
5From August 1st, 2008 SETPOINT contracts ceased to exist. In general, SETPOINT contracts were held by larger,
The use of external resources such as SETPOINTs, SEAS, E&E schemes, and engaging with businesses, was low across the Case Study schools. This may be addressed through the new STEMPOINT Brokerage contracts. Greater school-level awareness of external resources would seem to be needed.
5.1.4 Celebration events
Key point - Celebration events
• Almost all schools (98%) had organised some form of celebration event.
Celebration events (events, prizes, displays) were seen as important in terms of raising awareness of STEM within the school and the local community, as well as recognising
[image:30.595.56.528.301.384.2]achievements of the pupils who have taken part. This was emphasised at the outset when the clubs were set up, and most schools indicated that they would hold celebration activities on their proposal forms. From the leaders' survey (Table 4.2, below) the team saw that 80% of schools had already held some celebration and a further 18% planned to do so.
Table 4.2: Celebration events held or planned
Event only
Display only
Prize only Other only
More than one
celebration
Any event
Held 7% 12% 6% 3% 51% 80%
Planned 1% 2% 1% 1% 13% 18%
5.1.5 Pupil views on club organisation
Key points - Pupil views on Club organisation
• The majority of pupils (80%) thought their club was well organised and over 90% thought that they did interesting things in the club.
• Most pupils thought they had developed their understanding of what engineers and scientists do (69% and 75%), although most discussions with pupils during case study visits revealed a lot of ongoing misconceptions.
• More pupils thought the club had helped their understanding of science (64%) and design and technology (D&T) (49%) than mathematics (40%).
• Pupils' views about their involvement in their club became more positive the longer they had been a member.
Figure 4.4: Pupil perceptions of the clubs
[image:32.595.272.475.122.385.2]
= 6 months > 6 months
Figure 4.5 Perceptions of science and engineering club by duration of club membership
The Science & Engineering Club is well organised
We do interesting things in the Science & Engineering Club
The Science & Engineering Club helps me understand what engineers do The Science & Engineering Club helps me
understand what scientists do
Coming to the Science & Engineering Club is helping me with my work in science
lessons
I try to come to every Science & Engineering Club session
Coming to the Science & Engineering Club is helping me with my work in D&T lessons Coming to the Science & Engineering Club is helping me with my work in maths lessons
37%
56%
30%
32%
56%
26%
22%
11%
32%
46%
23%
29%
43%
24%
16%
7%
5.1.6 Activities
Key points - Activities and competitions
• The most popular activities (all carried out in 50% or more of schools) were energy and environment, flight and/or rockets, building (and sometimes racing) cars, robotics and electronics.
• The majority (62%) of schools had run between 3 and 6 different club topics.
• Other research evidence6 shows that prevalence of ‘cars and rockets’ activities may be
counterproductive with girls
All clubs were free to choose their own subjects and themes for projects, but at the outset they were provided with guidance from the BA and STEMNET about types of activities they could try, some of which had quite detailed outlines that could be followed. Several club leaders mentioned in the telephone interviews that, at least initially, they were keen to have some 'lesson plans' to help them get started. Perhaps for this reason, many clubs focussed on projects around renewable energy, cars, rockets and robotics (see Figure 4.6 below), where such materials were available. These are also projects that clearly incorporate both Science and Engineering. Several schools also carried out projects that could not clearly be linked into the categories below, such as catapults, earthquakes, sport Science or jewellery (see Annex 56 for the complete list of over 50 titles), but as only 1-4 schools did these activities the small numbers preclude further analysis. The name of the project often indicates whether it was likely to have been a one-off activity such as 'liquid nitrogen' or a longer term project such as 'living in space'.
Several of the Case Study school club leaders seemed unaware of the range of support materials available from the BA and STEMNET.
Figure 4.6: Percentage of clubs taking part in each type of project
57% 62%
52% 36%
33%
22%
29%
18% 14% 14% 12% 10% 10%
62% Energy & environment
Flight/ rockets Building/ racing cars Robots/ electronics
Bangs & smells
Type of project Forensics Astronomy/ space Microbiology/ biotechnology
Video/ film/ photography Food technology/ healthy eating Sound/ hearing/ radio Cosmetics Lighting/ colour/ decorations Roller coasters
0% 10% 20% 30% 40% 50% 60% 70%
Percentage of schools
[image:33.595.73.519.444.506.2]Similarly, the number of different projects carried out (Table 4.3) suggests how long has been spent on each one.
Table 4.3: Numbers of projects carried out in each club
Number of projects
carried out by each club 1-2 3-4 5-6 7-8 9-10 11-12 13-14
Percentage of clubs
(N=156) 12% 36% 26% 14% 6% 3% 2%
The evaluation team also looked at the types of projects carried out in relation to the