School Sport Survey
2007/08
Research Report DCSF-RW063
Susannah Quick, Douglas Dalziel,
Alex Thornton and Sally Rayner
School Sport Survey 2007/08
Susannah Quick, Douglas Dalziel,
Alex Thornton and Sally Rayner
TNS
The views expressed in this report are the authors’ and do not necessarily reflect those of the Department for Children, Schools and Families.
© TNS UK Limited 2008 ISBN 978 1 84775 254 3
Contents
Project contacts... 1
1. Summary of main findings... 2
2. Background and objectives... 6
3. Participation in PE and School Sport... 12
4. Participation in intra- and inter-school competitive activities... 31
5. Sports provision... 36
6. Club links... 39
7. Community sports, dance and multi-skill clubs... 41
8. Gifted and talented pupils... 43
9. Sports volunteering and leadership... 45
10. Conclusions... 48
Appendix A: Detailed tables of results for individual Partnerships and Local Authorities... 50
Project contacts
Report prepared by:
Name: Susannah Quick
Title: Managing Director - TNS Public Services
Phone: 020 8334 4208
1.
Summary of main findings
Between 2003/04 and 2007/08 TNS, an independent research company, conducted four
annual surveys among schools in the School Sport Partnership Programme on behalf of
the Department for Children, Schools and Families (DCSF). The surveys collected
information on the levels of participation in Physical Education (PE)1 and school sport2 in partnership schools and were used to measure progress towards a Public Service
Agreement (PSA) target. The surveys took place during May-July each year, with the
most recent one involving the participation of a total of 21,631 schools. This represents a
response rate of 99%.
Participation in PE and school sport
• Overall the 2007/08 survey found that 90% of pupils in partnership schools
participated in at least two hours of high quality PE and out of hours school sport
in a typical week. This means that the 2008 PSA target of 85% participation has
been exceeded by five percentage points.
• Primary (96%) and special schools (93%) achieved particularly high rates of
participation in two hours of PE and school sport. In secondary schools the figure
was lower at 83%.
• There were also large differences in terms of levels of participation between year
groups. For Years 1-9 participation rates were all in excess of 85%. However
there is a noticeable drop in Years 10 and 11, with participation rates at 71% and
66% respectively.
• All 450 School Sports Partnerships achieved a participation level of at least 75%
in 2007/08, which means that a further element of the PSA target has also been
met.
1
PE is the planned teaching and learning programme in curriculum time that meets the requirements of the national curriculum for physical education.
2
School sport includes any activity that requires skilfulness and is part of the school’s planned formal,
• The series of five surveys shows that much progress has been made over time.
The first survey in 2003/04 recorded that 62% of pupils participated in at least
two hours of PE and school sport. This has increased every year to reach the
current level of 90%. The greatest improvements have been in Years 1-4. Years
10 and 11 have shown only modest improvements over a relatively low baseline
figure.
• There are minimal differences in terms of participation rates in different
Government regions, and all regions have made year on year progress. In urban
areas participation levels were slightly lower than in rural areas, although the gap
between the two has narrowed over the course of the series of surveys.
• The best performing schools in terms of their participation in PE and school sport
tend to be in more affluent areas and have a relatively low proportion of children
from an Ethnic Minority Heritage.
• Pupils spent an average of 118 minutes each week participating in curriculum PE
during 2007/08. This represents an increase from 103 minutes in 2003/04. These
rates were similar across Years 1-9, but drop noticeably at Years 10 and 11.
Consistent year on year improvements have been recorded for Years 1-6. For
Years 10 and 11 there have been small decreases in the average curriculum PE
time over the course of the surveys.
• 78% of pupils participated in at least 120 minutes of curriculum PE - compared to
just 34% in the first (2003/04) survey.
Participation in intra and inter-school competitive activities
• Aside from school sports days, 66% of pupils took part in intra-school competitive
activities during 2007/08. Participation was at its highest in Years 3-9, but clearly
lower in Years 1, 2, 10 and 11.
• Over the last two years (where comparable data is available) the proportion of
pupils participating in intra-school competition has risen from 58% to 66%.
• In 2007/08 41% of pupils across Years 1-11 participated in inter-school
competition, compared to 35% in 2006/07. Levels of activity peaked at Years 5
Sports provision
• The average number of sports provided by schools during 2007/08 academic
year was 17.5. This compares to a baseline figure of just 14.5 in 2003/04.
• Football, dance, gymnastics, athletics and cricket are the most widely available
sports and are provided by nine in ten schools.
• The increase in the average number of sports provided has been driven by big
increases in the availability of multi-skills clubs, tennis, fitness,
outdoors/adventurous activity, orienteering, badminton, cycling, golf, table tennis,
canoeing, archery, mountaineering, martial arts and rowing.
Club links
• Schools had links to an average of 7.6 different clubs during the 2007/08
academic year - up from a baseline of just 5.0 different sports in the first
(2003/04) survey.
• By far the most common link is for football, followed by cricket, dance, rugby
union, swimming and athletics.
Community sports, dance and multi-skill clubs
• Across Years 2-11, 32% of pupils participated in one or more sports, dance or
multi-skill clubs with links to the school during 2007/08. This represents an
increase from an original baseline of just 19% in 2003/04.
Gifted and talented
• Across Years 5-11 an average of 7% of pupils are currently registered as gifted
and talented because of their ability in PE and/or school sport. This means that
there are some 290,000 pupils in partnership schools who are registered. This
compares to just 3% in the first 2003/04 survey.
Sports volunteering and leadership
• 16% of pupils across Years 1-13 were involved in sports volunteering and
• Comparisons over time are limited to Years 10-13, but show a consistent
movement upwards from an initial measure of 9% in 2003/04 to 20% in the latest
2.
Background and objectives
2.1 Background
Physical Education3 (PE) and school sport4 play an important role in school life. They help to raise standards, improve behaviour and health, increase attendance and develop
social skills. In the five years to 2008, over £1.5 billion will have been invested to
transform PE, school sport and club links.
A joint Department for Children, Schools and Families (DCSF)5 / Department for Culture, Media and Sport (DCMS) Public Service Agreement Target (PSA) was set in 2004 to
enhance the take-up of sporting opportunities by 5 -16 year olds as follows:
‘Enhance the take-up of sporting opportunities by 5 to 16 year olds so that the
percentage of school children in England who spend a minimum of two hours
each week on high quality6 PE and school sport within and beyond the
curriculum increases from 25% in 20027 to 75% by 2006 and to 85% by 2008,
and to at least 75% in each School Sport Partnership by 2008.’
The national PE, School Sport and Club Links strategy brings together eight different
strands, one of which is the School Sport Partnership Programme (formerly the School
Sport Co-ordinator Programme). The programme is based around ‘families’ of schools
which are brought together to increase both the quality and quantity of sporting
opportunities for young people. Partnerships are made up of secondary, primary and
3
PE is the planned teaching and learning programme in curriculum time that meets the requirements of the national curriculum for physical education.
4
School sport includes any activity that requires physical skilfulness and is part of the school’s planned
formal, semi-formal, supervised or led provision. School sport typically takes place out of school hours. 5
The DCSF was previously known as the DfES (Department for Education and Skills). The DCSF was
formed in June 2007.
6
High quality is defined as ‘producing young people with the skills, understanding, desire and commitment
to continue to improve and achieve in a range of PE, sport and health-enhancing physical activities, in line
with their abilities.’ Learning through PE and Sport - A guide to the PE, School Sport and Club Links Strategy.
7
special schools which usually have a Specialist Sports College acting as the hub of the
family. At the heart of the programme is the Partnership Development Manager (PDM)
who is responsible for managing the partnership, while in every secondary school there
is a School Sport Co-ordinator (SSCo), and in every primary or special school a Primary
Link Teacher (PLT) or Special School Link Teacher (SSLT) who is responsible for
leading the strategy at that particular school. Staff are funded by the programme to allow
them to do this.
The partnerships were set up in a number of phases, starting in September 2000, and
rolled out during 2000 to 2006. By the end of 2007 all maintained schools (21,727) in
England were in School Sport Partnerships, arranged into 450 different partnerships.
Between 2003/04 and 2007/08 TNS, an independent research company, conducted a
series of five annual surveys of schools to monitor the success of the programme. The
first survey in 2003/04 involved the participation of 6,547 of the 8,105 eligible schools
and showed that 62% of children aged 5-16 participated in at least two hours of PE and
school sport. The subsequent three surveys showed that this percentage increased to
69% in 2004/05, to 80% in 2005/06 and to 86% in 2006/07 among partnership schools.
These increases took place as the programme rolled out, with the number of schools
participating in the programme increasing year after year.
In 2007/08 TNS conducted the fifth and final survey in the programme, reflecting the fact
that the particular strategy had reached an end. The findings of this survey are
presented in this report.
2.2 Research objectives
The objectives of the research were to collect the following information:
• What proportion of pupils in schools undertake at least two hours of high quality
PE and sport within and beyond the curriculum?
How does this vary by year group?
How does this vary by type of school?
How does this vary by a range of other factors - for example,
• What is the average curriculum time pupils in Partnership schools spend
undertaking high quality PE and school sport?
How does this vary by year group?
How does this vary by type of school?
How does this vary by a range of other factors - for example,
uptake of FSM?
• How many pupils by year group are involved in intra school sport and school
sport competitive activities?
• How many pupils by year group are involved in inter school competitions?
• What is the range of sports offered?
• Is the range delivered via a formal link between schools and clubs?
• How many pupils participate in clubs linked to the schools in the Partnerships?
• How many pupils are registered as gifted, talented or able because of their ability
in PE / school sport?
• How many pupils are actively involved in sports volunteering and leadership?
2.3 Methodological approach
The 2007/08 survey aimed to collect information from all partnership schools in the
maintained sector in England (21,727 schools). In addition, it collected information from
a small number of independent schools, but this information is not included in this report.
As in previous years, the 2007/08 survey required schools to provide answers to ten
questions. These questions could either be answered on paper or online via a dedicated
website. All partnerships were required to have active involvement within the survey
process and PDMs were required to take responsibility for data collection within their
partnership. TNS sent questionnaires in bulk to PDMs for distribution to their schools;
the PDM was asked to take responsibility for distribution to individual schools, tracking
responses, and ensuring that questionnaires were returned to TNS.
In the survey instructions, schools / PDMs were informed that ideally they should
complete the questionnaire online, but a paper copy of the questionnaire was also
provided in case they could not do this. Different deadlines were used for online and
12 June 2008, while those completing the online questionnaire were required to do so by
3 July 2008.
A survey website was developed which not only provided access to the online
questionnaire, but also to other materials to assist with the survey. The website also
provided a PDM area where each PDM could log on and track which of the schools in
their partnership had returned a questionnaire and, for online responses only, download
a copy of the actual data submitted. Both an online and a telephone helpline were made
available to support partnerships during the process.
Survey packs were sent to PDMs in May 2008. Each pack contained a covering letter, a
set of survey instructions for PDMs, a list of schools in the partnership, a pre-printed
questionnaire and a step-by-step guide to the survey for each school.
Returns were carefully monitored on a daily basis at TNS, and all PDMs in partnerships
with zero returns were sent an email, shortly after the deadline for paper returns,
reminding them of the final online deadline and to check that everything was in order.
By the final deadline, a total of 21,631 usable responses had been received, as follows:
• 92% on the web
• 7% on paper
This represents an overall response rate of over 99%. Nine out of ten of all partnerships
achieved a 100% response rate and only five partnerships achieved a response rate
below 95%, the lowest partnership response rate being 91%.
2.4 Validation exercise
In addition to the main data collection, a validation exercise took place to verify the
accuracy of the answers to four of the key questions within the survey. These questions
• Q1. What is the total curriculum time in minutes that all pupils in each year group spend taking part in PE in a typical week?
• Q2. What is the total number of pupils in each year group who participate in at least two hours of high quality PE and out of hours school sport in a typical
week?
• Q8. What is the total number of pupils in each year group who have participated in one or more community sports, dance or multi-skill clubs with links to the
school during this academic year?
• Q10. What is the total number of pupils in each year group actively involved in sports volunteering and leadership this academic year?
The validation exercise comprised visits to 10% of the 450 partnerships which were
selected at random (45 in total). At each partnership a face-to-face interview was carried
out with the PDM and with eight randomly selected SSCos / PLTs. The exercise was
conducted between the last week in June and the end of term (in July 2008). TNS
concluded that the majority of schools kept records which verified the figures they had
submitted and, even when these were not available, researchers were satisfied from the
verbal accounts of the approach adopted by schools. It was concluded, as in 2005/6 and
2006/7, that survey had produced robust results. In line with previous years, this year’s
validation exercise did not suggest there had been any systematic misreporting of data.
On completion of the exercise, TNS concluded that there are still minor difficulties with
some of the terminology used in the survey, including what constitutes a club link and
what should be included in sports volunteering and leadership. However, survey
terminology and instructions have been deliberately kept as consistent as possible so as
not to compromise time series data. Overall the exercise suggested that the survey had
run smoothly and that PDMs, SSCos and PLTs were becoming increasingly adept at
2.5 Reporting
This report covers all schools in all Phases of the School Sport Partnership Programme
which were operational in the 2007/08 academic year and which completed a
questionnaire by the stated survey deadline. Where appropriate, comparisons are made
with the previous four waves of data collection (2003/04, 2004/05, 2005/06 and
2006/07).
For simplicity the figures shown in the text and charts in this report have been rounded
to the nearest percentage point.
The appendices to this report contain detailed tables which list results on key questions
3.
Participation in PE and School Sport
Schools were asked to submit figures to indicate the number of pupils in each year
group who participated in at least two hours of high quality PE and out of hours school
sport in a typical week. This is a key measure which relates directly to the PSA target
which has been set at 85% for 2008 across all schools.
3.1 Participation in at least two hours of PE and school sport - overall
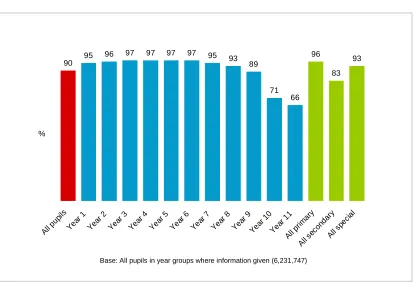
The 2007/08 survey found that overall 90% of pupils in partnership schools participated
in at least two hours of high quality PE and out of hours school sport in a typical week.
This means that the 2008 PSA target of 85% has been exceeded by five percentage
points. As has been the case throughout the series of surveys, there are quite large
differences between year groups and reflecting this, by school type. For Years 1-9
participation rates were all in excess of the 85% target, and indeed for Years 1-8 the
figures all exceeded 90%. However, there is a very clear drop in Years 10 and 11, with
participation rates at 71% and 66% respectively.
Regarding school type, primary schools (96%) and special schools (93%) achieved very
high participation rates, while at a secondary level the figure fell to 83%, reflecting the
lower participation rates in Years 10 and 11. Participation rates by year group and type
Figure 1: Percentage of pupils who participated in at least two hours of high quality PE and out of hours school sport in a typical week - analysis by year group and school type (2007/08)
90 95
96 97 97 97 97 95 93
89
71 66
96
83 93
All pupi
ls Year
1 Year
2 Year
3 Year
4 Year
5 Year
6 Year
7 Year
8 Year
9 Year
10 Year
11
All p rima
ry
All s econ
dary All s
pecia l
%
Base: All pupils in year groups where information given (6,231,747)
In addition to the overall target, there was also a target which required each individual
School Sport Partnership to achieve a two hour PE / out of hours school sport
participation rate of 75% or above by 2008. There are a total of 450 partnerships, and all
achieved this target: the lowest level recorded for any individual partnership was 78%
and the highest was 100%. Figure 2 shows the distribution of the 450 individual
Figure 2: Percentage of pupils who participated in at least two hours of high quality PE and out of hours school sport in a typical week - number of
partnerships achieving different participation rates (2007/08)
Of the 450 partnerships, 75 top performing partnerships achieved average participation
rates of 95% or more among their pupils. 186 achieved average participation rates of
90% - 94% and 151 partnerships achieved rates of between 85% and 89%. Just 39
partnerships were below 85% participation.
3.2 Participation in at least two hours of PE and school sport - trends
Figure 3 compares the results from the latest 2007/08 survey with those from the
previous four surveys. It provides an analysis over time and compares:
• All partnerships which were operational at the time of the relevant survey - over
time the number of partnerships, schools and pupils increases considerably, as
the programme rolled out (from just over 2 million pupils in 2003/04 to over 6
million in 2007/08). While this is an interesting measure, it is important to note
that it does not represent a consistent set of partnerships over time. Bearing this
in mind, a further analysis is provided which does track the results of a consistent
set of partnerships, as follows:
75
185 151
32 7
95% or above 90% - 94% 85% - 89% 80% - 84% Below 80%
Participation rate
Number of partnerships
• The longest established partnerships - those partnerships which have been
operational since 2003/04
• Those partnerships which have been operational since 2004/05
• Those partnerships which have been operational since 2005/06
• The most recently established partnerships - those partnerships which have been
[image:18.612.87.505.263.536.2]operational since 2006/07
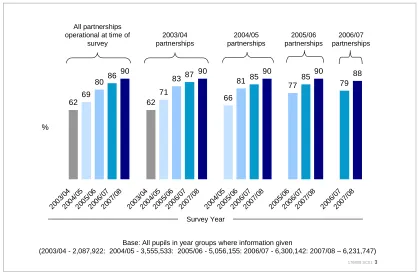
Figure 3: Percentage of pupils who participated in at least two hours of high quality PE and out of hours school sport in a typical week - comparison of partnerships established in 2003/04, 2004/05, 2005/06 and 2006/07
176808 SC01 3
62 69 80 86
90
62 71
83 87 90
66 81 85 90 77 85 90 79 88 2003 /04 2004 /05 2005 /06 2006 /07 2007 /08 2003 /04 2004 /05 2005 /06 2006 /07 2007 /08 2004 /05 2005 /06 2006 /07 2007 /08 2005 /06 2006 /07 2007 /08 2006 /07 2007 /08 %
Base: All pupils in year groups where information given
(2003/04 - 2,087,922: 2004/05 - 3,555,533: 2005/06 - 5,056,155: 2006/07 - 6,300,142: 2007/08 – 6,231,747) 2003/04 partnerships 2004/05 partnerships 2006/07 partnerships All partnerships
operational at time of survey
2005/06 partnerships
Survey Year
The chart shows how much progress has been made over time. The first survey which
took place in 2003/04 recorded that 62% of pupils participated in at least two hours of
high quality PE and school sport. This has increased year on year to the latest 90%
figure, with the target of 85% actually being exceeded one year before the target date of
Previous surveys have shown that there is a clear link between the length of time a
partnership has been established and the level or participation achieved, with those
established the longest reaching higher participation levels than those established more
recently. However, the latest survey shows that the most recently established
partnerships (set up in 2006/07) now have very similar participation levels to the earliest
established partnerships (established in 2003/04). Specifically participation among the
former now stands at 88% of pupils, compared to 90% of pupils among the 2003/04
partnerships (and indeed 90% among both the 2004/05 and the 2005/06 partnerships).
The chart also shows how there have been year on year increases for all phases of
partnerships, although partnerships established in 2003/04 have shown small increases
in the 2007/08 survey, reflecting the fact that the participation rate was already very high
in the 2006/07 survey (87%).
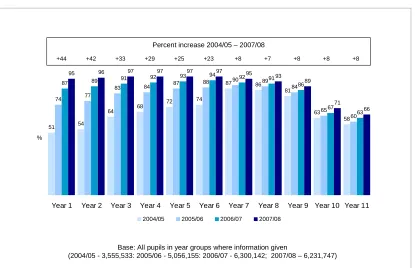
The report now looks at changes in individual year groups over time, comparing data
from the last four surveys. It firstly shows how increases have been achieved for each
individual year group at every survey. Secondly, it shows that the greatest progress in
terms of percentage change has been achieved in Years 1 (from 51% in 2004/05 to 95%
in 2007/08, an increase of 44%), 2 (increase of 42%), 3 (increase of 33%) and 4
(increase of 29%). In contrast there has been less progress among Years 7, 8 and 9 -
but here participation levels were already very high - and among Years 10 and 11, which
Figure 4: Percentage of pupils who participated in at least two hours of high quality PE and out of hours school sport in a typical week - analysis by year group over time
51 54
64 68
72 74
87 86 81
63 58 77
83 84 87 88
90 89 84
65 60 87 89 91
92 93 94 92 91
86 67
63
95 96 97 97 97 97 95
93 89
71 66 74
Year 1 Year 2 Year 3 Year 4 Year 5 Year 6 Year 7 Year 8 Year 9 Year 10 Year 11
%
2004/05 2005/06 2006/07 2007/08
Base: All pupils in year groups where information given
(2004/05 - 3,555,533: 2005/06 - 5,056,155: 2006/07 - 6,300,142; 2007/08 – 6,231,747)
+8 +8 +8 +7 +8 +23 +25 +29 +33 +42 +44
Percent increase 2004/05 – 2007/08
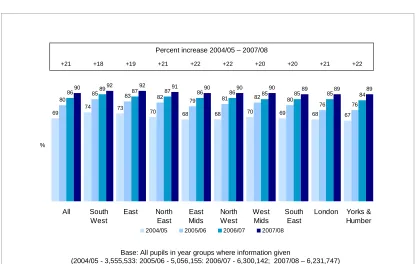
Looking at an analysis by Government Region (Figure 5) it is clear that there are minimal
differences in terms of participation rates in different areas of the country. The highest
figures are recorded in the South West and the East at 92%, but these are only three
percentage points higher than in the lowest regions of the South East, London and Yorkshire
Figure 5: Percentage of pupils who participated in at least two hours of high quality PE and out of hours school sport in a typical week - analysis by region
69
74 73
70 68 68 70 69 68 67
85 83 82
79 81 82 80
76 76
86 89 87 87 86 86 85 85 85 84
90 92 92 91 90 90 90 89 89 89
80
All South West
East North East
East Mids
North West
West Mids
South East
London Yorks & Humber
%
2004/05 2005/06 2006/07 2007/08
Base: All pupils in year groups where information given
(2004/05 - 3,555,533: 2005/06 - 5,056,155: 2006/07 - 6,300,142; 2007/08 – 6,231,747)
+22 +21 +20 +20 +22 +22 +21 +19 +18 +21
Percent increase 2004/05 – 2007/08
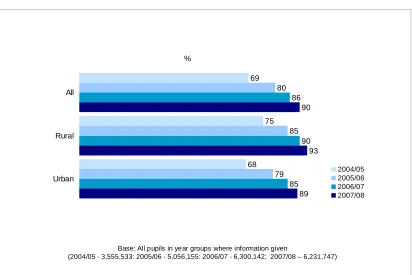
In urban8 areas participation levels were slightly lower than in rural areas (89% v 93% in the 2007/08 survey). This has been a consistent pattern over the course of the surveys,
although the gap between urban and rural areas has narrowed from seven percentage
points in 2004/05 to four percentage points in 2007/08.
8
Urban is defined as settlements with a population of 10,000 or more. Rural is defined as smaller
Figure 6: Percentage of pupils who participated in at least two hours of high quality PE and out of hours school sport in a typical week - analysis by area type
69
75
68
85
79 86
90
85 90
93
89 80 All
Rural
Urban
%
2004/05 2005/06 2006/07 2007/08
Base: All pupils in year groups where information given
(2004/05 - 3,555,533: 2005/06 - 5,056,155: 2006/07 - 6,300,142; 2007/08 – 6,231,747)
The following series of charts looks at how participation rates relate to a number of
socio-economic and school related factors. In the next four charts schools have been
divided into three categories according to their performance on the two hour take-up of
high quality PE and out of hours school sport in a typical week. The three categories
have been defined as follows9:
• Very high performing schools - all with 100% of their pupils achieving the two
hour PE / school sport target (a total of 17,222 schools)
• High performing schools - comprising schools where between 85% and 99% of
pupils achieve the two hour PE / school sport target (a total of 985 schools)
• Lower performing schools - comprising the relatively small number of schools
where less than 85% of pupils achieve the two hour PE / school sport target (a
total of 2,918 schools)
9
The thresholds for the three categories of schools were changed in this year’s report, to account for the
fact that increasing numbers of schools have achieved 100% pupil participation in two hours of PE / school
Figure 7 shows the relationship between the performance of schools with regard to the
proportion of pupils achieving the two hour target and the proportion of pupils who are
eligible for Free School Meals (FSM)10. It shows that in the schools which perform highest in terms of their pupils’ participation in two hours of PE / school sport there tend
to be slightly fewer pupils who are eligible for FSM than in schools where there are lower
levels of participation in the two hour PE / school sport target (31% compared to 33%).
These differences are, however, small, and perhaps surprisingly small given that FSM is
[image:23.612.88.504.296.572.2]very strongly associated with other measured attainment outcomes.
Figure 7: Percentage of pupils who participated in at least two hours of high quality PE and out of hours school sport in a typical week - analysis by percentage of children eligible for free school meals (2007/08)
Base: All schools (21,631)
Level of participation in two hours PE and school sport
31%
30%
33%
32%
34%
35%
37%
35%
32%
Schools achieving 100% participation
Schools achieving 85% - 99% participation
Schools achieving less than 85%
participation
High % FSM Medium % FSM Low % FSM
% of children eligible for
FSM
10
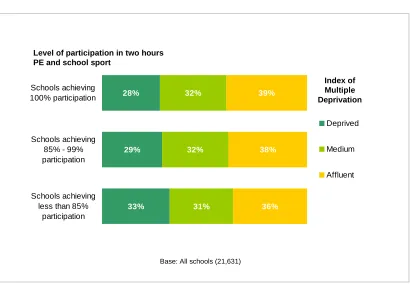
A similar analysis compares the performance on the two hour PE/school sport target
with the schools’ Index of Multiple Deprivation (IMD) (see Figure 8). It shows there is a
relationship between the two measures, with the best performing schools tending to be
in the more affluent areas. Specifically 33% of lower performing schools were in
relatively deprived areas, compared with just 28% of very high performing schools. As
[image:24.612.94.504.243.530.2]with the analysis of FSM, these differences are relatively small.
Figure 8: Percentage of pupils who participated in at least two hours of high quality PE and out of hours school sport in a typical week - analysis by Index of Multiple Deprivation (2007/08)
28%
29%
33%
32%
32%
31%
39%
38%
36%
Schools achieving 100% participation
Schools achieving 85% - 99% participation
Schools achieving less than 85%
participation
Deprived Medium Affluent
Level of participation in two hours PE and school sport
Index of Multiple Deprivation
Base: All schools (21,631)
There also exists a relationship between the ethnic minority heritage (EMH) composition
of the school and the level of participation in PE / school sport (Figure 9). Around a third
(37%) of schools which achieve 100% PE / school sport participation rates have a
relatively high level of EMH pupils, whereas 42% of schools with the lowest levels of
Figure 9: Percentage of pupils who participated in at least two hours of high quality PE and out of hours school sport in a typical week - analysis by Ethnic Minority Heritage (2007/08)
37%
42%
42%
35%
32%
33%
28%
25%
23%
Schools achieving 100% participation
Schools achieving 85% - 99% participation
Schools achieving less than 85%
participation
High (12%+) Medium (4-11%) Low (0-3%)
Level of participation in two hours PE and school sport
% of children with Ethnic Minority
Heritage
Base: All schools (21,631)
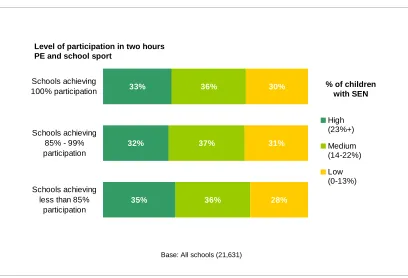
Figure 10 shows that there is a very slight relationship between the proportion of pupils
with Special Educational Needs (SEN) in a school and its performance on meeting the
two hour PE / school sport target. There is evidence to suggest that lower performing
schools tend to have a slightly higher proportion of children with SEN than is the case for
Figure 10: Percentage of pupils who participated in at least two hours of high quality PE and out of hours school sport in a typical week - analysis by Special Educational Needs (2007/08)
33%
32%
35%
36%
37%
36%
30%
31%
28%
Schools achieving 100% participation
Schools achieving 85% - 99% participation
Schools achieving less than 85%
participation
High (23%+) Medium (14-22%) Low (0-13%)
Level of participation in two hours PE and school sport
% of children with SEN
Base: All schools (21,631)
Figure 11 presents the percentage of pupils participating in two or more hours of high
quality PE and out of hours school sport in a typical week by school type. The
percentage of pupils at boys only and at mixed schools participating in at least two hours
of PE / school sport is much higher than at girls only schools, where it is 69% (note
however that there are only 233 girls only schools, out of a total of 21,631 partnership schools). Over time it is clear that the greatest increases in participation levels have
been in mixed schools (which represent the vast majority of schools) while in boys only
schools (of which there are 250 such schools) the figures started at a high level and the
increases have therefore been more modest. In girls only schools the increase over time
has been slightly greater than in boys only schools, but the former still lag a long way
Figure 11: Percentage of pupils who participated in at least two hours of high quality PE and out of hours school sport in a typical week - analysis by school type (2007/08)
69
80
57
70 83
62
81 86
86
65
86 90
90
69
91 80 All
Boys only
Girls only
Mixed
%
2004/05 2005/06 2006/07 2007/08
Base: All pupils in year groups where information given
(2004/05 - 3,555,533: 2005/06 - 5,056,155: 2006/07 - 6,300,142; 2007/08 – 6,231,747)
3.3 Curriculum time spent on PE - overall patterns
In addition to information about numbers of pupils participating in PE and school sport,
schools were also required to submit information about the total curriculum time (in
minutes) that all pupils spend taking part in PE in a typical week. Results by year group
Figure 12: Total curriculum time that all pupils in each year group spend taking part in PE in a typical week - analysis by year group and school type (2007/08)
118 121 121 122 123 123 123
128 126 122
99 96 122
114 138
All pu pils
Year 1
Year 2
Year 3
Year 4
Year 5
Year 6
Year 7
Year 8
Year 9
Year 10
Year 11
All p rima
ry
All s econ
dary All s
pecia l
%
Base: All pupils in year groups where information given (6,231,747)
Pupils spent an average of 118 minutes participating in curriculum PE in a typical week
during 2007/08. As with the percentage of pupils participating in at least two hours of PE
and school sport, rates were fairly similar across Years 1-9, but then dropped by around
20 minutes at Years 10 and 11 to 99 minutes and 96 minutes respectively. The average
amount of curriculum PE was highest in special schools at 138 minutes. In secondary
schools it was 114 minutes, reflecting the lower amount of curriculum PE in Years 10
and 11.
3.4 Curriculum time spent on PE - more detailed analysis and trends
An examination of the results over time for all partnerships included in the survey (which
vary over time, with more partnerships and schools coming on stream) shows that the
average curriculum time spent on PE has increased from 103 minutes in 2003/04 up to
Looking at the data by the length of time that the partnerships have been established
shows that the most recently established (2006/07) partnerships have slightly less
curriculum time on PE on average (115 minutes) than the longer established
partnerships which are between 118 and 119 minutes. As with the question on
participation in PE and school sport, there have been increases every year for
[image:29.612.90.505.258.527.2]partnerships established in 2003/04, 2004/05, 2005/06 and 2006/07.
Figure 13: Total curriculum time that all pupils in each year group spend taking part in PE in a typical week - comparison of partnerships established in 2003/04, 2004/05, 2005/06 and 2006/07
176808 SC01 13
103107
111 115 118
103108
113 116119
106112 115 118
110115 118 110115
2003 /04 2004 /05 2005 /06 2006 /07 2007 /08 2003 /04 2004 /05 2005 /06 2006 /07 2007 /08 2004 /05 2005 /06 2006 /07 2007 /08 2005 /06 2006 /07 2007 /08 2006 /07 2007 /08 %
Base: All pupils in year groups where information given
(2003/04 - 2,141,084: 2004/05 - 3,574,969: 2005/06 - 5,058,169: 2006/07 - 6,300,142) 2003/04 partnerships 2004/05 partnerships 2006/07 partnerships All partnerships
operational at time of survey
2005/06 partnerships
Survey Year
In Years 1-6 there have been very consistent year on year improvements in terms of the
average amount of curriculum PE pupils take part in. Between 2004/05 and 2007/08 an
increase of between 19 minutes and 25 minutes was recorded for each of these year
groups. In Years 7 to 9 there have been smaller increases - but the figures in these year
groups have always been relatively high. In Years 10 and 11, participation decreased
slightly between 2004/05 and 2006/07, but seems to have started to reverse this trend in
Figure 14: Total curriculum time that all pupils in each year group spend taking part in PE in a typical week -analysis by year group over time
10
7
96 96
103 103 104 104
124 123
118
101 98
10
7
10
7 111 11
2
113 11
2
125 124
120
97 94
115 115 116 118 119 119 118
126 124
120
97 94
118 121 121 122 123 123 123
128 126
122
99 96
111
All Year 1 Year 2 Year 3 Year 4 Year 5 Year 6 Year 7 Year 8 Year 9 Year 10 Year 11 %
2004/05 2005/06 2006/07 2007/08
Base: All pupils in year groups where information given
(2004/05 - 3,574,969 : 2005/06 - 5,058,169: 2006/07 - 6,300,142: 2007/08 – 6,231,927)
+25 +25 +19 +20 +19 +19 +4 +3 +4 -2 -2 +11
Number of minutes increase 2004/05 – 2007/08
Figure 15 shows in detail the range of minutes that pupils spend taking part in curriculum
PE. Across all year groups just 8% of pupils participated in less than 90 minutes of
curriculum PE in a typical week, with 14% having between 90-119 minutes, 66%
between 120-149 minutes and 12% participated in more than 150 minutes curriculum
PE. This means that 78% of pupils participated in at least 120 minutes of curriculum PE.
In each of Years 1-9, at least 78% of pupils participated in 120 minutes or more of
curriculum PE, which has a major impact on the success of the overall levels of
participation in PE and school sport. At the other end of the scale, about two in five of
those in Years 10 and 11 participate in at least 120 minutes of curriculum PE. There are
much higher numbers in Years 7 and 8 participating in 150 minutes, around twice the
proportion compared to other years.
By way of comparison, in 2003/04 just 34% of pupils participated in at least 120 minutes
Figure 15: Total curriculum time that all pupils in each year group spend taking part in PE in a typical week - ranges (2007/08)
8 4 4 3 3 3 3
1 1 3
31 35
14
11 11 9 8 9 9 12 14 19
26 26
66 76 77
80 80 80 79
64 64
62
35 32
12 9 9 9 9 9 9
23 21 16
8 7
All Year 1 Year 2 Year 3 Year 4 Year 5 Year 6 Year 7 Year 8 Year 9 Year 10 Year 11
150+ mins
120-149 mins
90-119 mins
Less than 90 mins
Base: All pupils in year groups where information given (6,231,927)
Given that 78% of all pupils received at least two hours of curriculum PE, and the fact
that 90% participate in at least two hours of PE and school sport, this means that overall
12% of pupils achieve their two hours of PE and school sport through a ‘top up’ of out of
hours school sport including lunch time or break time activities, rather than through
curriculum PE. Figure 16 looks at this on an individual year group level. It shows that for
Years 1-9 the two hour PE and school sport target is mainly achieved through curriculum
time alone. However, for Years 10 and 11, there is a much greater emphasis on out of
hours school sport to support the curriculum time, and even so it is of course the case
that a much smaller proportion of pupils in these year groups achieve the two hour
Figure 16: Analysis of how two hours of PE and school sport target is achieved -by year group (2007/08)
176808 SC01 16
78 85 86 89 89 89 88 87 83 78
28 27
12 10
10 8 8 8 9 12 10
11
28 27
90 95 96
97 97 97 97 95 93
89
71 66
All Year 1 Year 2 Year 3 Year 4 Year 5 Year 6 Year 7 Year 8 Year 9 Year 10 Year 11
%
o
f pu
pi
ls
ac
hi
e
v
in
g 2 ho
ur
P
E
/s
c
h
o
o
l s
p
or
t tar
g
e
t
'Top up' of out of hours school sport Curriculum time
Base: All pupils in year groups where information given (6,231,927)
An examination of data from the previous surveys on how the two hour PE and school
sport target has been achieved (Figure 17) reveals that there has increasingly been a
focus of curriculum PE, which has been the primary reason why the two hour target has
been achieved. However, for Years 10 and 11, the analysis reveals that any increases in
the curriculum time have been modest as have the increases in the amount of out of
hours schools sport. The combination of these two factors account for the lower levels of
Figure 17: Analysis of how two hours of PE and school sport target is achieved - analysis over time for Years 10 and 11
176808 SC01 17
50 61
70 78
38 38 38 43 35 34 35 39
19 19
16 12
25 27 29 28
23 26 28 27
69
80 86 90
63 65 67 71
58 60 63 66 2004/ 05 2005/ 06 2006/ 07 2007/ 08 2004/ 05 2005/ 06 2006/ 07 2007/ 08 2004/ 05 2005/ 06 2006/ 07 2007/ 08 % of pu pi ls r e ac hi n g 2 ho ur P E /s c ho ol s p o
rt ta
rget
'Top up' of out of hours school sport
Curriculum PE time Year 10 Year 11
4.
Participation in intra- and inter-school competitive
activities
4.1 Intra-school competitive activities
During the 2007/08 academic year 66% of pupils took part in intra-school (i.e. within the
school) competitive activities, excluding school sports days. Within secondary schools
the figure stood at 67% while for primary schools it was 65%. In special schools it was
slightly lower at 62%. Looking at individual year groups, participation in intra-school
competitive activities was at its highest in Years 3-9, but much lower in Years 1 and 2,
[image:34.612.91.506.353.620.2]and Years 10 and 11.
Figure 18: Percentage of pupils involved in intra-school competitive activities during this academic year - analysis by year group and school type (2007/08)
66
49 55
66 70
75 77 80
77 72
59
48
65 67 62
All pu pils
Year 1
Year 2
Year 3
Year 4
Year 5
Year 6
Year 7
Year 8
Year 9
Year 10
Year 11
All p rima
ry
All s econ
dary All s
pecia l
%
Comparable figures on this question are only available for 2006/07, as in that year there
was a tightening of the survey question to emphasise that school sports days should not
be included in the reporting of intra-school competitive activities. However, the next chart
compares the 2006/07 and the 2007/08 data, and also looks at when partnerships were
[image:35.612.91.505.227.506.2]established.
Figure 19: Percentage of pupils involved in intra-school competitive activities during this academic year - comparison of partnerships established in 2003/04, 2004/05, 2005/06 and 2006/07
58 66
60 67
55 65
57 69
46 59
2006 /07
2007 /08
2006 /07
2007 /08
200 6/07
2007 /08
2006 /07
2007/0 8
2006 /07
2007 /08
%
Base: All pupils in year groups where information given (2006/07 - 6,299,952: 2007/08 – 6,230,817)
2003/04 partnerships
2004/05 partnerships
2006/07 partnerships All partnerships
operational at time of survey
2005/06 partnerships
Over the last two years there has been an increase in the proportion of pupils engaging
in intra-school competitive activities - up from 58% in 2006/07 to the current level of
66%. In terms of the dates when partnerships were established, it is clear that the most
recently established partnerships (2006/07) have a lower level of participation in
intra-school competition than do the longer established partnerships. However the latest data
4.2
Sports Days
In answer to a separate question, 99% of schools reported that they had held at least
one school sports day or equivalent during the 2007/08 academic year. This represents
a steady increase from the 2006/7 and 2005/6 surveys when respectively 98% and 97%
of schools reported that they had held at least one school sports day or equivalent. In
2007/8 incidence of school sports days varied by school type - for primary schools the
figure was 99%, while for secondary and special schools it was 97% and 96%
respectively.
4.3 Inter-school competition
In addition to information about intra-school competition (i.e. competition between
schools), the survey also measures the number of pupils who had taken part in
[image:36.612.93.508.417.670.2]inter-school competition during the relevant academic year.
Figure 20: Percentage of pupils involved in inter-school competition during this academic year - analysis by year group and school type (2007/08)
41 26 39 37 46 55 63 44 41 37 32 26 45 36 49
All pu pils Year 1 Year 2 Year 3 Year 4 Year 5 Year 6 Year 7 Year 8 Year 9 Year 10 Year 11
All p rima
ry
All s econ
dary All s
pecia l
%
Across Years 1-11 an average of 41% of pupils participated in inter-school competition
during the 2007/08 academic year, compared to 35% recorded in the 2006/07 survey.
Levels of activity peaked in Years 5 and 6 at 55% and 63% respectively but were much
lower in Years 1, 10 and 11 in particular. In special schools an average of 49% of pupils
had taken part in inter-school competition during the 2007/08 academic year, compared
to 45% of pupils in primary schools and 36% of pupils in secondary schools.
For the first three years of the survey, the question on inter-school competitive activities
only covered Years 4-11, and was extended in 2006/07 to cover Years 1-3 in light of
feedback from Partnership Development Managers and schools to the effect that there
was inter-school competitive activity among the lower age groups. We can therefore look
[image:37.612.90.504.365.622.2]at trends across the five surveys based just on those in Years 4-11.
Figure 21: Percentage of pupils involved in inter-school competition during this academic year - comparison of partnerships established in 2003/04, 2004/05, 2005/06 and 2006/07 (based on Years 4-11 only)
176808 SC01 21
33 35 37 40 43 33 36 38 41 43 33 38 40 43 36 39 43 36 41 2003 /04 2004 /05 2005 /06 2006 /07 2007 /08 2003 /04 2004 /05 2005 /06 2006 /07 2007 /08 2004 /05 2005 /06 2006 /07 2007 /08 2005 /06 2006 /07 2007 /08 2006 /07 2007 /08 %
Base: All pupils in year groups where information given
(2003/04 - 1,545,607: 2004/05 - 2,632,237: 2005/06 - 3,735,982: 2006/07 - 4,659,409: 2007/08 – 4,615,140) 2003/04 partnerships 2004/05 partnerships 2006/07 partnerships All partnerships
operational at time of survey
2005/06 partnerships
Based solely on Years 4-11, there has been a consistent rise over time among all
partnerships operational at the time of the particular survey - from a baseline of 33% in
2003/04 to the latest figure of 43% of pupils who are involved in inter-school competition.
Partnerships established in all four years showed increases every year, with most
recently established partnerships now achieving levels which are similar to the longest
established partnerships (41% v. 43%).
In addition to the question on inter-school competition included in the main
questionnaire, in the 2007/08 survey additional questions were asked of PDMs
concerning inter-school activity across the whole of the partnership. PDMs were asked:
Over the course of this academic year, during term time, what percent of pupils
across the whole of your Partnership would you estimate take part in organised
sports competitions between schools?
A high proportion of PDMs (34%) felt unable to answer the question, and even among
those who did provide an answer, the majority indicated that it was just a ‘rough
estimate’. Because of this the detailed results are not being presented in this report, as
their level of reliability is likely to be much lower than for the other questions included in
5.
Sports provision
Schools were asked to indicate the range of sports provided by their school during the
academic year, using a list of sports provided in the questionnaire. In 2007/08 a number
of sports were added to the list for the first time (baseball, fencing and handball) but the
mean figures reported exclude these sports, for the purposes of comparability.
The average number of the listed sports provided by schools during the 2007/08
academic year was 17.5. This again represents an increase over previous years - from
an average of 14.5 in 2003/04, to 14.9 in 2004/05, to 16.0 in 2005/06 and 17.0 in
2006/07. The number of listed sports provided varied by school type, with an average of
22.3 provided in secondary schools, 19.8 in special schools and 16.5 in primary schools.
Figure 22: Sports and activities provided during this academic year
1 1 1 1 * Kabaddi 34 31 29 25 26 Table tennis 1 1 3 6 8 Judo 34 33† 12 11 12 Rugby league (inc tag rugby) 2 2 2 2 2 Goalball 38 31 23 19 14 Golf 3 2 2 1 1 Skateboarding 39 37 35 32 31 Badminton 3 3 2 1 1 Angling 46 42 34 27 21 Cycling 4 3 2 2 1 Triathlon 62 59 55 48 46 Orienteering 5 5 4 3 3 Equestrian 68 66 74 71 67 Rugby union (inc tag rugby) 6 4 3 2 1 Boxing 69 69 67 63 65 Basketball 6 5 4 3 2 Bowls 74 66 56 39 26 Multi-skill clubs 7 6 5 4 4 Lacrosse 75 75 71 67 68 Outdoors/adventure 7 7 6 5 5 Squash 77 76 73 66 58 Fitness 9 7 4 3 2 Rowing 77 78 77 74 77 Hockey 9 8 6 5 4 Karate 79 79 76 71 70 Tennis 9 8 7 6 5 Boccia 81 81 81 81 84 Netball 11 11 9 8 8 Sailing 85 85 84 83 84 Swimming 13 12 10 9 7 Mountaineering 87 88 87 85 86 Rounders 14 11 9 7 4 Martial arts 90 90 89 85 85 Cricket 17 17 17 16 16 Softball 93 93 92 91 90 Athletics 24 22 16 12 7 Archery 94 95 95 93 94 Gymnastics 30 29 24 20 17 Canoeing 96 96 96 95 94 Dance 30 30 28 25 27 Volleyball 98 98 98 97 97 Football % % % % % % % % % % ’07 /08 ’06 /07 ’05 /06 ’04 /05 ’03 /04 ’07 /08 ’06/0 7 ’05/0 6 ’04/ 05 ’03 /04
Base: All schools (2003/04 - 6,574: 2004/05 - 11,498: 2005/6 - 16,898: 2006/07 - 21,745: 2007/08 – 21,631)
†surveys prior to 2006/07 did not include ‘tag rugby’ in definition
Overall the patterns of sports provision in terms of the most widely available sports have
remained fairly constant over the five years that this survey has been conducted.
Football, dance, gymnastics, athletics and cricket are the most widely available sports
and are provided by nine in ten schools. Many sports - particularly less mainstream
sports - have shown considerable increases in their availability over the last five years,
and it is this that has driven the overall increase in the mean number of sports provided.
The main increases in availability have been:
• Multi-skill clubs 11 - up from just 26% in 2003/04 to 74% in 2007/08
• Tennis - up from 70% in 2003/04 to 79% in 2007/08
• Fitness - up from 58% in 2003/04 to 77% in 2007/08
• Outdoors / adventurous activity - up from 68% in 2003/04 to 75% in 2007/08
• Orienteering - up from 46% in 2003/04 to 62% in 2007/08
• Badminton - up from 31% in 2003/04 to 39% in 2007/08
• Cycling - up from 21% in 2003/04 to 46% in 2007/08
• Golf - up from 14% in 2003/04 to 38% in 2007/08
• Table tennis - up from 26% in 2003/04 to 34% in 2007/08
• Canoeing - up from 17% in 2003/04 to 30% in 2007/08
• Archery - up from 7% in 2003/04 to 24% in 2007/08
• Mountaineering - up from 7% in 2003/04 to 13% in 2007/08
• Martial arts - up from 4% in 2003/04 to 14% in 2007/08
• Rowing - up from 2% in 2003/04 to 9% in 2007/08
The only sports that show a decline over time are judo - from 8% in 2003/04 to just 1% in
the latest survey, and netball - from 84% to 81%.
The apparent increase in rugby league in 2006/07 is probably due to a definitional
change and the inclusion of ‘tag rugby’ within the definition.
11
Clubs set up under the PESSCL strategy that use a variety of approaches and contexts to help children
develop physical skills (co-ordination, movement, thinking, body awareness) from a broad and appropriate
The three new sports included for the first time in 2007/08 were available in the following
proportion of schools:
• Handball - 10%
• Fencing - 9%
6.
Club links
Figure 23 shows the sports or activities which schools had links to during the academic
year. On average partnership schools had links to 7.6 different clubs - up from 7.0 in
2006/07 and from a baseline of just 5.0 different sports in the first survey in 2003/04. In
terms of school type, secondary schools had links to an average of 11.7, primary
schools an average of 7.0 and special schools an average of 6.1.
Figure 23: Club links during this academic year
* * * * * Goalball 10 10 10 8 9 Outdoors/adventure * * * * * Kabaddi 11 10 8 7 8 Table tennis 1 * * 1 * Softball 13 13 12 10 8 Judo 1 1 1 1 1 Skateboarding 17 14 12 10 10 Badminton 1 1 1 1 1 Boccia 17 14 11 7 6 Martial arts 2 2 1 1 1 Angling 17 14 11 8 7 Karate 2 2 2 1 4 Mountaineering 19 16 15 12 11 Fitness 2 2 2 1 1 Lacrosse 20 18† 10 9 10 Rugby league (inc tag rugby)
3 2 2 1 1 Triathlon 22 18 14 11 9 Golf 4 3 2 2 3 Volleyball 25 23 22 19 20 Hockey 4 3 3 2 2 Rowing 30 28 28 25 27 Basketball 4 3 2 1 1 Bowls 31 28 22 11 7 Multi-skill clubs 4 4 4 4 5 Rounders 32 30 29 26 26 Netball 6 4 3 3 2 Archery 40 35 31 26 24 Gymnastics 6 5 4 3 3 Squash 40 39 36 30 27 Tennis 6 5 5 4 8 Sailing 43 40 38 33 32 Athletics 6 6 5 4 5 Canoeing 45 42 37 29 26 Swimming 7 6 4 2 2 Equestrian 48 44 46 41 39 Rugby union (inc tag rugby)
7 5 4 1 2 Boxing 49 45 40 32 28 Dance 8 7 7 5 5 Orienteering 57 56 52 46 45 Cricket 10 8 6 5 4 Cycling 79 78 78 75 73 Football % % % % % % % % % % ’07 /08 ’06 /07 ’05 /06 ’04 /05 ’03/ 04 ’07 /08 ’06/ 07 ’05 /06 ’04 /05 ’03 /04
Base: All schools (2003/04 - 6,574: 2004/05 - 11,498: 2005/6 - 16,898: 2006/07 - 21,745: 2007/08 – 21,631)
†surveys prior to 2006/07 did not include ‘tag rugby’ in definition
* = Less than 0.5%
Consistently across all five surveys by far the most common link has been for football,
with 79% of schools in the 2007/08 survey reporting links with football clubs. This is
followed by cricket (57%), dance (49%), rugby union (48%), swimming (45%) and
athletics (43%). These broadly reflect the most widely available sports shown in the
previous chapter except that gymnastics which is a widely available sport does not
For a large number of the listed sports there have been considerable improvements over
time in terms of the proportion of schools which have relevant club links. The following
sports have all shown increases of more than ten percentage points between the first
and final survey:
• Cricket - up from 45% in 2003/04 to 57% in 2007/08
• Dance - up from 28% in 2003/04 to 49% in 2007/08
• Rugby union - up from 39% in 2003/04 to 48% in 2007/08
• Swimming - up from 26% in 2003/04 to 45% in 2007/08
• Athletics - up from 32% in 2003/04 to 43% in 2007/08
• Tennis - up from 27% in 2003/04 to 40% in 2007/08
• Gymnastics - up from 24% in 2003/04 to 40% in 2007/08
• Multi-skill clubs - up from 7% in 2003/04 to 31% in 2007/08
• Golf - up from 9% in 2003/04 to 22% in 2007/08
• Martial arts - up from 6% in 2003/04 to 17% in 2007/08
No sports have shown a decline in terms of the proportion of schools having relevant
club links over the course of the five surveys.
The three sports which were added to the 2007/08 survey recorded the following figures:
• Fencing - 4%
• Baseball - 1%
7.
Community sports, dance and multi-skill clubs
The survey collected information about pupils in Years 2 - 11 concerning their
participation in one or more sports, dance or multi-skill clubs with links to the school
[image:44.612.84.505.225.508.2]during the academic year.
Figure 24: Percentage of pupils participating in one or more community sports, dance or multi-skill clubs with links to the school during this academic year - analysis by year group and school type
32 35
38
41 43 44
30 28
25 23
19 40
25 33
All p upils
Year 2
Yea r 3
Yea r 4
Yea r 5
Year 6
Yea r 7
Yea r 8
Yea r 9
Year 10
Year 11
All p rim
ary
All se cond
ary
All sp ecial
%
Base: All pupils in year groups where information given (5,698,515)
Across Years 2-11, 32% of pupils had participated in one or more sports, dance or
multi-skill clubs with links to the school during the academic year. Large differences were
apparent in the proportions of those in different year groups who had taken part in one
or more community sports, dance or multi-skill clubs - in primary schools the proportion
increased by year group, to reach a peak of 43% and 44% in Years 5 and 6 respectively.
At Year 7, on entry into secondary school, the proportion declined significantly to 30%,
and reached a low of just 19% in Year 11. In the line with this, the overall figure among
Figure 25: Percentage of pupils participating in one or more community sports, dance or multi-skill clubs with links to the school during this academic year - comparison of partnerships established in 2003/04, 2004/05, 2005/06 and 2006/07
176808 SC01 25
19 22 27 29 32 19 24 29 31 34 16 27 29 32 24 28 32 22 28 2003 /04 2004 /05 2005 /06 2006 /07 2007 /08 2003 /04 2004 /05 2005 /06 2006 /07 2007 /08 2004 /05 2005 /06 2006 /07 2007 /08 2005 /06 2006 /07 2007 /08 2006 /07 2007 /08 %
Base: All pupils in year groups where information given
(2003/04 - 1,838,265: 2004/05 - 3,198,024: 2005/06 - 4,605,170: 2006/07 - 5,764,781: 2007/08 – 5,698,515) 2003/04 partnerships 2004/05 partnerships 2006/07 partnerships All partnerships
operational at time of survey
2005/06 partnerships
Survey Year
It is apparent that the proportion of pupils in Years 2-11 participating in one or more
sports, dance or multi-skills clubs has increased each year the survey has taken place,
from just 19% in 2003/04 up to 32% in 2007/08. This increase is apparent among
partnerships established in different years. The longest established partnerships have
now achieved 34% participation in club links, while the most recently established have
8.
Gifted and talented pupils
The Gifted and Talented strand of the PESSCL strategy was launched in September
2002. It is part of the Government’s strategy to improve gifted and talented education. It
aims to improve the quality of teaching, coaching and learning for talented young sports
people in order to raise their aspirations and to improve their performance, motivation
and self esteem. It is also encouraging more talented young sports people to join junior
sports clubs and to develop and strengthen the relationship between schools and the
[image:46.612.90.504.297.554.2]National Governing Bodies of sport.
Figure 26: Percentage of pupils currently registered as gifted and talented because of their ability in PE and / or school sport (Years 5-11 only)
7 7
8
7 7 7 7
6
All pupils Year 5 Year 6 Year 7 Year 8 Year 9 Year 10 Year 11 %
Base: All pupils in year groups where information given (4,051,754)
Questions on the gifted and talented programme were limited to pupils in Years 5-11, as
before this age group it is difficult to identify pupils in this way. Across Years 5-11 an
average of 7% of pupils are currently registered as gifted and talented because of their
ability in PE and/or school sport. This means that there are a total of nearly 290,000
pupils in partnership schools who are currently registered as gifted and talented. The
The figures presented for the latest 2007/08 survey are very similar to those recorded for
the previous survey, where again 7% of pupils across Years 5-11 were registered as
gifted and talented. Looking further back, there has been some increase from an original
9.
Sports volunteering and leadership
The final question in the survey collected information on the numbers of pupils actively
involved in sports volunteering and leadership during the academic year. The question
covers pupils in Years 1-13, although in 2005/06 it covered only Years 3-13, and prior to
[image:48.612.90.505.272.557.2]that it was just limited to Years 10-13.
Figure 27: Percentage of pupils actively involved in sports volunteering and leadership this academic year - analysis by year group and school type (2007/08)
16
4 9
7 10
27 34
12 13 17
26
19
13 9
16 17
10
All pu pils
Year 1
Year 2
Year 3
Year 4Year 5Year 6
Year 7
Year 8
Year 9
Year 10
Year 11
Year 12Year 13 All p
rima ry
All s econd
ary
All s peci
al
%
Base: All pupils in year groups where information given (6,597,117)
A total of 16% of pupils across Years 1-13 were involved in sports volunteering and
leadership during the 2007/08 academic year. This means that more than 1 million
pupils have been involved in partnership schools. As in previous years the figures vary
considerably by year group, peaking at Year 6 (34%), Year 5 (27%) and Year 10 (26%).
In secondary schools the average figure was 17% and in primary schools it was 16%. In
Figure 28 shows the comparison over time, but limited to Years 10-13, to allow
[image:49.612.92.504.156.429.2]comparisons to be made across all five surveys.
Figure 28: Percentage of pupils actively involved in sports volunteering and leadership this academic year - comparison of results over time (Years 10-13 only)
176808 SC01 28
Base: All pupils in Years 10 -13 where information given
(2003/04 - 533,302: 2004/05 - 807,264: 2005/06 - 2,197,167: 2006/07 - 1,556,506: 2007/08 – 1,550,990)
20
17
13 11
9
2007/08 2006/07
2005/06 2004/05
2003/04
%
Over the course of the five surveys there has been a considerable increase in the
numbers of pupils in Years 10-13 actively involved in sports volunteering and leadership
- from a baseline of 9% in 2003/04 up to the latest figure of 20%.
For the last two years we have comparable data based on all pupils from Years 1-13.
Here there has also been an increase - from 12% up to 16% in 2007/08 among pupils in
Figure 29: Percentage of pupils actively involved in sports volunteering and leadership this academic year - analysis by region (Years 1-13 - 2007/08)
16 20
18 18 18
16 16
14 14 13
All East North West
North East
South West
Yorks & Humber
South East
West Mids
London East Mids %
Base: All pupils in year groups where information given (6,597,117)
If we look at the results for the individual regions, it is clear that there are some small
differences. The East of England has the highest proportion of pupils who are actively
involved in sports volunteering and leadership at 20%, while the West Midlands, London,
and the East Midlands are all at a lower level. These are very similar regional patterns to
10. Conclusions
This report draws to a conclusion the series of five surveys which have evaluated the
School Sport Partnership Programme over the period 2003/04 to 2007/08. Much has
been achieved over these five years. The ‘headline’ is of course that the 2008 PSA
target of 85% pupil participation in at least two hours of PE and out of hours school sport
has not only been achieved, but has been exceeded by five percentage points, and was
indeed already met a year early in 2006/07. Furthermore, all partnerships have achieved
the target of at least 75% of their pupils participating in two hours of PE and school
sport, with the poorest performing partnership achieving 78% participation, and 75 of the
450 partnerships achieving 95% participation or above.
These results lead us to believe that over the last five years there has been a major
change brought about in schools by the PE, School Sport and Club Links strategy, with
pupils across the country benefiting from it. The progress in primary schools has been
particularly impressive. The first survey in 2003/04 revealed that levels of participation in
Years 1 and 2 were part