April 2007
Disabled students in London
A review of higher and further education,
including students with learning difficulties
Disabled Students in L
ondon
Public Liaison Unit
Greater London Authority
Telephone
020 7983 4100
City Hall
Minicom
020 7983 4458
The Queen’s Walk
www.london.gov.uk
More London
London SE1 2AA
You will need to supply your name, your postal address and state the
format and title of the publication you require.
If you would like a summary of this document in your language, please
phone the number or contact us at the address above.
Chinese
Hindi
Vietnamese
Bengali
Greek
Urdu
Turkish
Arabic
Punjabi
Gujarati
City Hall
The Queen’s Walk London SE1 2AA
www.london.gov.uk
Enquiries 020 7983 4100
Minicom 020 7983 4458 MoL/Apr07/VL D&P/MT/953
Published by
Greater London Authority City Hall
The Queen’s Walk More London London SE1 2AA
www.london.gov.uk
enquiries 020 7983 4100
minicom 020 7983 4458
ISBN 978 1 84781 012 0
Cover photograph © www.JohnBirdsall.co.uk
Author
Robin Barer
Acknowlegements
This report would not have been possible without the advice, comments, analysis and practical help of many people. I would like to thank Mark Watts, Dave Morris, Muge Dindjer,
Lorna Spence, Gareth Piggott, Tony Evans, Jacquie Burke, Paul Levay, Sharon Field and the Design and Publications Team, all in the Greater London Authority; Micheline Mason (Alliance for Inclusive Education); Richard Rieser (Disability Equality in Education); Jennifer Dyer (Skill); Jim Price (formerly of London Central LSC); Gareth Ashcroft, Elaine McWilliam, Stephen Horwood and Andrew Holt, all from the LSC London Region; Paul Martin (London East LSC); Judy Akinbolu (HEFCE) and the staff of the HESA Information Services Team.
Executive summary (conclusions and key findings) 3
Recommendations 21
Introduction: Scope, methods and context of the report 25
A HIGHER EDUCATION 32
1 Student numbers and characteristics 32
1.1 Numbers and representation 32 1.2 Factors affecting entry to higher education 37
1.3 Domicile 42
1.4 Impairments 43
1.5 Gender 51
1.6 Age 52
1.7 Ethnicity 52
1.8 Social class 55
2 Patterns of study 56
2.1 Mode 56
2.2 Qualification aim 58
2.3 Subject 59
3 Student finances and accommodation 63
3.1 Student finances 63
3.2 Accommodation 65
4 London institutions 66
4.1 Proportion of disabled students 66 4.2 Institutions and Disabled Students’ Allowance 69
5 Graduate destinations 71
B FURTHER EDUCATION 81
1 FE background and definitions 81
2 Student numbers and characteristics 86
2.1 Numbers and representation 86 2.2 Factors affecting participation in further education 90
2.3 Student profile 93
2.4 Impairments 93
2.5 Gender 98
2.6 Age 100
2.7 Ethnicity 102
3 Patterns of study 105
3.1 Mode of study 105
3.2 Level of study 108
3.3 A note on under-achievement 110
3.4 Destinations 113
4 Student finances 114
4.1 Financial support 114
4.2 Some proposed reforms 116
4.3 Financial situation of disabled students and
potential students 118
5 Learning and Skills area 118
6 Travel to study 120
C ADULT AND COMMUNITY EDUCATION 121
Numbers; age; the uses of ACE; prospects for disabled students in ACE
Further and adult education: Conclusions 128
Bibliography 137
Appendix: HESA rounding strategy 145
Abbreviations 146
Glossary 148
TABLES
Higher education
1 Disabled students in London and the UK, 1998-2004 33 2 Disabled students by impairment, London 2004/05 43 3 Number and percentage of disabled students in London
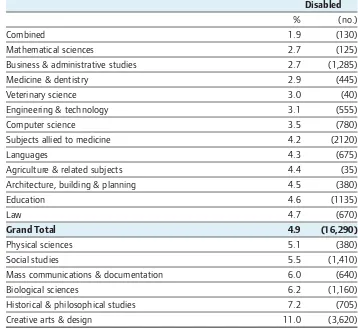
and the UK, 1998-2004, with details of impairment 48 4 Percentage of students in each subject who are disabled, in
ascending order: London 2004/05 60 5 Disabled students in London HE institutions,
2004/05: Per cent in ascending order 68 6 Graduate unemployment by impairment in the UK,
2004/05: UK domicile 74
Further education
7 Students with a disability/health problem by impairment,
London 2004/05 94
8 Students with learning difficulties, London 2004/05 97 9 Age, disability/health problem and learning difficulty:
London FE students, 2004/05 101 10 Mode of study, disability/health problem and learning
difficulty: London FE students 2004/05 105 11 Highest level of study by disability/health problem &/or
learning difficulty: London FE students 2004/05 107 12 Learning and Skills area: Per cent and number with
FIGURES
1 Trends in the proportion of London higher education students with dyslexia and ‘unseen disabilities’,
1998-2004 46
2 Trends in the proportion of London higher education students with sensory impairments, ‘multiple disabilities’
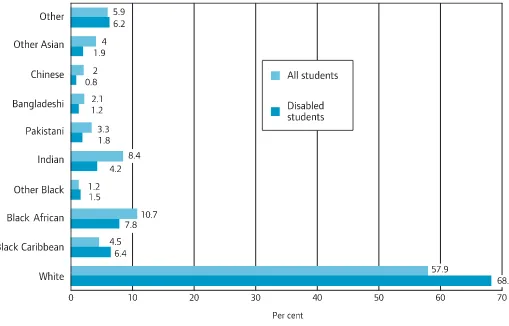
and ‘mental health difficulties’, 1998-2004 47 3 Higher education: Disability and ethnic group of
UK-domiciled London students, 2004/05 54 4 Qualification aim and disability in higher education:
London 2004/05 58
5 Further education: Gender, disability/health problem and
learning difficulty, London students 2004/05 99 6 Further education: Ethnic group, disability/health
problem and learning difficulty: London students
London is one of the great learning centres of the world. It has more than a million students in further and higher education, studying one of the broadest range of subjects in any world city. London is a diverse city and equality of opportunity in education is fundamental to achieving potential in life.
This report is about the position of disabled students in London. There are over 63,000 disabled people studying in London’s further and higher education sectors.
However, disabled people are under-represented in post-16 education; this report shows that they still face
disadvantage within the education system.
In higher education, financial factors are a deterrent for potential students who are disabled, and lack of information is also a problem. However the most significant barriers are staff attitudes and access to buildings and equipment. Issues around accessible housing and transport also continue to affect people's choices.
In further and adult education, there is major under-representation of disabled people among the older students. This report also provides evidence of under-achievement among disabled students in the sector.
For students with learning difficulties, there is still a lack of routes into employment.
At the same time, the Disability Rights Commission notes progress in response to legislation, and the proportion of students who are disabled has been growing. There are also new opportunities to improve the education of disabled people through the London Skills and Employment Board,
© Liane Harris
PHOTO REDACTED DUE TO THIRD PARTY RIGHTS OR
which I chair, and through London’s Adult Skills, Training and Employment Strategy.
I'm committed to London being a beacon for inclusion and accessibility. It is fundamentally important that we continue to recognise the disadvantage faced by disabled people within education and identify and remove barriers to ensure greater participation and to effect equality of opportunity for all London's students.
Ken Livingstone
A CONCLUSIONS
(Note: In these conclusions, ‘disabled’ students includes those with learning difficulties)
1 Cross-sector
In both higher and further education there has been a long-term rise in the number and proportion of students who
identify as disabled. This might reflect real growth, an increased willingness to disclose a disability, or a combination of the two.
There is thought to be a significant degree of non-disclosure in both sectors, which makes interpretation of the figures
difficult. Disclosure has the potential to cause anxiety among students and staff, and is related to the need to see the information put to good use. Details about disability are sometimes passed on inappropriately or not passed on at all. A positive environment combined with appropriate use of the information will encourage more students to identify as
disabled.
The Disability Rights Commission finds evidence of progress in both sectors in response to legislation, and has identified some basic elements of good practice, such as provision of lecture notes in advance. It also mentions a lack of consistency. Students still encounter prejudice and physical barriers. Disability tends to be seen as an add-on in the move to widening participation.
There are some other significant cross-sector findings:
• Mode of study is strongly related to the type of impairment, and could offer clues to raising the participation of disabled people.
2 Higher education
There has been a significant rise in the percentage of students who are disabled, but it is highly uneven and it is thought that overall, disabled people are still under-represented. The
statistics help to identify areas of strength and weakness:
Areas of under-representation
A Impairments
Were it not for dyslexic students, there would have been no increase in the proportion of students who are disabled
between 1998 and 2004. Dyslexic students now make up more than half of all disabled students in London.
Among non-dyslexic students, there has been significant growth for those with ‘mental health difficulties’ and ‘multiple disabilities’, as a percentage of all students. In contrast, the number and proportion of students with ‘unseen disabilities’ has fallen, and there has been little or no progress for students with mobility or sensory impairments.
Comparison with the Labour Force statistics and other surveys suggests that people with mobility impairments and mental health issues have especially low representation among higher education students, but more detailed analysis would be needed to confirm this.
Age, mode of study and graduate employment are all
associated with impairment and these should be considered when an impairment group is under-represented.
B Subject
Disabled people in London have a particularly low
C Institution
There are huge contrasts between institutions in the degree to which they take on disabled students. The association of high entry standards with low representation indicates a danger of a two-tier system developing.
D Other areas of student under-representation include
• Pakistanis, Bangladeshis and Other Asians. (This needs to be confirmed by further analysis). • Overseas students
• Postgraduates.
E Graduate unemployment
The most significant inequality to emerge from the statistics is in graduate unemployment, which is more than one and a half times as high for disabled recent graduates. This may well deter potential students. The transition between university and
employer needs more attention and liaison between sectors. One encouraging sign is that disabled and non-disabled graduates find jobs of similar quality.
Financial factors are an issue for potential students. There are remedies which do not require major resources; these include
• more effective spread of information, and raising awareness of Disabled Students’ Allowance and Access to Work and
• more liaison between government departments and ensuring a safety net, so that graduates do not end up worse off than before.
The new Office for Disability Issues can contribute to this.
Universities are limited by financial constraints and by the relatively low qualifications of disabled people at age 18.
3 Further and adult education
(Note: ‘Disabled students’ here includes those with learning difficulties)
In further education (FE), disabled people are well represented under 25 and very under-represented over 60. They are also probably under-represented in the 25-59 age group. In Adult and Community Education (ACE), the student age profile is much older than in further education, and older disabled people have the least representation.
Both government initiatives and research tend to concentrate on the younger learners, which could have a bearing on the participation rates.
There are other areas of low participation for disabled people:
• People with ‘other medical conditions’ (for instance asthma, epilepsy, diabetes). • People with mental health issues.
• Bangladeshi, Pakistani and Other Asian students.
These groups seem to be under-represented in higher education too, but in both sectors there is a need for more detailed analysis to confirm the findings.
Besides age participation, under-achievement is the other main theme to emerge from the further education review.
Reclassification of the statistics strongly suggests that disabled learners of good academic potential are under-achieving; although many are studying at high levels, too many are on level 1.
Research indicates that disabled students still face major
Under-achievement of a different kind is also an issue for students with learning difficulties, many of whom are educated separately. Lack of direction and the revolving door are still common experiences of separate learners. Students themselves would like more routes into employment.
There is some consensus that the system for disabled students is too complex and requires more coordination and planning. A common funding approach and better liaison between sectors and agencies should benefit disabled students.
There is less agreement on some of the recent government proposals for the sector as a whole. The government wishes to concentrate funding on skills which fit people into
employment, while general education becomes more the
province of local authorities and voluntary organisations. There is concern among researchers and staff that general FE and ACE will be neglected, although they provide a valuable service to the community.
The House of Commons Education and Skills Committee warns of a threat to various kinds of adult learning and notes cuts that have already taken place. The threat is both to leisure education and to more practical courses like access learning and skills for employability.
The debate about further education affects disabled people too. Government initiatives, like raising the number of people with levels 2 and 3 and extending adult learner grant, should benefit mainstream disabled students. Yet, the Learning and Skills Council is concerned that students at lower levels may be neglected and proposes more focus on progression at pre-entry and level 1. There is also good prima facie evidence that
There will be new opportunities to deal with these issues
through the London Skills and Employment Board and through London’s Adult Skills, Training and Employment Strategy, which will be open to public consultation.
The further education sector needs to review its statistics, especially its classification of learning difficulties. Figures should connect in a meaningful way to achievement and level of study. Statistics for the Workers’ Educational Association should be kept separate from the student figures for London.
B KEY FINDINGS: HIGHER EDUCATION
Figures are for 2004/05, except where otherwise mentioned
Student numbers and characteristics
In 2004/05, 4.9 per cent of London higher education students identified themselves as disabled, nearly 18,000 people; this compares with 7.4 per cent of residents aged 16-34 who reported a work-limiting disability. There is no clear-cut benchmark in the resident population, but
under-representation of disabled people in the student population is now officially acknowledged.
The proportion of London students who are disabled has grown steadily since 1998, when it was 3.1 per cent. However, some of this increase may be due to an increased willingness of students to identify themselves as disabled (e.g. dyslexic students). It is thought that a significant number of students are still reluctant to ‘disclose’ their disability.
UK domiciled students are more than three times as likely as others to be disabled, both in London and in the UK as a whole.
(1998-2004). Dyslexic students now make up over half of all disabled students in London and 43 per cent in the UK.
In London and the UK, there has been significant growth in the number and proportion of students with ‘mental health
difficulties’ and with ‘multiple disabilities’.
Students with ‘unseen disabilities’ (e.g. diabetes, epilepsy, asthma) have fallen significantly as a proportion of the total student population, in London and the UK (1998-2004). From being the largest group of disabled students they have become the second largest. They have also fallen in absolute numbers.
In London, the percentage of the student population who are visually impaired fell slightly between 1998 and 2004. There has only been a slight increase in the proportion of the student population with hearing impairments in the same period.
In 1995, a higher percentage of the UK student population had mobility difficulties than now, but the monitoring rate was low. Students with mobility difficulties seem to have very low
representation in higher education, compared to their numbers in the population.
Overall, disabled and non-disabled students have similar age and gender profiles, but there are wide differences by
impairment, and the age bands are very broad.
In London in 2004, 68.2 per cent of disabled UK domiciled students were white, compared with 57.9 per cent of all students.
Comparison with the Census (ages 16-34) suggests that among white and Black Caribbean students in London, disabled people as a whole are not under-represented (although some
Analysis of national statistics in 1999-2000 found that disabled students were of slightly higher social class than their non-disabled counterparts.
Patterns of study
In London, only 28 per cent of disabled students are part-time, compared to 36 per cent of those not disabled. Dyslexic
students have a low part-time rate. In contrast, students with hearing impairments (49 per cent), mobility difficulties and ‘mental health difficulties’ have rates of part-time study above the student average.
Disabled students are relatively well represented in first degree courses. They have a relatively weak representation in
postgraduate and ‘other’ qualifications.
In London, disabled students have a low representation in business studies, maths, medicine, and applied sciences; on the other hand, there is a relatively high proportion in biology, social studies, history and philosophy, and especially creative arts and design.
Subject studied is linked to some extent to impairment.
However, students with every kind of impairment are found in almost every subject.
Finances and patterns of living
Research published in 2004 suggested that the financial situation of students living with parents and on Disabled Students’ Allowance was satisfactory. Mature students were in a financially more precarious state, dependent on a
combination of benefits and student support. Students with high support needs had inadequate financial aid.
Research in the UK published in 2005 suggests that increased tuition fees affect disabled students more than most.
Comparison of institutions
The proportion of disabled students recorded in each London institution varies from one in five hundred to one in five. There is little overall difference between new (post-1992) and old universities.
Institutions specialising in the arts have the highest proportion of disabled students; however, only some of these have high proportions of students with Disabled Students’ Allowance.
There is a rough correlation between the Disabled Students’ Allowance indicator and the proportion of disabled students, but there are many exceptions.
There is some connection between high entry qualifications and low rates of Disabled Students’ Allowance, which is apparent mainly for full-time students. Concerns about the development of a two-tier system in universities might be applied to disabled people as well as other ‘non-traditional’ groups.
Barriers affecting students and potential students
A major cause of lower participation by disabled people is lower qualifications at age 18. However, the figures do not take learning difficulties into account.
Even with the same level of qualifications, disabled people are much less likely to participate in higher education.
Financial factors are a deterrent for disabled people contemplating higher education
Changes in accommodation and transport arrangements affect disabled people more than most and deter them from higher education.
The move from further to higher education is better managed than most transitions, but there is room for considerably more liaison between sectors.
Research suggests the need for stronger links between widening participation and disability practitioners.
The most significant barriers to disabled students in higher education are staff attitudes and access to buildings and aids. The Disability Rights Commission has noted progress in
response to legislation, but also a lack of consistency.
Disabled recent graduates
The economic activity rate in London was 78 per cent for disabled recent graduates, compared to 82 per cent for their non-disabled peers (2004/05). The gap is much greater for the working population as a whole, especially those without
qualifications.
In 2004/05, the graduate unemployment rate for London institutions was 7.3 per cent (non-disabled) and 12.5 per cent (disabled). There is a similar gap in the working age population as a whole.
The unemployment rate for disabled London graduates from non-white minorities is 17.3 per cent, compared to 4.8 per cent for their non-disabled white peers (2004/05).
The unemployment rates of disabled graduates vary by impairment. In the UK in 2004/05, they ranged from 8 per cent (‘unseen disabilities’) to 18 per cent (visual impairments).
Disabled graduates as a whole are less likely than others to become health professionals and more likely to take up creative jobs. These employment trends are consistent with the subjects which they tend to study.
C KEY FINDINGS: FURTHER EDUCATION
1. Figures are for 2004/05, except where otherwise mentioned. For convenience, ‘students with learning difficulties and/or disabilities &/or health problems’ are often described here as ‘students with disabilities/learning difficulties’. 2. The statistics in this report do not include students of the Workers’ Educational Association, because it is a national body.
Student numbers and characteristics
9.5 per cent of London further education students were known to have a ‘disability &/or learning difficulty’ in 2004, or 45,100 people.
Comparison of student figures with the Census shows that disabled people as a whole, including those with learning difficulties, are well represented under 25 and very under-represented over 60. They are also probably under-under-represented in the middle age group, but detailed comparisons are not currently available.
Comparison with the Labour Force Survey is not exact, but it suggests that people who declare ‘other medical conditions’ (like asthma, epilepsy and diabetes) are under-represented in the student population.
For 13 per cent of the London student population, there was no information on disability/learning difficulty in 2004. Statistics on disability/learning difficulty in further education must therefore be treated with caution.
In further education, there are separate classification systems for learning difficulty and disability/health problem. In 2004 in London, there were 26,300 students with a disability/health problem and 24,700 with a learning difficulty. The two groups overlap, with a large minority having a disability and a learning difficulty.
The largest groups of students with a disability/health problem are classified as ‘other’ (28 per cent) and ‘other medical
condition (e.g. asthma, epilepsy, diabetes)’ (16 per cent). People with ‘other medical conditions’ seem to have a low representation in further education, when compared to other people with a disability/health problem. The largest groups of students with learning difficulties have ‘other’ learning
difficulties (28 per cent), followed by ‘moderate learning difficulties’ and dyslexia (both at 26 and a half per cent).
61 per cent of further education students are women. However, a higher proportion of male students have a disability/learning difficulty. Among students with learning difficulties, females only slightly outnumber males.
Most further education students (disabled and non-disabled) are aged 25-59 and 6 per cent are 60 or over. The age profile is closer to that of the general population than in higher
education, but still weighted towards youth, with more than a third of all students being under 25. (2004 London figures)
Age profile is strongly related to impairment. Overall, students with learning difficulties have a young age profile, and disabled students are older than the average for further education
students.
The ethnic profile of students with disabilities/learning difficulties differs from that of London students as a whole. They are much more likely to be White British or White Irish; they are also more likely to come from a Black Caribbean, Black Other or Mixed background. On the other hand, a relatively small proportion of students with disabilities/learning difficulties come from an Asian, African or Other White background.
Comparison with the Census working age population suggests that disabled people are most under-represented among Pakistanis, Bangladeshis, Other Asians, the White Irish and Other White group. More detailed age comparisons would be needed to confirm this.
In 2004, over a third of all London further education students came from a deprived area. There was little difference between students with disabilities/learning difficulties and the rest in this respect.
Level of study
A Students with a disability/learning difficulty study at a much lower level than those with none. In this respect, there is little difference between ‘disabled’ students and those with ‘learning difficulties’, as defined by the Learning and Skills Council.
B Under revised classifications used only for this report, 45 per cent of ‘disabled’ students are studying at level 1, compared with 61 per cent of students with ‘learning difficulties’, and 38 per cent of students with no disability/learning difficulty. (Under the Learning and Skills Council classifications, the figures are 53, 53 and 38 per cent respectively).
lower levels than their non-disabled peers, but the gap is moderate and much less than that shown in the official statistics. The figures indicate that ‘disabled’ students are under-achieving.
D All classifications of disability or learning difficulty are subject to error. It is likely that the new classification of ‘learning difficulty’ includes some students who are under-achieving.
Quality of learning and under-achievement
Research indicates that the quality of provision for students with disabilities/learning difficulties is inconsistent. Evidence on progress since the time of the Tomlinson Committee (1996) is mixed. Students have noted some positive developments in response to the new legislation. On the other hand, a review of provision in the London North Learning and Skills
Council/Connexions area found that the system was too complex and was understood neither by users nor providers.
On the whole, education is less satisfactory for students on separate courses than those in the mainstream. A review by the Learning and Skills Council (2005) challenges the ‘revolving door’ provision for students that are not learning new skills and sometimes return to the same course. There is also some
positive evidence for separate courses in some circumstances.
Mainstream students with disabilities/learning difficulties have clearer progression routes on the whole, but some are below the level of their aspirations. The Learning and Skills Council (LSC) identifies a difficulty in monitoring the quality of learning for the mainstream students.
The learning experience can be also be affected by barriers which have nothing to do with the quality of courses
themselves. These include access to buildings and equipment, and unhelpful or hostile staff attitudes.
Mode, travel, area
38 per cent of students with learning difficulties study full-time, compared with 28 per cent of disabled students and 28 per cent of those without disability/learning difficulty. More detailed analysis shows that mode of study is strongly related to impairment, in further as in higher education.
Outreach is the preferred mode of study among some students with mental health issues.
In 2004, the proportion of students with a disability/learning difficulty ranged from 8.6 per cent in London North and London Central to 10.3 per cent in London West. Monitoring rates varied from 74 per cent in London North to 92 per cent in London East.
London Central takes relatively high numbers of students with ‘mental ill health’ and ‘emotional/behavioural difficulties’.
Of the further education students with a disability/learning difficulty and resident in London, 9 per cent attended colleges outside the capital in 2004. Not all these students travel to study; some of them attend outside residential colleges. The outflow exceeds the inflow (below).
Of the further education students with a disability/learning difficulty and studying in London, 6 per cent come from outside London.
Skills area from their own. Of the students with a
disability/learning difficulty studying in London, 24 per cent reside in a different LSC area. There is a considerable amount of travel, some students going right across the capital, and this highlights the need for accessible transport in London.
Barriers to participation
A survey of disabled young people aged 16-24 found that, of those who had not gone on to further or higher education, nearly one third had been discouraged because of their impairment. For example, they were worried about support, transport or accommodation. (Disability Rights Commission).
Transitions involve more planning for disabled people than most, and at age 16, the situation is particularly complex. Research shows the need for better, more accessible information and more coordinated support at this stage. (Disability Rights Commission; Learning & Skills Development Agency)
D KEY FINDINGS: ADULT AND COMMUNITY EDUCATION
Of the students funded by the Learning and Skills Council in adult and community education in 2004/05, 9.9 per cent had a disability/learning difficulty. There was no information for 17 per cent of students.
Comparison with the Census figures shows that disabled people, including those with learning difficulties, are well represented under 25 and under-represented in the middle and older age groups, especially over 60.
In adult and community education, one third of students with a disability/learning difficulty are aged 60 plus, compared to just over one fifth of those without. Relatively few students with disabilities/learning difficulties are under 25.
Non-vocational benefits of further and adult & community
Students with disabilities/learning difficulties have stressed the wider benefits of education, such as social and leisure pursuits. They want access not only to core learning but also to a range of mainstream facilities, such as sport and computer suites. (Learning and Skills Council).
A Scottish study found that for many further education
students with disabilities/learning difficulties, the benefits were mainly social. This was most noticeable for learners over 40. The authors concluded that vocational inclusion is unrealistic for some, and that colleges should do more about social inclusion.
7 HEFCE, institutions and professional associations
Investigate and seek remedies for the low representation of disabled people in medicine, mathematics and business studies. Share examples of good practice and role models.
8 HEFCE and institutions
Investigate and seek remedies for the very low participation of disabled people in some institutions. Share examples of good practice.
9 Skills and Employment Board, GLA group and all HE stakeholders
Forge strong links between institutions, careers advisers and employers, with the aim of increasing the employment of disabled graduates. (GLA= Greater London Authority. For GLA group, see glossary)
Further education (FE)
(Note: ‘Disabled’ here includes people with learning difficulties)
10 London Skills and Employment Board, government, Learning & Skills Council (LSC) and institutions
Find ways to increase the participation of older disabled adults, including people over 60.
11 Government, Transport for London
Clarify and strengthen transport provision for students over 19 (disabled and non-disabled). Consider extending the duty to make transport provision for students under 19 to those over 19, as recommended by the LSC.
12 London Skills and Employment Board, Government, Job Centre Plus, GLA group
Government should implement the LSC recommendations for more supported employment, and more routes into
routes into employment for people with learning difficulties, using Disability Equality Schemes as a tool.
13 Government
Consider increasing the number of Connexions advisers.
(Research in North London shows that they are valued but that more are needed).
14 Government
The government should re-consider its funding priorities so as to
• increase the employability of students with learning difficulties • take account of the needs of disabled people who study for
other reasons than the need to find a job.
15 London Skills and Employment Board, GLA group, local authorities, all stakeholders
Implement the white paper recommendations to ‘support collaborative working between agencies… to improve the transition planning both into FE and into employment’ for ‘students with disabilities/learning difficulties’. GLA group to work out its own role in this collaboration.
Adult and Community Education (ACE):
16 Government, National Institute of Adult and Continuing Education (NIACE)
Further research, improving statistics:
Government, Funding bodies and London Skills and Employment Board to consider how to fill these gaps in research and information
A Review student statistics in the FE sector: Find more effective and acceptable categories for learning difficulty and disability, which relate in a meaningful way to academic achievement; reduce the size of the ‘other’ categories. Statistics for the Workers’ Educational Association should be separated from the student figures for London. (FE)
B Analyse in more depth the participation of disabled people by age band. Research the reasons for the low participation of older adults in FE, taking into account trends over time, their qualifications and reported experiences. (FE)
C Investigate the situation of disabled people coming to study in London from other parts of the UK, including their
accommodation. (HE)
D Investigate the low representation of disabled people among overseas students. (HE)
E Investigate the participation of disabled people among
Bangladeshi, Pakistani and Other Asian students. (FE and HE)
Introduction: Scope, methods and
context of report
There are about 63,0001
disabled students in further and higher education in London, and with full equality of opportunity, there could be considerably more. This review coincides with several major policy initiatives affecting the lives of disabled people and the introduction of new laws affecting their rights. The information here will, it is hoped, be useful to disability organisations and student unions, as well as
institutions aiming to promote disability equality and widen educational participation.
The government plans to continue the expansion of student numbers in higher education (HE) and some sections of further education (FE). The recent white paper on FE reform states: ‘Our aim must be to be leading the world in skills development with virtually all young people staying on to age 19 and half going on to HE; all adults having the support they need to up-skill and re-up-skill throughout life; all employers seeing up-skills as key to their success’ (DfES March 2006). In both sectors, widening participation is a key element of government policy and is the object of funding incentives; the aim is to raise the number and proportion of students from non-traditional backgrounds, including low income groups, state schools, mature students, ethnic minorities and disabled people.
In HE and FE there has been an increase in the number and proportion of disabled students, but some groups (e.g. students with ‘unseen disabilities’) have been left out of this process. Research suggests that, in educational institutions, disability has generally been seen as an add-on in the move to widening participation (LSDA Project 18, 2004; Tinklin, Wilson & Riddell 2004).
In London, the Mayor will in future be able to influence developments as Chair of the newly appointed London Skills and Employment Board, which is charged with publishing an Adult (post-19) Skills, Training and Employment Strategy. Current strategies for London already have some bearing on post-16 education; for example –
• The Children and Young People’s Strategy has an action point (5B.5.2) ‘to address the skills and training needs of those groups of young people {under 18} who are severely
disadvantaged or face multiple barriers to employment’ (GLA Jan. 2004).
• The Older People Strategy states that ‘the role of adult
education in promoting independence and wellbeing must be fully recognised across government and that funding should reflect both its benefits and importance to older people’ (GLA Sept 2006). This is relevant for disabled people too.
Scope and Methods
This review collates statistical information on publicly funded post-16 education for disabled students in London, mainly their demographic characteristics, patterns of study, and financial funding. The figures are the latest reliable ones available at the time of writing. In higher education, data are to hand for
Relevant policy and research material is also brought in, to provide context for the figures. This is still not a
well-researched area and few studies have concentrated on London. However, the situation improved with national programmes initiated by the Disability Rights Commission and Learning and Skills Development Agency. The research references used here are based mainly on small-scale studies and some larger
national projects, several of which include London. Many of the issues affecting disabled students are the same in London and elsewhere, but differences are pointed out where they occur. Although legislation and policy are moving fast, the issues themselves can be long-standing, like pathways into
employment for students with learning difficulties; this means that research a few years old can still be relevant.
The review is wide-ranging but does not claim to be
exhaustive. Some sectors of post-16 education, such as school education for 16-19s, work-based training and government training, are not covered here; also missing is information on social life, student retention and disabled staff. These are all important topics and omissions are purely based on limitations of time and resources. In a recent research project on the experiences of disabled Londoners, some participants mentioned the need for more disabled staff in educational institutions, because they might be more likely to understand the barriers faced by disabled students and to provide role models for potential future students (Ionann, Future Inclusion and Equal Ability Ltd for GLA, March 2006). There are also some equalities issues, like faith and sexual orientation1
, which are not addressed here; standard statistics are not available on these subjects, and they would require separate research.
All sectors
1 Institutions, student unions
Students should have full control of whether and when they ‘disclose’ their disability, but be encouraged and supported to do so. Information about disability should be confidential, passed to the relevant people without delay, and to no one else. These procedures should be built into the administration of the institution, as part of the disability equality scheme.
2 Funding bodies, government, institutions
Consider the importance of study mode for the participation of disabled people, taking account of impairment where relevant. Find ways to use mode flexibly, so as to increase participation.
3 Funding bodies, institutions
Find ways to increase the participation of under-represented impairment groups, e.g. people with mobility and unseen impairments (epilepsy, diabetes etc). Research and monitor the participation of impairment groups, where relevant.
4 Government, funding agencies and institutions
Publish statistics which gauge more effectively the extent of under-achievement among disabled people. Institutions should ensure that nobody capable of high-level study is excluded from it because of disability.
Higher education (HE)
5 Government, institutions and student unions
Spread awareness of Disabled Students’ Allowance to all students and potential students.
6 Higher Education Funding Council for England (HEFCE), institutions
Disabled people: Legal and policy context
The Special Educational Needs and Disability Act 2001 extended the provisions of the Disability Discrimination Act 1995 to further, adult and higher education (‘DDA Part 4’). It introduced, among other things, new duties for institutions not to discriminate against disabled people and to make reasonable adjustments to ensure that they are not put at a substantial disadvantage. The Act came fully into effect in September 2005; it covers students and would-be students but not
graduates; for example, it is not currently illegal to discriminate against disabled graduates if they wish to use the careers service at their former university.
The Disability Discrimination Act 2005 extends the definition of disability to cover people diagnosed with HIV or multiple
sclerosis, and more people with cancer. There is now a positive duty to promote disability equality in the public sector, which came into force in 2006 and includes the educational
institutions covered here. Thus, public authorities now have to anticipate disabled people’s access needs; they also have to ensure that delegated persons, like contractors, take disability equality into account. (Ionann, Future Inclusion and Equal Ability for GLA, March 2006).
The social model: Disability, impairment and health
Attitudes towards disabled people are affected by one’s perspective or ‘model’. To explain the models, one must distinguish disability from impairment: An impairment is a physical, mental or functional limitation in the individual; a disabled person is someone with an impairment who cannot function fully in society. For example, a short-sighted person has an impairment but is not disabled if he/she wears glasses. This distinction is now widespread and is used, for example, in government social surveys as well as by disability organisations.
The traditional or ‘medical’ perspective located the ‘problem’ in the individual: Because of some physical or mental impairment, the individual needs to be treated or rehabilitated so as to fit more easily into society, or else given special separate services. This view has been criticised by many disabled people. The social model of disability locates the problem in society: Social or physical barriers cause disability, by preventing people with impairments from taking part in the life of the community on an equal level with others. Barriers can include poor design in the built environment, inaccessible information, prejudiced attitudes or clumsy organisation (e.g. benefit traps). The social model of disability encourages cooperative problem-solving, and far more engagement of disabled people than occurred in the past. It also shifts the focus away from impairments
towards making adjustments and changing attitudes. This is the approach adopted by the Greater London Authority.
A further distinction needs to be made, between disability and (long-term) health problem. Many disabled people have no health problem. To label them as ‘ill’ is inaccurate and also implies that they need treatment.
dismissal) and in this sense, they are ‘disabled’. However, people with long-term health problems do not necessarily identify as disabled; they are joined by many old people and other people with impairments who may not apply the
‘disabled’ description to themselves. It is important that these people are included in all programmes of adjustment and equalities promotion. Some standard forms like the Census return take account of these issues.
Although the shift of emphasis has been away from the individual towards society, it remains important for some disabled people to access appropriate rehabilitation and specialist services. Disabled people in general also need equal access to medical services to treat and prevent illness (as distinct from impairment).
Note on definitions and categories
Definitions of disability vary widely, as do the circumstances in which information is gathered. These variations cause problems in the statistics; for example, it is hard to compare the
proportions in the student population with those in the
population at large. This does not make the figures worthless, because one can make precise comparisons where the same definition is used, for example between disability status and qualification aim, and broad comparisons elsewhere.
Definitions of disability differ in further and higher education, because of their separate administration and funding. This makes sector comparison difficult, but in both sectors, disabled people are thought to be under-represented. (Adult and
This report makes use of existing classifications and does not attempt to re-write them. Disability is self-assessed, although in practice, assessment in FE is often made by parents or
professionals. Disabled people then place themselves in various impairment categories (described as ‘disabilities’ in HE), which are pre-set by the sectors; the technical nature of these
categories (e.g. ‘autistic spectrum disorder’ in HE, ‘severe learning difficulty’ in FE) imply that these are labels, not necessarily used by the students themselves.
Language affects the way one thinks about disabled people and some of the categories may be unacceptable to a number of disability organisations as well as individuals. There is also room for argument about the usefulness of impairment classifications which do not reflect the social perspective on disability; some people would prefer to get away from such classifications entirely, but others think that reference to impairment is acceptable when relevant. The answer may depend on how far impairments affect the type of adjustment that needs to be made; sometimes impairment is relevant to the solution and sometimes it is not. Having made these
qualifications, the author believes that the data here are useful in locating areas of low participation, and that these areas are sometimes impairment-linked.
Higher education involves study at a standard above A Level or its equivalent (see glossary for full definition).
The sector was largely inaccessible to disabled students until HEFCE (the Higher Education Funding Council for England) began to fund improved provision in 1993. One of the key documents on HE policy, the Dearing Report 1997, had little to say on disability until it received comments from Skill, which represents disabled students. These comments led to the Disabled Students’ Allowance (DSA) being extended to part-time students and no longer means-tested. In 1999, premium funding was introduced, to benefit institutions on the basis of DSA numbers. In 2002, disability discrimination against
students in HE became illegal (DDA Part 4). (Tinklin, Wilson & Riddell, 2004)
1 STUDENT NUMBERS AND CHARACTERISTICS
1.1 Numbers and representation
Notes: a) Raw numbers from HESA are subject to the HESA rounding strategy, which means that total frequencies may not sum exactly; the effect is minimal. See Appendix for details.
b) With the exception of Table 1, London Metropolitan University, which has about 30,000 students, is excluded from the student figures for 2004/05. However, it appears in the graduate destinations figures.
Table 1 shows the proportion of students who are disabled. It should not be used as an indicator of the number of students in London. People of unknown disability status are excluded in each year. There are also about 15,000 higher education
students based at further education institutions, who are not included in the figures from the Higher Education Statistics Agency (HESA). Allowing for these factors, one could estimate a student total for London of about 385,000 in 2004/05. In both London and the UK, the student population has
continued to grow, but the rate of growth has slowed down in the last three years (2001-2004), especially in London. Student growth gives more opportunities for raising participation from under-represented groups, like disabled people.
More recent figures from UCAS (the Universities and Colleges Admissions Service) show that in the UK, admissions of full-time undergraduates rose in 2005/06 but fell by 3.6 per cent in 2006/07 (final figures 18/1/2007). Provisional figures for 2007/08 show a 6.4 per cent rise in the number of applicants (14/2/2007). The drop in 2006/07 probably reflects the introduction of top-up fees in that year. (This report mainly uses HESA figures, which deal with the student population but not admissions, and cover a wider range of students than UCAS).
Table 1 Disabled students in London and the UK, 1998-2004
London UK
1998 2001 2004 1998 2001 2004
Disabled % 3.1 3.8 4.9 4.1 4.8 6.5
No. 8,480 12,495 17,785 72,090 98,030 134,380
No known % 96.9 96.2 95.1 95.9 95.2 93.5
disability No. 264,655 316,665 346,330 1,681,735 1,933,270 1,945,680
TOTAL* % 100 100 100 100 100 100
No. 273,135 329,160 364,115 1,753,825 2,031,300 2,080,060
Source HESA
* a) The Total excludes unknowns, who for most columns comprise less than 5 per cent of all students, but for the UK in 2004, 9 per cent were unclassified. In London in 2004, the figure was less than 2 per cent. In London and the UK, most students of unknown disability status are part-time, and most are on ‘other courses’, as opposed to first degrees or postgraduate work (mode and level of study are analysed separately for this purpose); this is not an issue for London, where monitoring rates are high in all categories, but it leads to unreliability in some of the UK figures, mentioned in the sections on mode and level of study below. b) HESA figures include postgraduate, overseas and part-time students, among others. c) Raw numbers are subject to HESA rounding strategy, which means that total frequencies may not sum exactly.
Disabled students: Disclosure or real increase?
recently, with 9.1 per cent unknowns in 2004. The latest figure for disabled students in London was 4.9 per cent in 2004, or 17,800 students. (For full-time first-degree students, the London figure was 6 per cent).
Students are under no obligation to ‘disclose’ a disability. Although the percentage of unknowns is now less than 2 per cent for London, there is thought to be a significant degree of under-reporting, in the capital and elsewhere, which results in disabled people being classed as ‘no known disability’, i.e. not disabled. The extent of this under-reporting is not known but, according to the Universities and Colleges Admissions Service, a significant number of students do not declare a disability; the main reason may be that they fear non-admission (UCAS personal communication). There are also people who do not identify as disabled, for example, many students with dyslexia or mental health issues. In a 2001 article, Healey et al.
estimated that the actual proportion of disabled students could be closer to 10 per cent than 5 per cent (quoted in Fuller, Bradley & Healey 2004. The figures are national and not for London).
The fact that people are reluctant to identify themselves as disabled is itself significant. Research indicates that this
reluctance is not entirely groundless, because disabled students report a range of attitudes in HE institutions. When students do disclose, the information is not always well handled. Information is sometimes not relayed to the right people. Conversely, there is sometimes inappropriate sharing of
information. Some students said they wanted to control when and where they gave information about their impairment. (Fuller, Bradley & Healey 2004; Borland & James 1999)
James 1999). Students may therefore feel under pressure to reveal aspects of their lives which can attract stigma.
Comment on disclosure
Missing information and non-disclosure raise questions about the interpretation of the figures. To some extent, the rise in the proportion of students who are disabled may reflect an increase in disclosure. This is probably the case with dyslexia, which is now much more recognised than it used to be; ‘mental health difficulties’ are also more acknowledged as an impairment for which adjustments can be made. Since more than half of all disabled students in London are dyslexic, the ‘disclosure effect’ might account for much of the change in the figures.
There are positive aspects to self-disclosure, in that it implies confidence on the part of the student and facilitates the provision of support. At the same time, questions are raised about the real growth in the numbers of new disabled people applying for higher education, in London and elsewhere. The figures for impairment (HE section 1.4 below) raise particular concern about the progress of people with unseen impairments (epilepsy, asthma etc) and with visual, hearing and mobility impairments.
Under-representation
It is hard to find reliable standards of comparison for these student figures. Prevalence rates for disability in the population cannot be established conclusively and vary with the context and type of questionnaire. (For a more thorough though less recent discussion of this, see GLA Oct. 2003 and Feb. 2004).
Comparison with official figures suggests that disabled people are under-represented among higher education students in London. The London ‘benchmarks’ quoted here are also slightly too low, because roughly 40 per cent of UK-domiciled students in the capital come from other parts of the country, where there is a greater percentage of disabled people in the
replaces the former Labour Force Survey), the proportion of young people (16-34) with a work-limiting disability in London was 7.4 per cent; this may be the most realistic benchmark. If all kinds of disability are included (limiting work and/or daily activities), the APS figure was 8.9 per cent. The Census 2001 also provides a higher benchmark for disabled young people than the London figure of 4.9 per cent; only the Family Resources Survey might suggest that disabled people are not under-represented in London’s student population (FRS figures for disabled young people in London - 5 per cent in 2003/04 and 2004/05, but the sample is small). (APS figures provided to GLA, 2005. FRS figures from DWP, 2005).
Disabled students also seem to be under-represented in the country as a whole, although the proportion is rising. There is a higher proportion of students who are disabled (6.5 per cent in 2004/05, compared with the capital’s 4.9 per cent) but this reflects the higher proportion of disabled people in the national population.
However, allowance must also be made for those people with learning difficulties who may not benefit from higher
education. If one allows for this factor, HE representation in 2004/05 might approximate the Census and FRS figures, but fall some way short of the APS figures1
.
Under-representation of disabled people in HE is now officially acknowledged. The Higher Education Funding Council for England (HEFCE) has introduced a new performance indicator for institutions - the percentage of undergraduates in receipt of Disabled Students’ Allowance (DSA). Not all disabled students
are eligible for, or apply for DSA. HEFCE considers the DSA figures to be more robust than the proportions who say they are disabled. (This makes DSA suitable as a performance indicator, but the present review aims at a wider coverage of disabled people). There has been a rapid rise in the proportion of students on DSA (perhaps its use as a performance indicator has a bearing on this):
• In 2004/05, 3.5 per cent of full-time undergraduates in the UK were in receipt of DSA. This compares with 1.5 per cent in 2000/01.
• The figure for part-time undergraduates (half-time or more) was 1.9 per cent, compared with 0.4 per cent in 2000/01. This excludes the Open University, which had 2.4 per cent in 2004/05.
(Source: HESA 2005)
These points about under-representation are all subject to the qualification about under-reporting.
1.2 Factors affecting entry to higher education
‘Being disabled you have to fight to achieve; most disabled people going into further or higher education are very determined people. You have to have a certain mind set to apply and go through university as disabled people.’
(Participant in recent research for GLA; Ionann, Future Inclusion and Equal Ability Ltd, 2006).
1 Qualifications.
The National Audit Office (NAO) in 2001 argued that lower qualifications at age 18 was the main cause of lower
participation of disabled 18-year olds in higher education. If learning difficulties were taken into account, the qualifications gap would be smaller but still significant (see, for example Table 11 below, for the situation in further education).
confidence. A large minority of disabled pupils attend special schools, which the Rowntree Foundation divides into two broad categories: A few special schools have high academic standards and win loyalty, but most have low expectations and
achievement. The trend is towards mainstreaming of disabled children, but the Foundation argues that this policy must take into account the loss of specialist support and resources which can ensue. (Hendey & Pascall 2001; NAO 2002)
In further education, there is also a division between
mainstream and separate courses. Students with disabilities and/or learning difficulties report more satisfactory experiences on mainstream than on separate courses (which cater for
students with learning difficulties, and to a lesser extent other kinds of impairment). However, some young people with learning difficulties value residential colleges. (Anderson et al 2003; Mitchell 1999)
2 Discrimination in the selection process?
This is not supported by the NAO findings in 2001, where there was no overall difference in the application success rates of disabled and non-disabled applicants. The word ‘overall’ is important here: Some London institutions, and some subjects, are much more successful than others at recruiting disabled students (HE sections 2.3 & 4 below); this of itself does not imply discrimination, but it needs investigation.
A review of policy innovations in HE concluded that financial constraints on universities have encouraged selection of those needing least support. Some staff, especially in old universities, were also worried that additional support would give unfair advantage and undermine standards. (Riddell, Tinklin & Wilson, 2004). These are qualitative and not statistical findings.
There is more evidence of indirect than direct discrimination in the selection process; for example, fear of debt, lack of
themselves can all put disabled people at a disadvantage. Some of these factors are briefly described below.
3 Less participation with the same qualifications.
Even with level 3, 18-year olds with disabilities or health problems were 20 per cent less likely to participate than those without (NAO 2002). This point is important. The participation gap for disabled people is greater than the social class gap, on which there has been considerable research. There are
deterrents to higher education for well-qualified disabled people. There is some research evidence as to what these deterrents might be:
a) Financial. A recent qualitative research project found that financial obstacles were a deterrent for disabled people contemplating further or higher education. The disabled research participants were concerned, among other things, about the risk of losing current benefit arrangements; the risk of taking out student loans which they might not be able to repay; and uncertainty as to whether concessionary fees or grants would be available. (Ionann, Future Inclusion and Equal Ability Ltd for GLA, 2006).
From 2006/07, universities have been allowed to charge variable fees (also known as top-up fees), in addition to the current standard tuition fees. This affects UK domiciled
students and could lead to an increase in the already high level of debts. (The NUS Press Pack 2006-2007 has some
estimates). For disabled students or potential students, there will be additional complexities, for example, worries about finding work on graduation and ability to pay off their debts, or about benefit levels if they are unable to find work.
b) Information. A repeated finding from research is that disabled people need more information in advance, on financial and other support, courses, assessment formats etc. For instance, there appears to be widespread lack of awareness of Disabled Students’ Allowance, not only among people contemplating HE, but even in HE itself (LSC National Office 2005; NDT/Skill 2004; Sanderson 2001). Thus, there are unrealistic financial worries as well as realistic ones mentioned above.
Information needs to come in accessible formats and through the right channels. One study of the FE to HE transition found that students wanted a named person to answer their
questions without prejudicing their applications. (Sanderson 2001)
c) Changes in accommodation and transport arrangements affect disabled people more than most (Wilson 2004). One aspect of this that needs investigation is the effect on potential disabled students from other parts of the UK.
d) Skills and aspirations. A review found that FE students lacked the opportunities to develop skills for independent living that were needed for higher education. Lack of aspiration, among some disabled people themselves or their parents, could also be an issue (NDT/Skill 2004). Low educational expectations from other people, like parents or teachers, can go with low self-esteem.
e) Perceived and real barriers within HE itself. This is a major topic. The Disability Rights Commission has noted progress in response to legislation, but also a lack of consistency. For example,
provision of lecture notes in advance is often a sticking point; yet it is part of base-line provision and appreciated by non-disabled as well as non-disabled students (Tinklin, Wilson & Riddell 2004; NFER for DRC 2003). A review in 2004 found that most institutions aimed for mainstreaming but there was still a long way to go. Provision was largely the province of support services and only a small minority of teaching staff felt adequately
barriers included staff attitudes and access to buildings and aids (Riddell, Tinklin & Wilson 2004).
So far, few research studies have compared the learning needs of disabled and of non-disabled students, who may also face barriers (e.g. lecture slides removed too quickly). Avramides and Skidmore developed and distributed a ‘learning for all’ questionnaire for the entire student population of one university (2004) and found no real difference between
disabled and other students in the support available and their learning needs. They argued that it was counterproductive to single out disabled students for support, because they were at risk of drop-out during the assessment of need stage;
moreover, a much larger group of students would benefit from support services but received none. They concluded that an all-inclusive approach would benefit students as a whole. (Quoted in York University et al., 2006).
Most people in the field advocate at least some specific policies aimed at disabled people. However, several have argued that good practices for disabled people would benefit all students (University of York et al., 2006).
This is a fast developing area; the public duty to promote disability equality came into force in December 2006 but the scale of change required implies that this will be a continuing process.
Several of the hindrances to participation relate to the
More effective transitions are now part of the Learning and Skills Council’s National Strategy for ‘students with disabilities and/or learning difficulties’. The LSC proposes to work more closely with the Higher Education Funding Council for England (HEFCE), Jobcentre plus and other agencies to support highly skilled people into higher education and employment, and in this context it mentions the higher skills needs of London. (LSC Oct. 2006)
There is also a need to bring disability into the mainstream of widening participation initiatives. For example, there could be stronger links between WP and disability practitioners
(NDT/Skill 2004; Riddell, Wilson & Tinklin 2002). The National Audit Office found that in 2001, less than 30 per cent of HE institutions used the disability premium for outreach and marketing; this contrasted with the two thirds who used the postcode premium (aimed at lower income groups) for such purposes (NAO 2002). WP activities for children up to year 11 rarely seem to include disability as an issue (personal
communication from Children and Young People’s Unit, GLA). The new duty to promote disability equality demands more forward planning and a less reactive approach.
1.3 Domicile
More than a fifth of London’s students come from overseas - 7 per cent from the EU and 15 per cent from non-EU countries.
In London, 5.7 per cent of UK domiciled students are disabled, compared with 1.7 per cent from elsewhere. UK domiciled students are more than three times as likely as others to be disabled, both in London and in the UK as a whole. These differences persist when age and mode of study are taken into account. Representation of disabled people is low among students from the EU and lower still among non-EU students.
qualify for Disabled Students’ Allowance (although there are some exceptions for EU students in certain circumstances). However, the duty not to discriminate applies to all disabled students, including those from overseas (DRC website).
1.4 Impairments
Note on language: The categories in the tables below are termed ‘disabilities’ by HESA but ‘impairments’ here, in line with the definitions shown in the glossary, which follows the social model of disability. Otherwise, the report uses the HESA terminology, for ease of reference.
Disabled students are asked to give details of their
[image:52.595.84.438.439.624.2]impairments. The statistics collated here may help to identify trends and some areas of low participation.
Table 2 Disabled students by impairment, London 2004/05
Impairment No. %
Dyslexia. 8,530 52.4
Blind/are partially sighted. 415 2.5
Deaf/have a hearing impairment. 760 4.7
Wheelchair user/have mobility difficulties. 530 3.2
Personal care support. 35 0.2
Mental health difficulties. 680 4.2
An unseen disability, e.g. diabetes, epilepsy, asthma. 3,005 18.4
Multiple disabilities. 530 3.3
Autistic Spectrum Disorder. 30 0.2
A disability not listed above. 1,785 11.0
Total disabled 16,290 100.0
Source: HESA
Notes: a) The total excludes unknowns, and students from London Metropolitan University. b) Raw numbers are subject to HESA rounding strategy, which means that total frequencies may not sum exactly.
c) Percentages do not sum to 100, because of rounding errors.
Dyslexic students now make up over half of all disabled
60 per cent). The number of dyslexic students more than trebled in the same period. Greater recognition of dyslexia and more disclosure help to account for this trend. Whereas in the early 1990s, it was hard to gain Disabled Students’ Allowances for dyslexia, by the end of the decade, 59 per cent of all students on DSA in England were dyslexic (NAO 2002). Staff have sometimes been concerned about possible abuse of the system and dyslexic students sometimes face suspicion or lack of comprehension. At the same time, research indicates that staff on the whole are now more aware of the real issues facing dyslexic students, and most universities offer a range of
support facilities with amended assessment (Cottrell in Powell 2003). Diagnosis is often delayed. However, Plymouth
University is paying particular attention to identifying dyslexia; according to Plymouth’s Disability Assist Services, students can start courses without realising they are dyslexic, so staff are trained to recognise the symptoms (THES 30/1/2004).
In contrast, there was only a modest increase in the number of non-dyslexic disabled students in London between 1998 and 2004, and as a proportion of the total student population, they stayed the same – at 2.3 per cent (‘unknowns’ excluded. For impairment trends, see Figs 1 and 2 and Table 3 below).
The lack of progress for non-dyslexic students masks differences between impairments (Figs 1 and 2 and Table 3 below). In London and the UK, there has been significant growth in the number and proportion of students with ‘mental health difficulties’ and with ‘multiple disabilities’; the large category of ‘unclassified disabilities’ has grown significantly in the UK, as a proportion of the stude