Abstract: In the modern world the main objective of any system is to keep their network or system Threat free. It’s not an easy one to ensure security in this threat progressing cyber world. So, many things are going on to get an solution to this everlasting issue. Threat intelligence is used to solve this cyber threat to a maximum extent. The proposed system describes an environment that will check whether the operations are going good in an organization or not in a real time. For an large organization with large capital it is easy to afford the customized tools that are available in the market. But it is not the same with the small ones. The proposed system is more practical and any small organization can afford this solution to detect most of the malicious operation that are going on their environment either local or remote. A threat intelligence interface, the proposed system will detect and prioritize the threats that are going on the network at a particular point of time.
I. INTRODUCTION
In the present world there are many tools that are used in different scenarios in collecting the logs and analyzing those logs to detect the malicious activity. There are also many commercial tools to give the same more accurately. Here, our main aim is to derive an amicable architecture keeping a small organization in the mind. So, I am going to propose an architecture with the combination of open source tools that can give thumping competition to the commercial tools. The tools I am using in this Architecture is a combination of tools Including Elasticsearch, Logstash and beats from the ELK Environment, OpenVPN and threat intelligence environment to find the threats. So, that we can take action on them.
The main reason why many use the commercial tools is it don‟t need much knowledge on the internal working of the tool while using those tools everything is automated in these tools from the collection of the logs to the generating the report to the client. The tools we are using to provide an architecture is very practical on using in a small organization consisting of a small bunch of employees. In this treat growing world there much demand for the security operation centers. By using this architecture many can built an environment with less effort and more accuracy.
A. Elasticsearch:
Elasticsearch is the one of the components in the Elk framework. This acts like a search engine which accepts the raw data from the sources and organize the data to form different indexes. We can use some interfaces to retrieve the
Revised Manuscript Received on May 10, 2019.
M Harikanth, M Tech Student, Department of CSE, Koneru Lakshmaiah Education Foundation, Guntur, AP, India.
Dr P Rajarajeswari, Associate Professor, Department of CSE, Koneru
data from this engine. This is java-based tool capable to accept schema- free JSON files.
B. Logstash:
Logstash is used to collect the logs or data from different sources, Filter that data, process that data according to the need and forwards to the particular destination respectively. There are many filters in the Logstash. Here there are three modules in the Logstash (Input, Filter, Output).
In this Architecture the Logstash will forward the processed data from different sources to the Elasticsearch.
C. Beats:
Beats are also a part of the Elk Framework. These are the collection of light weight processes. These are used to collect particular data from the machines respectively. The collected data is sent to the particular destination. In this Architecture we will forward the data to the Logstash where this data is transformed and forwarded to the Elastic search. There are Five types of beats in the Elk framework.
Filebeat:
Filebeat will forward the log data and the data from the Particular path to either Logstash or Elasticsearch. So that they can make the data to indexes to obtain the desired Information.
Metricbeat:
Metricbeat will forward the related to the metrics of the operating system and also the services statistics that are running in the system to the Elasticsearch or Logstash periodically.
Packetbeat:
Packetbeat will forward the network packets of a particular network to the Elassticsearch or logstash. This data is used to perform the analysis on the network traffic and detect the malicious behavior in the network.
Winlogbeat:
Winlogbeat will forward the logs related to the windows operating system infrastructure events. This will ainly concentrate on the windows environment.
Malicious Event Detection Using ELK Stack
Through Cyber Threat Intelligence
Auditbeat:
Auditbeat will forward the logs related to the hashes of the operating system files when those files are modified or replaced. As most of the attacks takes place by modifying the operating system files This plays crucial role by collecting this information.
D. OpenVPN:
OpenVPN is used to provide a secure tunneling to the remote connections. Here we are using this to establish a secure tunnel between the client and server. Here the servers are placed in the remote area. In order to view the data about the server that is at most confidential we use this OpenVPN for transferring the data securely. This will provide more security in the opensource environment.
II. SOC ARCHITECTURE
A SOC (security operation center) is trending in India. Everyone think as there is a antivirus in the systems, and firewalls in the networks the network or systems are secure. But, this is changing now a days. Antivirus takes a bunch of days to detect a file or hash as a malware or threat. The behavior of the attacks are remaining same in most of the instances. In Soc monitoring takes place 24x7 on what are operations are taking place in a network.
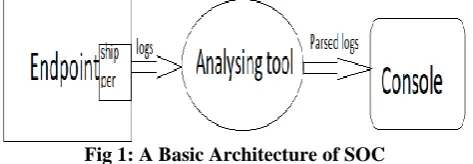
[image:2.595.304.562.289.430.2]The detection of the threat or vulnerability takes place taking in to consideration of the behavior of the end points. In the Soc we will collect the logs from the firewalls or the endpoints server by installing shipper. That shipper will collect the logs from particular path mentioned and forward those logs to the destination specified. There we use the analysis tools those will perform analysis on those logs as configured. The operations that the tool will perform includes parsing the raw data, deriving a architecture from that raw data and generating a report from the analysis performed.
Fig 1: A Basic Architecture of SOC
In the above fig the architecture of the soc is depicted these are the components a basically the soc must contain. Here, the endpoint may be a system or a firewall or a server. A shipper is installed on the endpoint and configured from where to collect logs and where to forward. From there the logs are collected and shipped to the Analyzing tool. There many analyzing tools those collect the logs from the shipper either locally or remotely and perform analysis on those logs to derive a desired outcome from there a network engineer can view the logs in particular format and detect the issue happening at the endpoint. The parsed logs are sent to the console where the the structured or parsed logs are displayed `on the screen where the engineers will detect the malicious activity in particular network.
III. ELK ARCHITECTURE
The analyzing tools we are using is the elk tools. This consists of three components namely Elasticsearch, Logstash. The logs from the shippers are forwarded to the Elasticsearch with the help of the logstash which is the Parsing tool. In the Elasticsearch the data will be parsed in to structured data. From there to the tool which can visualize that data in to different structures so that the engineer can understand. In this architecture the logstash collect the data from different sources and merge those logs independently and forward those logs to the Elasticsearch.
[image:2.595.51.288.484.566.2]In the elasticsearch the logs are formed in to different clusters. The data with similar features is formed in to a cluster. This organizing of the data in to clusters will helpful in easy retrieving of the data from the database. The data elasticsearch receives from the endpoint is a raw data without any particular structure and difficult to understand by the elk architecture. So, we use elasticsearch to make the logs in to clusters which is the basic unit of data in Elk.
Fig 2: Showing Interface of the Elastic Search.
In this showing the Interface of the Elasticsearch. Here this shows the name of the data and also the cluster names in which the data is parsed and formed in to structures.
IV. THREAT INTELLIGENCE
After collecting the logs and storing the next main task is to find out the malicious traffic that may considered as a threat to the network or system. The logs that are collected and stored is huge lump. It‟s not easy task to analyze and find the malicious one manually. So, Here I am giving a gui Architecture that is used to find the threats easily. This will analyze the logs that are collected and prioritize them low to high threats. This classification is done by corelating the logs with the database that consists of information of what are the logs that can be considered to specific group. This also provides the graphs for easy understanding.
V. NETWORK TAP
Tap is a hardware device used to capture the data when placed between networks or in a network. We place this device between the firewall and the endpoint systems. Every requests and the responses are can be monitored by placing tap in between the firewall and the endpoint systems. This will duplicate the traffic that is going through it. This neither alters nor drop the packets it collects as it is and forwards to the monitoring device. This device does not need any configuration.
VI. WORK FLOW
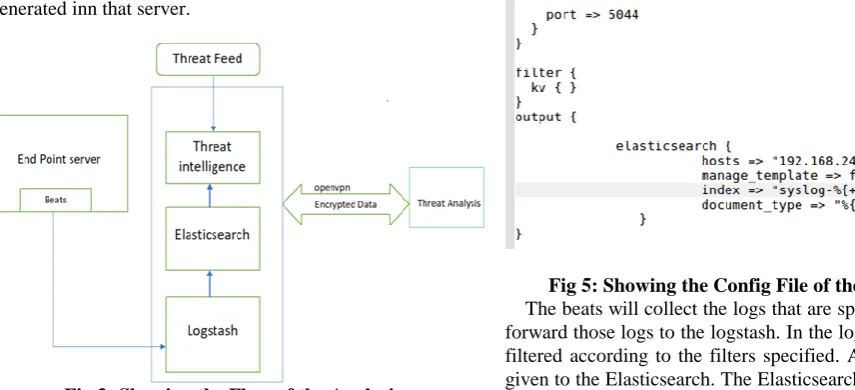
In this we are going to see what are all the process is going on in this architecture. Firstly, we have to choose a server to which all the endpoint systems are connected and of which we have to collect the logs and perform analysis. In that server we have to install the Beats which will forward the logs that are generated inn that server.
Fig 3: Showing the Flow of the Analysis
Above figure is showing the work flow. Here we install the beats and configure the .yml file that is located in the path „C:\Program Files\name of the beat‟. We have to configure the file what information it has to take from the system and which it have to forward the logs either logstash or elasticsearch.
Fig 4: Showing Config File
The above figure showing the logs that the beats have to collect is configured in the configuration file.
Now we have to setup a elasticsearch and logstash to collect the logs and parse the logs. The Fig2 shows the interface of the elastic search after the installation and starting the service.
In order to launch the elasticsearch here I used Apache server. By giving the ipaddress of the machine with the port number 9200 we can view the interface of the elasticsearch for example: http://192.68.1.255:9200 on searching of this url the elasticsearch interface can be seen.
We also have to install the logstash if you want to filter the particular logs, we can filter the logs. In the logstash there will be three components.
INPUT: In this we will specify from where the logstash has to take the data from. Mostly this will take the data from the beats that are configured in the server.
FILTER: Basically, in this we will write the filter in order to collect the particular logs on which we are concentrating on.
OUTPUT: In this output we will specify to which destination we are going to send the data. Most of the time it will be elastic search.
[image:3.595.52.480.266.461.2]This configuration details are shown in the Fig5.
Fig 5: Showing the Config File of the Logstash. The beats will collect the logs that are specified paths and forward those logs to the logstash. In the logstash the data is filtered according to the filters specified. And the output is given to the Elasticsearch. The Elasticsearch in turn receives the data from the logstash and perform parsing on the data. What this elastic search will do is form the logs in to indexes which are denoted as a table in the sql language.
This also acts as a search engine. After the data is stored in a structured manner, we can easily retrieve that information.
After the logs are indexed those logs are forwarded to the threat intelligence. In the threat intelligence the logs are prioritized into low to high basis. This classification is done by the corelating the real time logs with the threat feed that threat intelligence takes from the sources. This will compare the logs with that information and classify this log as threat or not.
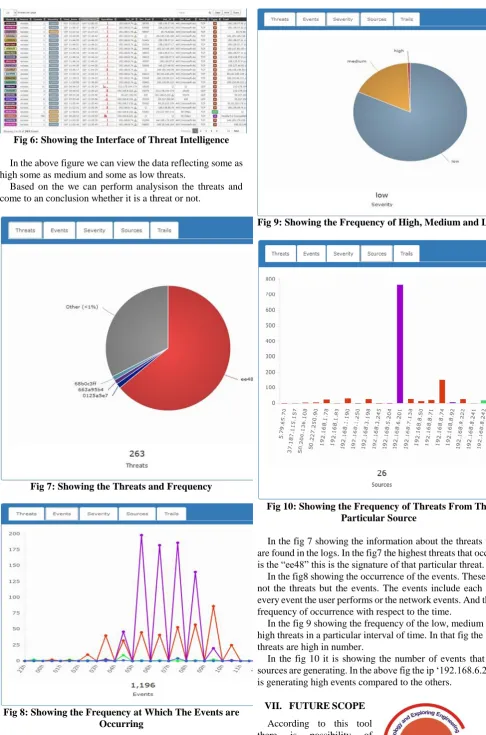
Fig 6: Showing the Interface of Threat Intelligence
In the above figure we can view the data reflecting some as high some as medium and some as low threats.
Based on the we can perform analysison the threats and come to an conclusion whether it is a threat or not.
[image:4.595.47.534.42.778.2]Fig 7: Showing the Threats and Frequency
Fig 8: Showing the Frequency at Which The Events are Occurring
Fig 9: Showing the Frequency of High, Medium and Low
Fig 10: Showing the Frequency of Threats From The Particular Source
In the fig 7 showing the information about the threats that are found in the logs. In the fig7 the highest threats that occurs is the “ee48” this is the signature of that particular threat.
In the fig8 showing the occurrence of the events. These are not the threats but the events. The events include each and every event the user performs or the network events. And their frequency of occurrence with respect to the time.
In the fig 9 showing the frequency of the low, medium and high threats in a particular interval of time. In that fig the low threats are high in number.
In the fig 10 it is showing the number of events that the sources are generating. In the above fig the ip „192.168.6.201‟ is generating high events compared to the others.
occurrence of the false positives. So, in future we can develop much more architecture that can detect the threats with more accuracy.
By integrating some more intelligence tools we can increase the accuracy of the threat findings.
VIII. CONCLUSION
By using this tool, we can detect the threats to the maximum range after the threats are detected we can manually remove the files that are causing the threats.
REFERENCES
1. Ibrahim Yahya Mohammed AL-Mahbashi, Dr. M. B. Potdar, Mr. Prashant Chauhan. (2017) “Network Security Enhancement through Effective Log Analysis Using ELK” International Conference on Computing Methodologies and Communication (ICCMC), 978-1- 5090-4890-8/17
2. Kwon, “Performance of ELK Stack and Commercial System in Security Log Analysis”
3. Online “Open Source Search & Analytics” elastic. 4. Online “SwiftOnSecurity/sysmon-config” github 5. Online “AutorunsToWinEventLog” github
6. Online “Sysmon - Windows Sysinternals” docs.microsoft
7. María del Carmen Prudente Tixteco, Lidia Prudente Tixteco, Gabriel Sánchez Pérez, Linda Karina Toscano. “Intrusion Detection Using Indicators of Compromise Based on Best Practices and Windows Event Logs” International Conference on Internet Monitoring and Protection (ICIMP 2016), 978-1-61208-475-6
8. Automating Threat Intelligence for SDL Raghudeep Kannavara ; Jacob Vangore; William Roberts ; Marcus Lindholm ; Priti Shrivastav 2018 IEEE Cybersecurity Development (SecDev)
9. Using Entropy and Mutual Information to Extract Threat Actions from Cyber Threat IntelligenceGhaith Husari ; Xi Niu ; Bill Chu ; Ehab Al-Shaer 2018 IEEE International Conference on Intelligence and Security Informatics (ISI)
10.Extracting cyber threat intelligence from hacker forums: Support vector machines versus convolutional neural networksIsuf Deliu ; Carl Leichter ; Katrin Franke 2017 IEEE International Conference on Big Data (Big Data)
11.Assessing Quality of Contribution in Information Sharing for Threat Intelligence Aziz Mohaisen ; Omar Al-Ibrahim ; Charles Kamhoua ; Kevin Kwiat ; Laurent Njilla 2017 IEEE Symposium on Privacy-Aware Computing (PAC)
12.A New Threat Intelligence Scheme for Safeguarding Industry 4.0 SystemsNour Moustafa ; Erwin Adi ; Benjamin Turnbull ; Jiankun Hu;IEEE Access 2018
13.Graph Mining-based Trust Evaluation Mechanism with Multidimensional Features for Large-scale Heterogeneous Threat Intelligence;Yali Gao ; Xiaoyong Li ; Jirui Li ; Yunquan Gao ; Ning Guo;2018 IEEE International Conference on Big Data (Big Data) 14.Performance of ELK stack and commercial system in security log
analysis;Sung Jun Son ; Youngmi Kwon;2017 IEEE 13th Malaysia International Conference on Communications (MICC)
15.Geo-identification of web users through logs using ELK stack;Tarun Prakash ; Misha Kakkar ; Kritika Patel;2016 6th International Conference - Cloud System and Big Data Engineering (Confluence) 16.Onilne “ELK Stack: Elasticsearch, Logstash, Kibana” elastic 17.Managing Cyber Threat Intelligence in a Graph Database: Methods of
Analyzing Intrusion Sets, Threat Actors, and Campaigns;Seulgi Lee ; Hyeisun Cho ; Nakhyun Kim ; Byungik Kim ; Junhyung Park;2018 International Conference on Platform Technology and Service (PlatCon)
18.Identifying mobile malware and key threat actors in online hacker forums for proactive cyber threat intelligence;John Grisham ; Sagar Samtani ; Mark Patton ; Hsinchun Chen;2017 IEEE International Conference on Intelligence and Security Informatics (ISI)
19.Online “Winlogbeat: Analyze Windows Event Logs” elastic 20.Security OSIF: Toward Automatic Discovery and Analysis of Event