Abstract: Multiple sequence alignment (MSA) is an important issue in the field of bioinformatics. It is posed as an optimization problem by tuning the gaps to proper places that yields maximum alignment. Nature inspired evolutionary optimization algorithms are proven to be very powerful in wide range of optimization problems including multiple sequence alignment. In large data cases such as MSA, significantly more time is required for a reasonable search. Usage of multiple cores can lead to cover more search space in less time. This paper proposes two, Graphical Processor Unit (GPU) based parallel algorithms for MSA using recent algorithmic parameter free evolutionary algorithms Teaching Learning Based Optimization and JAYA (GPU-PTLBO & GPU-PJAYA) using mapreduce. The performance of the algorithms is evaluated by running on 16 different cores using well-known bench mark datasets. The results are compared with two other evolutionary algorithms parallel Genetic Algorithm and parallel Differential Evolutionary Algorithm. The results are profound in terms of accuracy and time. GPU-PTLBO has shown significant improvement over other algorithms. It was also observed that, GPU-PJAYA is efficient in case of short sequences.
Index Terms: Multiple Sequence Alignment, Graphical Processor Unit, Search space, GA, DE, TLBO, JAYA, Mapreduce, Parallel Computing Toolbox, Distributed Computing Server.
I. INTRODUCTION
The most prominent buzzword in the field of bioinformatics is Multiple Sequence Alignment [1]. MSA is aimed to align three or more sequences by inducing '-' gaps into the sequences randomly at different positions to bring similar kind of residues [A,C,G,T] for DNA Sequences and [A,R,N,D,C,Q,E,G,H,I,L,K,M,F,P,S,T,W,Y,V] for protein sequences to the same column to improve the fitness value [2]. Multiple Sequence Alignment is significant in attaining conserved motifs, phylogeny, protein families etc., [3]. Abundant techniques are grown-up for sequence alignment from the past several decades. Dynamic Programming (DP) is used for the purpose of pair wise sequence alignment where only two sequences are aligned [4]. Smith -Waterman [5] and
Revised Manuscript Received on May 10, 2019
Lakshmi Naga Jayaprada. Gavarraju, Assoc.Prof, Dept. of Computer Science & Engineering, Narasaraopeta Engineering College[Autonomous], Narasaraopet, Guntur(Dt), A.P., India.
Kanadam Karteeka Pavan, Professor & Head Department of Computer Applications , R.V.R.& J.C.College of Engineering [Autonomous], Chowdavaram , Guntur , A.P., India.
A. Deva Prema Swaroop, Assoc. Prof.& Head Department of Computer Science, T.J.P.S.College, Guntur, A.P., India,
Hemanth Chowdary Narne, Masters in Applied Computer Science, North West Missouri State University, Missouri, USA.
Needle-man and wunsch [6] algorithms are frequently used for the purpose of local and global sequence alignments respectively. But it is highly impossible to use these algorithms for multiple sequence alignment because it is computationally intensive problem [7]. Hence, to conquer the obstacle of computational complexity ample Meta heuristic algorithms were developed to perform MSA. Some algorithms, like CLUSTALW [8] incorporate progressive approach to do MSA. Some algorithms like MUSCLE [9] adapt iterative approach.
From the past few decades nature-inspired optimization algorithms are proven to be effective in solving optimization problems including MSA. Among the most important ones are Genetic Algorithms(GA)[10], Particle Swarm Optimization (PSO)[11], improved particle swarm
optimization[12], Differential Evolutionary
Algorithm(DE)[13] etc. Genetic Algorithms generate a sequence of populations by using selection mechanisms. Genetic Algorithms use crossover and mutation as search mechanisms. Differential Evolution uses mutation as a search mechanism and selection to direct the search toward the prospective regions in the feasible region. The principal difference between Genetic Algorithms and Differential Evolution is that Genetic Algorithms rely on crossover, a mechanism of probabilistic and useful exchange of information among solutions to locate better solutions, while evolutionary strategies use mutation as the primary search mechanism. All these techniques are applied on MSA and found that DE is the best one [14].
Almost all these optimization algorithms require some control parameters like pop size, no. of generations in advance. Also the algorithms are sensitive to their own algorithmic specific parameters like mutation probability, crossover probability, selection operator, crossover probability etc. Selection of appropriate values for these algorithmic specific parameters is very complex. Rao et al proposed two algorithmic specific parameter free algorithms TLBO [15] and JAYA [16]. TLBO is developed based on phenomenon of Teaching Learning process. JAYA algorithm is based on the concept that the solution obtained for a given problem should move towards the best solution and should avoid the worst solution.
JAYA algorithms are mostly applied on various Electrical, Electronic and Mechanical Engineering problems. In 2016, JAYA algorithm is used for power quality improvement [17]. A combination of gradient
search method and JAYA is
proposed for an
Gpu Based Parallel Tlbo and Parallel Jaya For
Multiple Sequence Alignment Using Mapreduce
(Gpu-Ptlbo & Gpu-Pjaya)
Lakshmi Naga Jayaprada.Gavarraju, K. Karteeka Pavan, A. Deva Prema Swaroop,
environmental economic problem [18]. R.V.Rao et.al, have proposed surface grinding process optimization [19]. Layout and Topology design optimization of truss structures is determined using JAYA algorithm in 2016 [20]. Recently a GPU based parallel JAYA algorithm for estimating parameters for Li-ion battery is proposed [21]. From the literature, many efficient works found using evolutionary algorithms for the problem of MSA [22]. However being the single core systems require much time and there is no single algorithm for MSA using TLBO and JAYA.
This paper proposes two new algorithms namely GPU-PTLBO and GPU-PJAYA. These two new algorithms are compared with Parallel DE and Parallel GA. It was observed that the above two proposed algorithms are showing very prominent improvement in performance (fitness) than the previous existing algorithms. The time required to execute the proposed algorithms are tested by executing parallel and in serial manner also and observed that there is significant time reduction while executing in parallel manner. It was also observed that GPU-PTLBO is showing better performance than GPU based GPU-PJAYA especially for long length sequences. If the data set is containing more number of sequences also GPU-PTLBO is showing better performance than GPU-PJAYA. But if the data set is consisting of less number of sequences and very short length sequences, then GPU-PJAYA is showing better performance than GPU-PTLBO. To perform testing on GPU-PTLBO and GPU-PJAYA the bench mark data sets from "ox" bench are taken into consideration. This paper is consisting of 7 sections. Section 1 is introduction. Section 2 is containing Contributions. Section 3 is containing multiple sequence alignment problem description and fitness functions. Section 4 is explaining the methodology of GPU based Parallel TLBO and GPU based Parallel JAYA. Section 5 is related to experimental results and discussions. Section 6 is Drawbacks and Section 7 is about conclusions and Future Enhancements.
II. CONTRIBUTIONS
1.A new GPU based model as framework for MSA problem on multicores using MATLAB is proposed.
2.Two new evolutionary algorithms using the proposed GPU based model as variants to TLBO and JAYA are defined. 3.As the performance of the evolutionary algorithms is based on the reasonable search space, the proposed model achieves a reasonable search space in reduced computational time for MSA problem.
4.On an average 89% of improvement in terms of time in milliseconds is observed for various bench mark data sets and it is shown in table 1.
III. MULTIPLESEQUENCEALINGMENT
PROBLEMDESCRIPTION
MSA is aimed to align multiple sequences by inducing the gaps at some random positions and making the residues in the columns identical or at least similar. The test sequences may be of DNA sequences [A,C,G,T] or Protein Sequences
[A,R,N,D,C,Q,E,G,H,I,L,K,M,F,P,S,T,W,Y,V]. In order to find optimum alignment among the multiple sequences in reduced time GPU-PTLBO and GPU-PJAYA are proposed. Quality of MSA can be validated with various measures, some of them are Identity Score (IS), Similarity score (SS) [23], Match score (MS) [24], Sum-of-Pairs (SoPs) score [24] and Column Score (CS) [25]. The fitness of the candidate solutions in this work is evaluated using four Objective functions as explained below.
A. OBJECTIVE FUNCTIONS
Various functions considered as fitness functions in different independent experiments are as follows. Assume that there are M sequences in alignment each of which contains N columns.
The Identity Score (IS) is calculated as shown below:
where
where `-' represents a gap; match is assigned a score value of „+2‟ , gap is assigned a score value of „-2‟ and mismatch is assigned the score value of „-1‟.
The Similarity Score (SS) is calculated as shown below:
where
where similarity score is calculated based on PAM score matrix. In this paper PAM (250) is used and match is from PAM (250) and gap=0.
The Sum-of-Pairs Score (SoP) is calculated as shown below:
where M is the number of columns in the test alignment and Mp is the number columns present in the reference alignment. The score Sy for the yth column is found as per the following equation
Where Pijk=1 if residues Aij and Aik are aligned in the test sequence otherwise Pijk=0
Sx is Sy where for the pth column in the reference alignment. The Column Score (CS) [Thomson 1999] is calculated as shown below.
If all the residues in the xth column in the test alignment are aligned then Cx=1 otherwise Cx=0.
IV. GPU-PTLBO & GPU-PJAYA
Motivation for the proposed algorithms is explained in the following sub-section.
A. MOTIVATION FOR GPU BASED ALGORITHMS
USING MAPREDUCE
Various experiments are conducted on well-known benchmark datasets using with and without mapreduce methods. The results are depicted in the following Table 1.
From the above Table 1, it is clear that the time required to run the Parallel TLBO with mapreduce is very less when compared with time required to run the Serial TLBO. The test is performed on GTX Workstation with a 2GB Graphics card (GPU) and 48 GB RAM. For this experiment 16 cores are used. Initial population is taken as 100. So, each and every core is assigned 100 chromosomes as initial population. In total 16X100=1600 is the size of population for the parallel mapreduce algorithm. So the search space is very high. The PTLBO without mapreduce contains single population of 1600 chromosomes. In both of the algorithms number of generations is taken is 25. On each and every core generations are 25. The performance of the algorithms is equally good; however TLBO without mapreduce takes much time compared to mapreduce algorithm. The details are furnished in table 1.
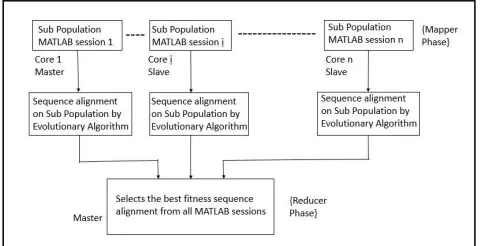
This paper discusses the multiple sequence alignment with GPU-PTLBO and GPU-PJAYA with mapreduce. MSA is such a problem in which problem space increases with the increase in number and size of the sequences. Most of the existing works are efficient but require much time due to the usage of single core. Searching the large search space takes large amount of time with only one core. So, this paper proposes two, Graphical Processor Unit (GPU) based parallel algorithms for MSA using recent algorithmic parameter free evolutionary algorithms Teaching Learning Based Optimization and JAYA (GPU-PTLBO & GPU-PJAYA) using mapreduce. This is achieved with the help of Matlab Parallel Computing Toolbox (PCT) and Distributed Computing Server (DCS). To speed up calculations and to solve very large MSA problems in less time DCS and PCT are useful. Mapreduce in Matlab is achieved with PCT and DCS. Mapreduce is a concept where the entire dataset is spread over multiple cores using mapper and the required processing is done on the dataset in the parallel manner using multiple matlab sessions and finally the reducer is responsible to sum up the results of various matlab sessions for the final result. Each and every matlab session is run on a core in the multicore system. In this proposed work 16 matlab sessions are created using all the cores present in the Central Processing Unit (CPU) and some cores of General Purpose Graphical Processing Unit (GPGPU). This work is implemented on GTX Workstation with a 2GB Graphics
card (GPU) and 48 GB RAM. For this experiment 16 cores are used because it was observed that the performance is very good for this configuration. Frame work of proposed algorithms is depicted in the following figure 1.
B. METHODOLOGY OF GPU-PTLBO
GPU-PTLBO with mapreduce is a parallel evolutionary algorithm based on TLBO which is run on multiple cores. So, the following steps are repeated for every core.
1. Generate the initial population based upon the population size [mapper]. Each part of the population is called as chromosome.
2. Alignment of the given sequences has to be done based upon the gap positions present in the population.
3. Calculate the fitness of the population based on one of the above mentioned fitness functions.
4. For g=1 to no-of-generations repeat the following steps from 5 to 9.
5. Now the Teacher Phase of TLBO starts. The chromosome having the best fitness value is considered as teacher and is designated as “Xteacher”. 6. Mean of the population has to found and it is
designated as “Xmean”.
7. For i=1 to pop-size Xnew has to be calculated with the
following equation.
Xnew=Xi+r(Xteacher-TF.Xmean)). Then find the fitness of Xnew. If Xnew is better than Xi then XiXnew. This is the end of the Teacher Phase. 8. Learner Phase
9. for i=1 to pop-size, j has to calculated as j=random (pop-size) and j≠i
10. If Xi better than Xj then Xi,new=Xi+r (Xj-Xi) else Xi,new=Xi+r(Xi-Xj).
11. If Xi,new better than Xi then XiXi,new. This is the end of Student Phase.
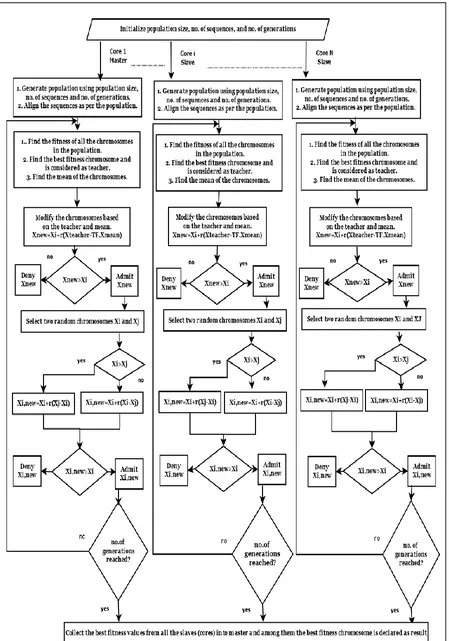
[image:3.595.307.547.116.239.2]12. If no-of-generations reached, the best fitness values from all the cores are collected and among them the best fitness oneis declared as result [reducer]. The process of GPU-PTLBO is pictorially represented in Flow chart as follows.
C. APPLICATION OF GPU-PTLBO ON SELECTED TEST SEQUENCES
[image:4.595.62.511.56.697.2]cases and the intermediate results are shown as follows.
Test Sequences:
The following is the initial population of the sequences using the population size as 4 is as shown in fig 3 below
.
As the candidate solution or chromosome provides positions of the gaps, the alignment with gaps at those positions is as shown in fig 4.
Another parallel evolutionary algorithm based on JAYA is also proposed and is as follows. JAYA is a recent evolutionary optimization algorithm which doesn‟t require any algorithmic specific parameters.
D. METHODOLOGY OF GPU-PJAYA
The steps of GPU-PJAYA are as follows. 1. Initialize population.
2. Calculate the fitness of the population.
3. For generations g=1 to no_of_ generations repeat the following steps
4. Discover the best and worst chromosomes.
5. Revise the chromosomes depending on best and worst chromosomes as follows.
Xnew=Xi+r1(Xbest-|Xi|)-r2(Xworst-|Xi|)
if fitness of Xnew > Xi
Add Xnew to the population in place of Xi otherwise keep Xi as it is.
6. If no_of_generations reached, the best fitness values from all the cores are collected and among them the best fitness one is declared as result.
V. EXPERIMENTALRESULTS
Experiments are conducted on well-known benchmark datasets from “ox”. GPU-PTLBO (PTLBO) and GPU-PJAYA (PJAYA) are compared with Parallel DE (PDE) and Parallel GA (PGA).
A. TERMINATION CRITERIA
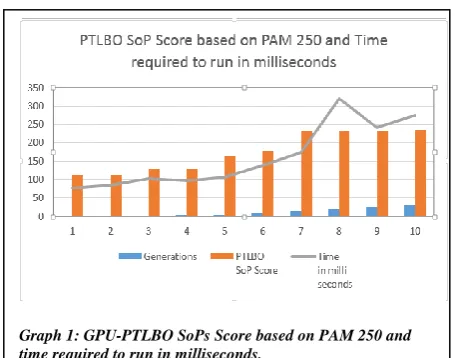
The algorithm is run several times with varied no. of generations and observed at what successive generations the best fitness is stable. For example from table 2 and graph 1, after 15 generations the observed best fitness value is 234.
On the similar way we conducted tests on several datasets
and observed that with total initial population 1600 nearly at 25 generations we are getting the optimal performance for some of the data sets. When the length of the sequences and no. of sequences are changed this may vary. It is demonstrated with table 3, graph 2, graph 3, graph 4 and graph 5.
ALKRARNTEAARRS
KRRIRRERNKMAAAKSRNRRR RKRMRNRIAASKSR
fig 3: Population
Fig4:Alignment
Parallel TLBO SoPs Score based on PAM 250 and time in ms
S.No Generations
PTLBO SoP Score
Time in milli seconds
1 1 113 78.09
2 2 113 84.26
3 3 128 103.22
4 4 128 97.98
5 5 165 106.84
6 10 178 138.91
7 15 234 173.51
8 20 234 320.15
9 25 234 241.58
[image:5.595.313.541.459.638.2]10 30 235 275.75
Table 2: GPU-PTLBO SoPs Score based on PAM 250 and time required to run in milliseconds.
\
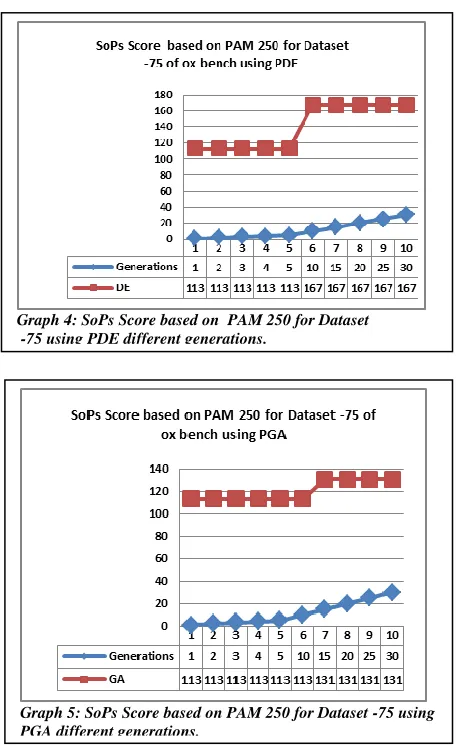
From the above table 3 and graphs it is clear that PTLBO performs well in finding SS based on PAM 250. The Data Set -75 of ox bench is consisting of sequences having the length of 81, 55, 55, 58, and 64. When more no. of sequences are present in the data set PTLBO performance is observed as better than other techniques.
S.No
Genera
tions PTLBO PJAYA PDE PGA
1 1 113 113 113 113
2 2 113 138 113 113
3 3 128 151 113 113
4 4 128 151 113 113
5 5 165 151 113 113
6 10 178 178 167 113
7 15 234 178 167 131
8 20 234 197 167 131
9 25 234 197 167 131
[image:6.595.313.541.44.417.2]10 30 235 197 167 131
Table 3: Comparison of SoPs Score based on PAM 250 for Data Set -75 of ox bench
Graph 2: SoPs Score based on PAM 250 for Dataset -75 using PTLBO at different generations.
Graph 3: SoPs Score based on PAM 250 for Dataset -75 using PJAYA at different generations.
Graph 4: SoPs Score based on PAM 250 for Dataset -75 using PDE different generations.
S.No
Genera-tion s
PTLB
O PJAYA PDE PGA
1 1 -327 -327 -301 -327
2 2 -233 -327 -194 -326
3 3 -233 -270 -194 -291
4 4 -124 -238 -194 -287
5 5 -124 -216 -194 -287
6 10 -124 -212 -100 -287
7 15 11 -120 -100 -287
8 20 11 -112 -100 -221
9 25 11 -90 -100 -221
[image:6.595.316.551.499.664.2]10 30 11 -90 -100 -221
Table 4: Comparison of SoPs score based on PAM 250 for Data Set -93 of ox bench
From the above table 4 it is clear that PTLBO performs well in finding Similarity Score based on PAM 250. The Data Set -93 of ox bench is having 10 sequences.From this also it was proved that when more no. of sequences are present in the data set PTLBO performance is observed as better than other techniques.
From the above table 5 it is understood that PJAYA performs well in finding Similarity Score based on PAM 250. The Data Set -46 of ox bench is consisting of 3 sequences. From this experiment it was proved that when less no. of sequences are present in the data set PJAYA performance is observed as better than other techniques.
B. EXPERIMENTAL RESULTS OF GPU-PTLBO AND
GPU-PJAYA
Experiments are conducted with different objective functions. The results are provided as follows.
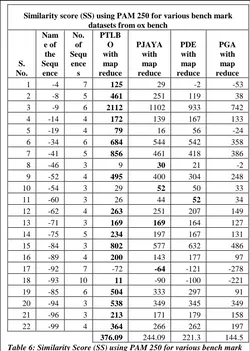
i) VALIDATION USING SIMILARITY SCORE
Candidate solution is a chromosome with maximum fitness value. The following Table 6 and Graph 6 show the performance of PTLBO, PJAYA, PDE and PGA based on Similarity Score (SS). SS is calculated for 22 bench mark datasets of ox bench and is tabulated in Table 6. For one example test data set (-4) PTLBO‟s score is 125, PJAYA‟s score is 29, PDE‟s score is -2 and PGA‟s score is -53. It shows that PTLBO‟s performance is better than all other techniques
.
ii) VALIDATION USING IDENTITY SCORE The following Table 7 and Graph 7 shows the performance of PTLBO, PJAYA, PDE and PGA based on Identity Score (IS). Identity Score is calculated for 22 bench mark datasets of ox bench and are tabulated in table 7. For one example test data set (-8) PTLBO‟s score is -648, PJAYA‟s score is -1982, PDE‟s score is -2106 and PGA‟s score is -2261. It is observed that PTLBO is showing better performance than all the other techniques.
S.N o
Genera - tions
PTLB
O PJAYA PD
E PGA
1 1 -21 -9 -20 -22
2 2 -21 -9 4 -22
3 3 -10 -9 4 -4
4 4 -10 -9 4 -4
5 5 -10 4 4 -2
6 10 9 4 7 -2
7 15 9 8 7 -2
8 20 9 8 7 -2
9 25 9 30 21 -2
[image:7.595.309.559.62.413.2]10 30 9 30 21 -2
Table 5 : Comparison of SoPs score based on PAM 250 for Data Set -46 of ox bench
Similarity score (SS) using PAM 250 for various bench mark datasets from ox bench
S. No.
Nam e of the Sequ ence
No. of Sequ ence s
PTLB O with map reduce
PJAYA with map reduce
PDE with map reduce
PGA with map reduce
1 -4 7 125 29 -2 -53
2 -8 5 461 251 119 38
3 -9 6 2112 1102 933 742
4 -14 4 172 139 167 133
5 -19 4 79 16 56 -24
6 -34 6 684 544 542 358
7 -41 5 856 461 418 386
8 -46 3 9 30 21 -2
9 -52 4 495 400 304 248
10 -54 3 29 52 50 33
11 -60 3 26 44 52 34
12 -62 4 263 251 207 149
13 -71 3 169 169 164 127
14 -75 5 234 197 167 131
15 -84 3 802 577 632 486
16 -89 4 200 143 177 97
17 -92 7 -72 -64 -121 -278
18 -93 10 11 -90 -100 -221
19 -85 6 504 333 297 91
20 -94 3 538 349 345 349
21 -96 3 213 171 179 158
22 -99 4 364 266 262 197
[image:7.595.60.278.130.308.2] [image:7.595.305.550.521.693.2]376.09 244.09 221.3 144.5 Table 6: Similarity Score (SS) using PAM 250 for various bench mark
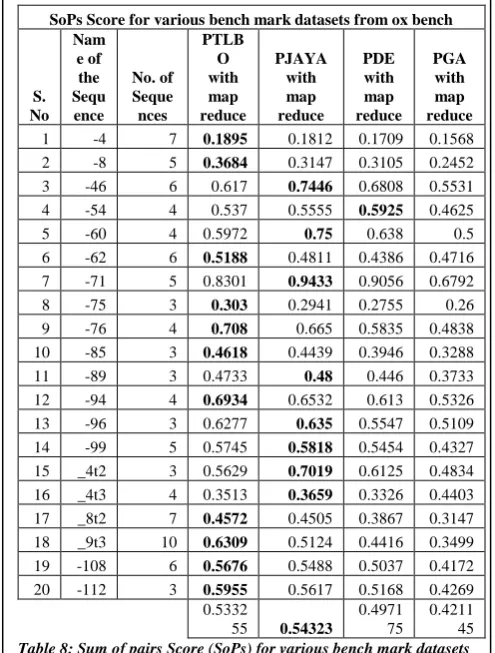
[image:7.595.47.290.597.786.2]iii) VALIDATION USING SUM OF PAIRS SCORE The following Table 8 and Graph 8 shows the performance of PTLBO, PJAYA, PDE and PGA based on Sum of pairs Score (SoPs). Sum of pairs score is calculated for 20 bench mark datasets of ox bench. For one example dataset (-46) PTLBO‟s score is 0.617, PJAYA‟s score is 0.7446, PDE‟s score is 0.6808 and PGA‟s score is 0.5531. For this Sum of Pairs fitness function PJAYA‟s performance is slightly better than other techniques.
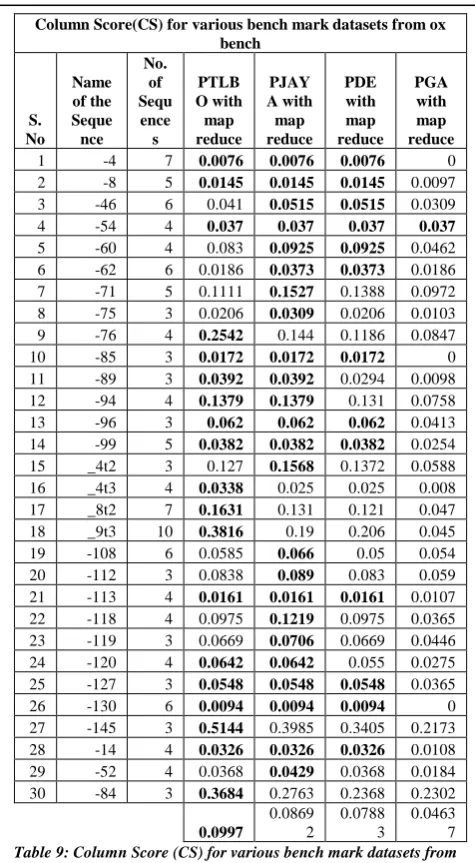
iv) VALIDATION USING COLUMN SCORE: The following Table 9 and Graph 9 shows the performance of PTLBO, PJAYA, PDE and PGA based on Column Score (SC). Column Score is calculated for 30 bench mark datasets of ox bench. For one example data set (-99) PTLBO‟s score is 0.0382, PJAYA‟s score is 0.0382, PDE‟s score is 0.0382 and PGA‟s score is 0.0254. In this study, all algorithms are performed equally well in terms of column score measure. But in average PTLBO exhibits its superiority in terms of best score over remaining all algorithms.
Identity Score for various bench mark datasets from ox bench(match= +2, mismatch= -1, gap= -2)
S. No Nam e of the Sequ ence No. of Sequ ences PTLB O with map reduce PJAY A with map reduce PDE with map reduce PGA with map reduce 1 -4 7 -3338 -3452 -3488 -3578
2 -8 5 -648 -1982 -2106 -2261
3 -9 6 -636 -920 -1199 -1464
4 -14 4 -648 -630 -649 -664
5 -19 4 -811 -833 -882 -898
6 -34 6 -1322 -1397 -1438 -1642 7 -41 5 -1725 -1930 -1934 -2089
8 -46 3 -326 -319 -321 -336
9 -52 4 -649 -741 -773 -846
10 -54 3 -388 -408 -410 -419
11 -60 3 -313 -290 -308 -327
12 -62 4 -614 -625 -664 -663
13 -71 3 -162 -142 -155 -189
14 -75 5 -1237 -1219 -1257 -1286
15 -84 3 47 52 -60 -118
16 -89 4 -679 -699 -706 -737
17 -92 7 -3282 -3303 -3333 -3600 18 -93 10 -6338 -6522 -6607 -6707 19 -85 6 -1392 -1435 -1495 -1646
20 -94 3 -164 -190 -228 -261
21 -96 3 -318 -351 -357 -403
22 -99 4 -809 -828 -857 -954
[image:8.595.306.554.52.379.2] [image:8.595.50.292.61.450.2] [image:8.595.304.550.532.696.2]-1170. 5 -1280. 2 -1328. 5 -1413. 1 Table 7: Identiy Score for various bench mark datasets from ox bench (match= +2, mismatch= -1, gap= -2)
Graph 8: Average SoPs Score for various bench mark datasets from ox bench
SoPs Score for various bench mark datasets from ox bench
S. No Nam e of the Sequ ence No. of Seque nces PTLB O with map reduce PJAYA with map reduce PDE with map reduce PGA with map reduce 1 -4 7 0.1895 0.1812 0.1709 0.1568 2 -8 5 0.3684 0.3147 0.3105 0.2452
3 -46 6 0.617 0.7446 0.6808 0.5531
4 -54 4 0.537 0.5555 0.5925 0.4625
5 -60 4 0.5972 0.75 0.638 0.5
6 -62 6 0.5188 0.4811 0.4386 0.4716
7 -71 5 0.8301 0.9433 0.9056 0.6792
8 -75 3 0.303 0.2941 0.2755 0.26 9 -76 4 0.708 0.665 0.5835 0.4838 10 -85 3 0.4618 0.4439 0.3946 0.3288
11 -89 3 0.4733 0.48 0.446 0.3733
12 -94 4 0.6934 0.6532 0.613 0.5326
13 -96 3 0.6277 0.635 0.5547 0.5109
14 -99 5 0.5745 0.5818 0.5454 0.4327
15 _4t2 3 0.5629 0.7019 0.6125 0.4834
16 _4t3 4 0.3513 0.3659 0.3326 0.4403
17 _8t2 7 0.4572 0.4505 0.3867 0.3147
18 _9t3 10 0.6309 0.5124 0.4416 0.3499
19 -108 6 0.5676 0.5488 0.5037 0.4172
20 -112 3 0.5955 0.5617 0.5168 0.4269
0.5332
55 0.54323 0.4971
75 0.4211
[image:8.595.45.291.579.729.2]45 Table 8: Sum of pairs Score (SoPs) for various bench mark datasets from ox bench
C. DISCUSSIONS
Two parallel evolutionary algorithms using two recent algorithmic specific parameter free algorithms PTLBO, PJAYA are proposed. Common control parameters like number of generations is selected by running the algorithm multiple times, based on the point from which generation the fittest value doesn‟t change. The proposed PTLBO not only provided results with good accuracy but also yields in a reduction in computational time. In a nutshell, Similarity Score is calculated for 22 bench mark datasets of ox bench and it was observed that out of 22 test data sets, for 17 test data sets PTLBO performed best whereas PJAYA is best in 3 data sets and PDE is in only one test case. For one data set PTLBO & PJAYA performed equally well. Average Similarity Score of PTLBO is significantly very good when compared with other techniques.
Coming to Identity Score, PTLBO provided fittest solutions in 16 different cases, for 6 cases the PJAYA. Average Identity Score (IS) of PTLBO is significantly very good when compared with other techniques. The performance of the algorithms is studied on 20 bench mark datasets in terms of sum of pairs score. PTLBO is best in 11 cases in terms of sum of pairs. For 8 data sets PJAYA showed better performance. For one data set PDE showed better
performance. Average Sum of Pairs Score of PJAYA is good when compared with other techniques. Column Score is calculated for 30 bench mark datasets of ox bench and it was observed that out of 30 test data sets, for 13 test data sets PTLBO & PJAYA performance is equal. For 11 data sets PJAYA has shown better performance than PTLBO. For 6 data sets PTLBO performed well than PJAYA. For 13 datasets PDE is on par with PJAYA. For one data set only PGA has shown the same performance as PJAYA. Average Column Score of PTLBO is significantly very good when compared with other techniques.
By observing the all fitness functions performance, it was observed that PTLBO is showing better performance than PJAYA especially for long length sequences. If the data set is containing more number of sequences also PTLBO is showing better performance than -PJAYA. But if the data set is consisting of less number of sequences and very short length sequences, then PJAYA is showing better performance than PTLBO.
VI. DRAWBACKS
The main drawback observed is, Parallel TLBO (GPU-PTLBO) and Parallel JAYA (GPU-PJAYA) are consuming more time than Parallel DE and Parallel GA. Even though they are consuming more time, they are showing remarkable improvement in the performance and particularly for Parallel TLBO there is no chance to fall under local optima. The search space is significantly high compared to other algorithms.
VII. CONCLUSIONS&FUTUREENHANCEMENTS MSA is aimed to align more than two sequences by inducing gaps at feasible positions for maximum match score. Being the problem of optimization several solutions are found using evolutionary algorithms. The success of these algorithms require more computation time for a reasonable search space and time will be increased with increased number and length of sequences.
As a solution the paper propose two new parallel evolutionary algorithms using two new parallel evolutionary algorithms using PTLBO and PJAYA. Common control parameter values are tuned by conducting a pre-processing step. Experiments are conducted on OX bench mark data set. The results are evaluated using four different alignment measures. Significant accuracy in reduced time is observed.
The method can be combined with other traditional/evolutionary algorithms. In the study the proposed parallel algorithms GPU-PTLBO & GPU-PJAYA using mapreduce are proved that they can explore a high search space in less time by running on multiple cores. Further the parallel concept can be extended to align the sequences by dividing them into multiple sub sequences on multiple cores. Also the research can be directed towards combining memetic, fuzzy concepts for an improved accuracy and the algorithms can be enhanced with the concepts like clustering and cloud.
REFERENCES
1. J. Xiong, Essential
Bioinformatics, Cambridge
University Press, NY, 2006. Column Score(CS) for various bench mark datasets from ox
bench S. No Name of the Seque nce No. of Sequ ence s PTLB O with map reduce PJAY A with map reduce PDE with map reduce PGA with map reduce
1 -4 7 0.0076 0.0076 0.0076 0
2 -8 5 0.0145 0.0145 0.0145 0.0097
3 -46 6 0.041 0.0515 0.0515 0.0309
4 -54 4 0.037 0.037 0.037 0.037
5 -60 4 0.083 0.0925 0.0925 0.0462
6 -62 6 0.0186 0.0373 0.0373 0.0186
7 -71 5 0.1111 0.1527 0.1388 0.0972
8 -75 3 0.0206 0.0309 0.0206 0.0103
9 -76 4 0.2542 0.144 0.1186 0.0847 10 -85 3 0.0172 0.0172 0.0172 0 11 -89 3 0.0392 0.0392 0.0294 0.0098 12 -94 4 0.1379 0.1379 0.131 0.0758 13 -96 3 0.062 0.062 0.062 0.0413 14 -99 5 0.0382 0.0382 0.0382 0.0254
15 _4t2 3 0.127 0.1568 0.1372 0.0588
16 _4t3 4 0.0338 0.025 0.025 0.008
17 _8t2 7 0.1631 0.131 0.121 0.047
18 _9t3 10 0.3816 0.19 0.206 0.045
19 -108 6 0.0585 0.066 0.05 0.054
20 -112 3 0.0838 0.089 0.083 0.059
21 -113 4 0.0161 0.0161 0.0161 0.0107
22 -118 4 0.0975 0.1219 0.0975 0.0365
23 -119 3 0.0669 0.0706 0.0669 0.0446
24 -120 4 0.0642 0.0642 0.055 0.0275
25 -127 3 0.0548 0.0548 0.0548 0.0365
26 -130 6 0.0094 0.0094 0.0094 0
27 -145 3 0.5144 0.3985 0.3405 0.2173
28 -14 4 0.0326 0.0326 0.0326 0.0108
29 -52 4 0.0368 0.0429 0.0368 0.0184
30 -84 3 0.3684 0.2763 0.2368 0.2302
[image:9.595.57.295.50.482.2]2. D.W. Mount, Bioinformatics: Sequence and Genome Analysis, Cold
3. Spring Harbor 4 Laboratory Press, Cold Spring Harbor, NY, 2004.
4. C. Notredame, Recent progresses in multiple sequence alignment: a
5. survey, Pharmacogenomics 3 (1) (2002) 131–144. R. Durbin, S. Eddy,
A. Krogh, G. Mitchison, Biological Sequence
6. Analysis: Probabilistic Models of Proteins and Nucleic Acids,
7. Cambridge University Press, Cambridge, UK, 1998. T.F. Smith, M.S.
Waterman, Identification of common molecular sub sequences, J. Mol. Biol. 147 (1981) 195–197.
8. S.B. Needleman, C.D. Wunsch, A general method applicable to the
9. search for similarities in the amino acid sequence of two proteins, J.
Mol. Biol. 48(1970) 443–453.
10.L. Wang, T. Jiang, On the complexity of multiple sequence alignment,
J. Comput. Biol. 1 (1994) 337–348.
11.J.D. Thompson, D.G. Higgins, T.J. Gibson, CLUSTAL W:
12.improving the sensitivity of progressive multiple sequence alignment
13.through sequence weighting, position-specific gap penalties and
weight matrix choice, Nucl. Acids Res. 22 (1994) 4673–4680.
14.R.C. Edgar, MUSCLE: multiple sequence alignment with high
15.accuracy and high throughput, Nucl. Acids Res. 32 (2004) 1792–1797.
16.C. Gondro and B.P. Kinghorn, The Institute for Genetics and
Bioinformatics (TIGB), University of New England, Armidale,
17.Australia: A simple genetic algorithm for multiple sequence
18.alignment, GMR - Gentics and Molecular Research, 2007. Fasheng
Xu, Yuehui Chen: A Method for Multiple Sequence
19.Alignment Based on Particle Swarm Optimization, pp. 965–973,
20.2009. Springer LNCS. P.V.S.L. Jagadamba, M. Surendra Prasad
Babu, Allam Appa Rao,
21.P. Krishna Subba Rao: An improved algorithm for Multiple
22.Sequence Alignment using Particle Swarm Optimization, 2011. Saku
Kukkonen, Sujit R. Jangam, Nirupam Chakraborti: Solving
23.the Molecular Sequence Alignment Problem with Generalized
Differential Evolution 3 (GDE3): IEEE Xplore: June2007. L.N.J. Gavarraju et al., Sequence Alignment by Advanced Differential Evolutionary Algorithm, Intelligence Techniques in Health Care, Springer LNCS, 2016.
24.R.V. Rao, Teaching Learning Based Optimization Algorithm ©
Springer International Publishing Switzerland 2016.
25.R. Venkata Rao: Jaya: A simple and new optimization algorithm for
26.solving constrained and unconstrained optimization problems,
International Journal of Industrial Engineering Computations 7 (2016). S. Mishra and P. K. Ray, “Power Quality Improvement Using
27.Photovoltaic Fed DSTATCOM Based on JAYA Optimization,”
28.IEEE Trans. Sustain. Energy, vol. 7, no. 4, pp. 1672–1680, Oct. 2016.
41R. Azizipanah-Abarghooee, P. Dehghanian, and V. Terzija,
29.“Practical multi-area bi-objective environmental economic dispatch
30.equipped with a hybrid gradient search method and improved Jaya
31.algorithm,” Transm. Distrib. IET Gener., vol. 10, no. 14, pp.
3580–3596, 2016.
32.R. V. Rao, D. P. Rai, and J. Balic, “Surface Grinding Process
33.Optimization Using Jaya Algorithm,” SpringerLink, Springer India,
34.pp. 487–495. S. O. Degertekin, L. Lamberti, and I. B. Ugur, “Sizing,
layout and
35.topology design optimization of truss structures using the Jaya
36.algorithm,” Appl. Soft Comput., in press, 2017.Long Wang, Zijun
Zhang, Chao Huang, Kwok Leung Tsui “A
37.GPU-accelerated Parallel Jaya for Efficiently Estimating Li-ion
38.Battery Model Parameters” Applied Soft Computing Journal
39.65, 12-20 M.O. Dayhoff, R.M. Schwartz, B.C. Orcutt, A model of
evolutionary
40.change in proteins, in: M.O. Dayhoff (Ed.), Atlas of Protein Sequence
41.and Structure, vol. 5, National Biomedical Research Foundation,
42.Washington, DC, 1978, pp. 345–352. Setubal, J. C.Meidanis, J.:
Introduction to Computational Biology.
43.Brooks/Cole, Paci_c Grove, California, 1997. Chellapilla, K.Fogel, G.
B.: Multiple Sequence Alignment Using
44.Evolutionary Programming. Proceedings of the 1999 Congress on
Evolutionary Computation, Washington DC, Vol. 1, 58 1999, pp.
45.445-452.Thompson, J. D.Plewniak, F.Poch, O.: A Comprehensive
46.Comparison of Multiple Sequence Alignment Programs. Nucleic