International Journal of Innovative Technology and Exploring Engineering (IJITEE) ISSN: 2278-3075, Volume-8 Issue-8S2, June 2019
Abstract:Background/Objectives:The role of smartphones is changing from a communication system for exchanging calls and information into a universal platform for cultural services. Also, satisfaction for mobile application services on smartphones is a very important factor in the smart business. Mobile app-store has revolutionized the existing mobile content industry. Methods/Statistical analysis:There has been little empirical work onthe impact of getting the apps for free vs.customers having to pay. Drawing on MOBISQUAL (Mobile Internet Service Quality), this study develops and tests a model of the users' satisfaction in mobile applications settings. The model posits that certain antecedents such as outcome, fluid interaction, service scape and costs affect the satisfaction.Survey data collected from 206 mobile users were used to test our research model using a variety of Moderated regression techniques. Findings:The empirical findings indicate that outcome, fluid interaction, service scape, costs significantly affect user satisfaction. Furthermore, my empirical result from various moderation tests shows that user mediates the relationships between mobile app-quality drivers and user satisfaction.
This paper can provide mobile apps service supplying firms a plan to produce paid apps, or change existing free apps into paid ones with alternatives for profit creation through statistical comparative analysis between paid and free apps. Improvements/Applications:The perceived result quality, service scape quality and the perceived costs of mobile app services by customers will have a positive influence on customer satisfaction. The perceived costs of mobile app services by customers will have more significant impacts in free mobile apps over paid ones.
Keywords: Mobile Internet service quality (MOBISQUAL), outcome quality, fluid interaction quality, contextual interaction quality, service scape quality
I.INTRODUCTION
The recent development in smartphone technology has created an environment where consumers purchase a variety of digital contents (music, movies, ringtones, e-books, etc.). Smartphone users, with high-speed communications networks and diverse contents, are using smartphones not only as a means for basic communication, but other purposes such as information searching, leisure, gaming, etc. by using applications.
Uber receives commission fees from connecting drivers and passengers through the form of carpooling or sharing cars. If a car is reserved through the app, the location of the
vehicle is provided to the passenger on a real-time basis. Although Uber initially provided high-quality, luxury-sized Sedans, the release of Uber X in 2012 included more affordable models, expanding the variety of choice.
Uber is expanding mobile apps into a platform for gaining profit within a shared economy. Mobile devices are changing from communication and information exchanging equipment into universal cultural platforms for Mobile Office, games, portal site searching, etc. As a result, smartphones are now key items that are necessary in modern everyday life, while functioning as a cultural service platform through the unique function of in-mobile application services. In other words, the satisfaction for mobile application services is a crucial factor in smart business. The mobile application industry is an information service (I-S) which can support information products (I-P), especially smartphones. This industry can provide opportunities for competitive superiority over rising industrial nations by going beyond the boundaries of simple product supply to combining support, knowledge and services.
The Mobile Internet Service Quality (MOBISQUAL) is a qualitative model created by studying the unique characteristics of online and Internet service quality. This study plans to examine the credibility and validity of the MOBISQUAL measurement model through checking the recent appearance of mobile platforms and the quality of mobile app services. The current categorization of app services in the mobile platforms is by whether they are paid or free of charge, so service quality measurement and comparative analysis will be made for these two categories. Through this, implications on which levels of the MOBISQUAL measurement model need to be focused for future strategies will be provided for paid mobile app services, a newly rising model for creating profit.
Service quality, unlike traditional physical products, is hard to define. The standards for service quality are defined differently by firms and consumers; service firms tend to define the standards as average operating procedures, while consumers provide personal standards based on individual service experience1. Likewise, firms and consumers have differing opinions on service standards, which can end in expected service process results from the firm, but with lower levels of satisfaction from consumers. In such service results of failure to satisfy the needs of consumers, it is difficult to the customers for repurchase,
thus gaining negative impacts
A Comparative study on the User Satisfaction of
Chinese mobile Apps - Moderating the Services
between paid and free Apps -
on the firm’s reputation. Expectations of consumers can be measured through various tools such as: customer satisfaction, customer recognition, focus groups, customer complaint analysis, staff surveys, similar industry research, tradeoff analysis, etc.
Mobile Internet service quality (MOBISQUAL) consists of outcome quality, fluid interaction quality, contextual interaction quality, and service scape quality2. First, outcome quality refers to what was left to the customer when the service production process was terminated. Second, fluid interaction quality means that mobile internet service delivery process is different from the existing offline service, interaction can occur without time and space constraints. Third, the contextual interaction quality is a characteristic of the mobile Internet service environment. Therefore, the characteristics of the mobile interaction that should be additionally considered include the personalized information on the consumers in consideration of the circumstances such as the time, or service to the user. Fourth, service scape quality refers to the physical environment quality as the quality level for the service environment.
Research for customer satisfaction began in the US during the 1970s. There have been two major definitions for customer satisfaction given in the 1970s and 80s: perceiving customer satisfaction as means or as results.
Preceding research for studying customer satisfaction as a result of consuming experience includes Howard and Sheth (1969), Oliver (1981), Churchill and Surprenant (1982), etc.. Customer satisfaction is ‘the buyer’s cognitive state of being adequately or inadequately rewarded for the sacrifice he has undergone’3. It defines customer satisfaction as ‘a summary of psychological state resulting when the emotion surrounding disconfirmed expectations is coupled with the consumer's prior feelings about the consumption experience’4. It indicates customer satisfaction as ‘a function of the discrepancy between a consumer’s prior expectations and his or her perception regarding the purchase’5.
As for preceding research on the relationship of service quality and customer satisfaction, there are Parasuraman et al. (1985), Anderson and Sullivan (1993), etc. Service quality is a leading variable influencing customer satisfaction6, 7. As for the domestic studies, Hak-Sik and Young (1999) provided results indicating that service quality is a preceding element for customer satisfaction8, while Jong-Chul et al (2011) divided the reactions derived from service quality into cognitive and emotional levels9.
This study consists of two populations; a group of individuals that have used paid mobile App services, and those that only have experience using free mobile App services. The levels of customer satisfaction through service quality will be compared between these two populations.
Paid mobile App services can be divided into largely three types.
The first type is where payments are made during the purchase of mobile App services on the App Store. This type is divided into two sub categories: where one single purchase ensures permanent use, and where regular subscription is required10.
The second type is when the purchase of the mobile App service on the App Store is free, but the items inside the App and special services require in-App purchases for full use. This type is defined as partial charging of contents, established in existing PC online games. There are three sub categories for partially charging contents: inducing service purchase, utilizing service, and consuming service. The first type provides free downloading and use of the gaming service, but has paid purchases for items that enhance the statistics / playing experience, or reduce consumable items or repetitive procedures. The second is where the firm does not directly sell products; instead, they actually create profit by providing users with paid items in exchange for facilitating advertisements and networks through inviting friends. The third sub category is where the partial charging can be used as a product. For example, in smartphone GPS games, the actual distance between players is paid through transportation costs, depending on how far they are. Partial charging is one of the most highly favored business models within mobile platforms, and is also referred to as In-App Purchasing11.
The third type is when downloading the App from the App Store is free, and the product is changed into a paid version if the customer’s satisfaction is achieved and curiosity is stimulated. This type is divided into three sub categories: the elimination of banners in Apps once changed into a paid version, the elimination of a trial period, and a full version with all services included. This type is established in PC software. This type of bundle software refers to providing licenses for already installed software in PCs or smartphones12.
Free mobile App services can be defined as situations that do not apply to the definitions for paid apps services given above. Free mobile app services can be divided into two types depending on whether the service exposes advertisements or not.
First of all, the non-advertisement type is when there are no advertisements after loading the app. This include cases when the developer designed the product for self-realization or fame.
Secondly, the advertisement type includes various banners following the loading of the app service. This type includes advertisements within freely downloadable mobile app services, most typically being used in information-providing mobile app services. The makers of advertisement type mobile app service gain profit from banners. The advertisement type can sometimes be changed into a paid version, under the conditions that the banners are removed.
II.RESEARCHMETHODS
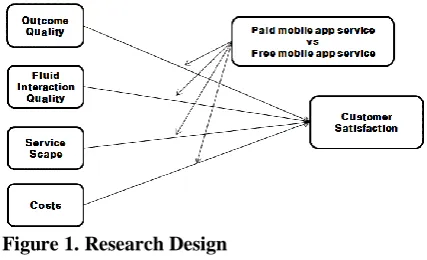
2.1. Research Design
This study is composed of the MOBISQUAL measurement model from Precedent research2, along with a study model regarding costs and
International Journal of Innovative Technology and Exploring Engineering (IJITEE) ISSN: 2278-3075, Volume-8 Issue-8S2, June 2019
Figure 1. Research Design
2.2. Research hypothesis
In <figure 1>, mobile app services have created a model where the combination of outcome quality, fluid interaction quality, service scape, and cost result in the establishment of mobile internet service quality. Empirical analysis of the factors in the MOBISQUAL measurement model presented by Precedent research2 will determine whether they are preceding variables for measuring the quality of mobile app services. After so, observation for meaningful differences between the impact of paid and free app services on customer satisfaction will be done.
Hypothesis 1: the perceived result quality of mobile app services by customers will have a positive influence on customer satisfaction.
Hypothesis 2: the perceived fluid interaction quality of mobile app services by customers will have a positive influence on customer satisfaction.
Hypothesis 3: the perceived service scape quality of mobile app services by customers will have a positive influence on customer satisfaction.
Hypothesis 4: the perceived service costs of mobile app services by customers will have a positive influence on customer satisfaction.
Hypothesis 5: the perceived result quality of mobile app services by customers will have more significant impacts in free mobile apps over paid ones.
Hypothesis 6: the perceived fluid interaction quality of mobile app services by customers will have more significant impacts in free mobile apps over paid ones.
Hypothesis 7: the perceived service scape of mobile app services by customers will have more significant impacts in free mobile apps over paid ones.
Hypothesis 8: the perceived service costs of mobile app services by customers will have more significant impacts in free mobile apps over paid ones.
2.3. Operational definition
This study has selected surveys to verify the hypothesis provided above. The variables in this research model include result quality, fluid interaction quality, service scape, cost, and customer satisfaction. The mentioned variables in this study have been measured by Likert’s five-point scale (1=Strongly disagree, 5=Strongly agree). The measured items for each variable are based on credible and valid items from preceding research, and have been adjusted for this study.
Outcome quality indicates what is left to the customer after the service production process13. Fluid interaction quality is a level of quality that reflects the mobile environment, where interactions take place limitations on space and time14. Service space quality, which is a level of service environment, indicates the physical environmental quality15. Costs refer to the perceived levels of financial and mental cost for using a certain product or system16. Customer satisfaction is defined as the satisfactory reactions of cognitive emotions from the consumption experience 4.
III.EMPIRICALANALYSIS
This study conducted surveys on Chinese students and their acquaintances. The surveys were distributed through Chinese survey site http://sojump.com, and gathered 226 results through online data collection methods where students and related acquaintances accessed the site and filled out the surveys. After deleting invalid results, 206 were used in the final analysis. The respondents were mostly in the type of paid app service users 100 (48.5%) and free app service users 106 (51%). The collected data was analyzed through Amos 21.0 for statistical processing.
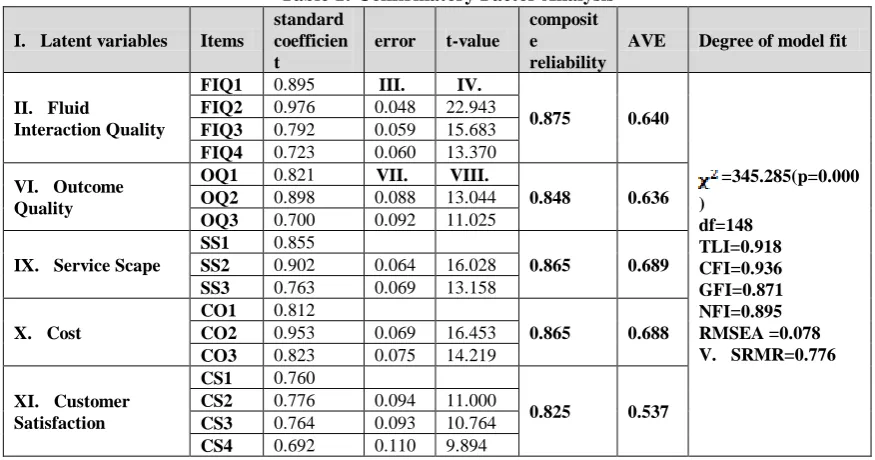
Considering Consistent with conceptualization, a 5-factor measurement model was estimated using AMOS ver. 21.0. The value was significant (see Table 1, x^2 =345.285, df=148, p<0.001). Also, other fit indices indicated a good fit for data (TLI=0.918, CFI=0.936, GFI=0.871, NFI=0.895, RMSEA =0.078).
Table 1: Confirmatory Factor Analysis
I. Latent variables Items
standard coefficien t
error t-value
composit e
reliability
AVE Degree of model fit
II. Fluid
Interaction Quality
FIQ1 0.895 III. IV.
0.875 0.640
=345.285(p=0.000
) df=148 TLI=0.918 CFI=0.936 GFI=0.871 NFI=0.895 RMSEA =0.078 V. SRMR=0.776 FIQ2 0.976 0.048 22.943
FIQ3 0.792 0.059 15.683
FIQ4 0.723 0.060 13.370
VI. Outcome Quality
OQ1 0.821 VII. VIII.
0.848 0.636 OQ2 0.898 0.088 13.044
OQ3 0.700 0.092 11.025
IX. Service Scape
SS1 0.855
0.865 0.689 SS2 0.902 0.064 16.028
SS3 0.763 0.069 13.158
X. Cost
CO1 0.812
0.865 0.688 CO2 0.953 0.069 16.453
CO3 0.823 0.075 14.219
XI. Customer Satisfaction
CS1 0.760
0.825 0.537 CS2 0.776 0.094 11.000
CS3 0.764 0.093 10.764
CS4 0.692 0.110 9.894
As the AVE of variables is greater than 0.5, the convergent validity of variables is established. For discriminant validity test, the square root of AVE of each variable is compared with correlation between the same variable and other
variables. In <Table 2>, the discriminant validity of variables is established as the square root of AVE of each variable is greater than the correlation between the same variable and other variables.
Table 2: Correlation Analysis of Variables XII. Measurin
g variables
XIII. AV E
XIV. (A) XV. (B )
XVI. (C )
XVII. (D )
XVIII. (E ) XIX. (A) Fluid
Interaction Quality
XX. 0.640 XXI. 0.80 0
XXII. XXIII. XXIV. XXV.
XXVI. (B)
Cost 0.688 0.507 0.829
XXVII. XXVIII. XXIX.
XXX. (C)
Service Scape 0.689 0.436 0.558 0.830
XXXI. XXXII.
XXXIII. (D) Outcome Quality
0.636 0.233 0.358 0.353 0.797
XXXIV.
(E) Customer
Satisfaction 0.537 0.461 0.460 0.527 0.455 0.733
Note: The diagonals represent the square root of average variance extracted and the other entries represent the correlation.
Support for convergent validity is offered through the highly significant loading estimates for each individual factor. All factor loadings were highly significant and exceeded the 0.5 level, which is considered the critical standard in factor analytic investigation.
Based on comparing with average variance extracted (AVE) and squared correlation of <Table 2>, discriminant validity has also been secured by showing that AVE of factors is higher than squared correlation.
<Table 2> is showing each correlation of variables, there is significantly positive relationship between all variables.
Before Hypothesis testing, this study was examined for the degree of research model using AMOS ver. 21.0. The result of model fit indicated to satisfy as follows (χ^2=242.868, p<0.001, df=106, TLI=0.931, CFI=0.946, GFI=0.886, NFI=0.909, RMSEA =0.078, SRMR=0.773).Thus, there was no problem for structural model of research; the model was used for hypothesis testing.
International Journal of Innovative Technology and Exploring Engineering (IJITEE) ISSN: 2278-3075, Volume-8 Issue-8S2, June 2019
Table 3: Test Results of Research Model: Direct Effect
Hypothesis Estimated
coefficient t-value Result
H1 Outcome Quality → Customer
Satisfaction 0.269 3.569*** Accepted
H2 Fluid Interaction Quality →
Customer
Satisfaction 0.222 2.935** Accepted
H3 Service Scape → Customer
Satisfaction 0.269 3.179** Accepted
H4 Cost → Customer
Satisfaction 0.156 2.860** Accepted =242.868(p=0.000), df=106, TLI=0.931, CFI=0.946
GFI=0.886, NFI=0.909, RMSEA =0.078, SRMR=0.773
<Table 3>as results of hypothesis 1, 2, 3, 4 indicated causal relationship among outcome quality (OQ), fluid interaction quality (FIQ), service scape (SS), service cost (CO), customer satisfaction (CS).
Hypothesis 1 states that outcome quality will be positively related to customer satisfaction. The finding that outcome quality (coefficient=0.269, t-value=3.569, p<0.001) had significant positive effect on customer satisfaction was consistent with H1.
Hypothesis 2 states that fluid interaction quality will be positively related to customer satisfaction. The finding that fluid interaction quality (coefficient=0.222, t-value=2.935,
p<0.05) had significant positive effect on customer satisfaction was consistent with H2.
Hypothesis 3 states that service scape will be positively related to customer satisfaction. The finding that service scape (coefficient=0.269, t-value=3.179, p<0.05) had significant positive effect on customer satisfaction was consistent with H3.
Hypothesis 4 states that service cost will be positively related to customer satisfaction. The finding that service cost (coefficient=0.156, t-value=2.860, p<0.05) had significant positive effect on customer satisfaction was consistent with H4.
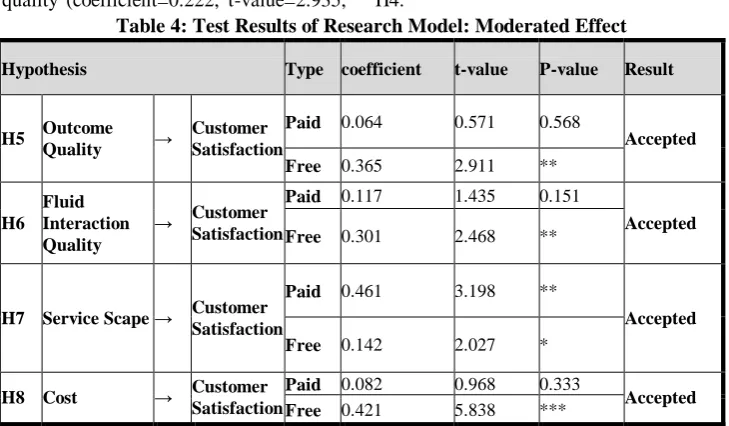
Table 4: Test Results of Research Model: Moderated Effect
Hypothesis Type coefficient t-value P-value Result
H5 Outcome Quality →
Customer Satisfaction
Paid 0.064 0.571 0.568
Accepted Free 0.365 2.911 **
H6 Fluid Interaction Quality
→ Customer Satisfaction
Paid 0.117 1.435 0.151
Accepted Free 0.301 2.468 **
H7 Service Scape → Customer Satisfaction
Paid 0.461 3.198 **
Accepted Free 0.142 2.027 *
H8 Cost → Customer Satisfaction
Paid 0.082 0.968 0.333
Accepted Free 0.421 5.838 ***
The respondents are mostly in the type of paid app service users 100 (48.5%) and free app service users 106 (51%). Hypothesis 5, 6, 7, 8states that service app will moderate causal relationship among variables as shown in <Table 4>. For examination of moderating effect between the two groups (free mobile apps and paid mobile apps), chi square difference-test was applied..
In stating H5, the finding show that paid mobile app service (coefficient=0.064, t-value=0.571, p>0.01) is less significant than free mobile app service (coefficient=0.365, t-value=2.911, p<0.05) between outcome quality and customer satisfaction.
In stating H6, the finding show that paid mobile app service (coefficient=0.117, t-value=1.435, p>0.01) is less significant than free mobile app service (coefficient=0.301, t-value=2.468, p<0.05) between fluid interaction quality and
customer satisfaction.
In stating H7, the finding show that paid mobile app service (coefficient=0.461, t-value=3.198, p<0.05) is more significant than free mobile app service (coefficient=0.142, t-value=2.027, p<0.01) between service scape and customer satisfaction.
In stating H8, the finding show that paid mobile app service (coefficient=0.082, t-value=0.968, p>0.01) is less significant than free mobile app service (coefficient=0.421, t-value=5.838, p<0.001) between service cost and customer satisfaction.
IV.CONCLUSION
This study used the MOBISQUAL measurement model on 206 customers in China to confirm
have been two findings. First, the study has confirmed the influence of service quality, which is considered as the most important factor from actual mobile app service users, and its impacts on customer satisfaction. Second, through differentiation of paid and free mobile app services, this study has confirmed levels of significant differences between the two groups, and which level has a relatively bigger impact on customer satisfaction through comparing the impacts of service quality on customer satisfaction.
The results from empirical data analysis are as follows. First, the perceived result quality of mobile app services by customers will have a positive influence on customer satisfaction.
Second, the perceived fluid interaction quality of mobile app services by customers will have a positive influence on customer satisfaction.
Third, the perceived service scape quality of mobile app services by customers will have a positive influence on customer satisfaction.
Fourth, the perceived costs of mobile app services by customers will have a positive influence on customer satisfaction.
Fifth, in the paid mobile apps, there were significant results in service scape; in the case of free mobile apps, significant results were obtained in service scape, outcome quality, fluid Interaction quality, and service cost. Also, it showed that the significant path of both mobile apps was service scape.
Service quality for free and paid mobile app services have been respectively measured through Chinese customers that have only used free mobile app services, and those that have experience using paid apps. Through this, the study has confirmed which levels of the MOBISQUAL model need to be focused on for bigger impacts on customer satisfaction for companies planning to produce or change to paid mobile app services via statistical analysis. As a result, the significant difference between the two groups was found in hypothesis 5-8, and such results determine that the dissatisfaction of customers regarding variables must be solved in the process of creating paid apps.
The limitations of this study are as follows.
First, this study has divided paid mobile app services into three categories. However, only 83 out of the 206 samples account for bundle(trial) mobile app service users that have changed to a paid version, while the survey allowing multiple answers resulted in a lack of samples to conduct independent results and comparatively analyze the impacts of mobile app service quality on customer satisfaction between the three user groups.
Second, there was an absence of statistical analysis covering the correlation between service quality and customer satisfaction for tablet PC users. Although the number of tablet PC users is continuously increasing, this study only measured the existence of tablet PCs, and didn’t conduct further statistical analysis on tablet PC users. There can be differences in the preference for mobile app services or the four levels of measuring mobile app service quality due to the recent increase in tablet PC users. In such cases, there is the possibility of change in strategies for producers of paid mobile app services.
For further research on the mentioned limitations, there first needs to be a larger number of samples. If new criteria suitable for measuring mobile app services are provided, more specific and diverse strategies can be suggested to mobile app firms when producing paid mobile app services. Secondly, if statistical analyses that include the use of tablet PCs are conducted, new strategies for tablet PC users can be suggested for paid mobile app service providers.
REFERENCES
1. Yong-Hee Kim, Young-Il Choi, Young-Ho Jin, Dong-Won Lee, A Study
on the Impact of Customer Dissatisfaction on Smartphone Applications,
The Korean Society for Quality Management Journal, 2012, 40(3), pp. 359-371.
2. Thae-Min Lee, Sang-Yeon Song, Sun-A La, MOBISQUAL:
Dimensionalizing and Measuring Mobile Internet Service Quality, KOREA MARKETING ASSOCIATION, 2009, 24(1), pp. 145-1799.
3. HowardJ A, JN Sheth, The theory of buyer behavior, NewYork : Wiley,
1969.
4. Oliver RL, Whence Consumer Loyalty?, Journal of Marketing, 1999,
63(1), pp. 33-44.
5. ChurchillG A, Carol Surprenant, An investigation in to the determinants of
customer satisfaction, Journal of Marketing, 1982, 19(11), pp. 491-504.
6. Parasuraman A, V A Zaithaml, L L Berry, A Conceptual Model of Service
Quality and Its Implications for Future Research, Journal of Marketing, 1985, 49(3), pp.41-50.
7. Anderson E W, M W Sullivan, The antecedents and consequences of
customer satisfaction for firms, Marketing Science, 1993, 12(2), pp.125-143.
8. Hak-Sik Lee, Young Kim, Service Quality and Service Value, ASIA
MARKETING JOURNAL, 1999, 1(2), pp. 77-99.
9. Jong-Chul Park, Hye-Young Oh, Sung-Jun Hong, The Investigating of
Psychological Mechanism in the "Service Quality-Customer Satisfaction Relation", Journal of Consumer Studies, 2011, 22(2), pp. 179-202.
10. Li xian ling, jin bai xiong, An Exploratory Study on the smartphone app
purchase decision factors, Journal of the Korea Society of Management Information Systems Conference, 2010, 10(1), pp. 160-165.
11. Mi- dong Xuan, Wu-KuiHuan, 4p strategy based on mobile network game
show part snow Charge mode, the south Korean computer games to learn paper, 2013, 26(2), pp. 81-92.
12. Xia Guangzhu, the software user satisfaction survey research, content of
south Korean society thesis, 2012, 12(4), pp. 216-224.
13. Gronroos C, A Service Quality Model and its Marketing Implications, European Journal of Marketing, 1984, 18(4), pp.36-44.
14. MolAJ,Law, Regions, Networks and Fluids: Social Topology, Social
studies of science, 1994, 24(4), pp.641-671.
15. BitnerM J, Servicescapes: The Impact of Physical Surroundings on
Customers and Employees, Journal of Marketing, 1982, 56(4), pp. 57-71. 16. Jong-Chul Oh. A Study on Purchasing Intention of Application using Theory of Reasoned Action, Korean Corporation Management Review, 2011, 40(1), pp. 141-163.
17. R P Bagozzi, Y J Yi, On the evaluation of structural model, Journal of the