International Journal of Innovative Technology and Exploring Engineering (IJITEE) ISSN: 2278-3075, Volume-8 Issue-8 June, 2019
Abstract: The research focuses on the efficient approach to find out the connectivity between nodes and provides the list of networks of the network if available. Networks can be logically represented as a graph; graph traversal is one of the common mechanisms in the network to find the connectivity and subnetworks. In this proposed approach stacks are used to find a number of connected components. The number of resultant stacks is a metric for measurement of components. The proposed algorithm is efficient compared to graph traversal techniques like BFS and DFS as its order of complexity is O(n2). Finding a number of components can be useful to find connectivity in networks to check reachability in the network, connectivity in any electronic circuits and island and so on. The graph can be represented by adjacency matrix or incidence matrix. If there is an edge between two vertices then it is represented by 1 and 0 otherwise. Incidence matrix is an n*m matrix where n is a number of vertices and m is a number of edges, where rows represent vertices and column represents edges. If two vertices are connected by an edge then it is represented by 1 and 0 otherwise.
Index Terms: Adjacency Matrix, Graph; Networks of Network, Stack, VBS.
I. INTRODUCTION
A graph is said to have a component if every node has a path from every other node. For this paper here only unidirectional and non-weighted graphs are considered. There are already some methods to extract components in a graph, like a depth-first search, branch and bound methods. In this paper, stacks are used to find a number of components.
Graphs are represented as adjacency matrix; by using adjacency matrix individual components are extracted. In an undirected graph, a vertex ‘v’ is reachable from a vertex ‘u’ if there is a path from ‘u’ to ‘v’. Reachability is an equivalence relation since it is reflexive, symmetric and transitive. This method is tested for dif-ferent types of graphs but this requires a basic condition that the sum of degrees of all vertices should be even and also this doesn’t work for trees. The tree is a graph in which any two vertices are connected by an exactly one single path. Also, the tree is defined as an acyclic connected graphIn order to find the number of components, stacks are used. A stack is an abstract data structure which serves as a collection of similar elements with principles like first in last out or last in first out. Push is
Revised Manuscript Received on June 07, 2019.
Prajwala. N. B, Department of Computer Science, Amrita School of Arts
& Sciences, Amrita Vishwa Vidyapeetham, Mysuru, India.
Vijayalakshmi. M. K, Department of Computer Science, Amrita School of
Arts & Sciences, Amrita Vishwa Vidyapeetham, Mysuru, India.
an operation to add or insert an element from the top of the stack whereas pop is an operation to delete or remove an element from the top of the stack. The element which is inserted first will be in the rare end of the stack and the element which is inserted last will be in the top of the stack. Size of the stack can be found by stack [top]-stack [rare]. A number of stacks at the end are nothing but a number of components in a graph. There are different types of graphs in graph theory. This metho-dology works well for graphs with bridges, self-loops, cyclic and acyclic graphs and isomorphic graphs. But here the main constraint is that the vertices in individual components should be named in such a way that all vertices are traversable without repeating edges. The size of each stack gives the total number of vertices in a component and the number of resultant stacks gives the total number of components.
II. APPLICATIONOFGRAPHTHEORYINVARIOUS FIELDS
Knowingly or unknowingly graph theory is used in all branches of Science. Similarly, the idea of finding a number of components in a given graph also helps in various branches of science like Physics, Chemistry, Biology, and many more fields. The main application is to check the connections or reachability. This concept is also used in solving problems like traveling salesman problem [1], postman problem, and some similar problems. Graph theory is used mostly in Physics [2] for circuit connections. The connection of battery, voltmeter, ammeter, resistance using wires can be done by using the concept of graph theory. The idea of finding the number of components in the given graph helps to check the connectivity of the circuits. The application of graph theory to the network has a real-time advantage. This idea of finding the number of components in the given graph also helps in a network of telephone connections, Google maps [3], railroads, highways, pipelines of gas and water and so on to know the connectivity. By knowing the number of components of the graph, the network connection, as well as dis-connection, can be identified. Finding connected components in network help for better data aggregation and to find optimal route to transfer data[12][13]. Graph theory is also used in the Electrical network, which is the collection of interconnected electrical devices like capacitors, batteries, resistors, and switches.
An Efficient Stack Based Graph Traversal
Method for Network Configuration
After finding the number of components using this algorithm, the connectivity and disconnectivity in the network can be found. Graph theory is also widely used in the field of Chemistry [4]. Graph theory is used to represent structural formulae of chemicals, where a number of vertices represent the atoms and number of edges represents the bonds. Graph theory finds its application in cluster computing in order to calculate the interconnection and network utilization be-tween cluster components also it helps in creating logs for schedu-lers for monitoring performance[11]. In RREQ Protocol, Path optimization is done using the graph technique in the wireless sensor network to send the information from source to sink. This protocol helps to achieve the load balancing in the WSN[12][13]. In MVBS protocol modified CDS is used to generate the backbone network with the help of graph and sub graph, in this graph is con-sidered as the wireless sensor network and sub graph is considered as the backbone network. This protocol increases the lifetime of WSN[13].
III. RESEARCHMETHODOLOGY
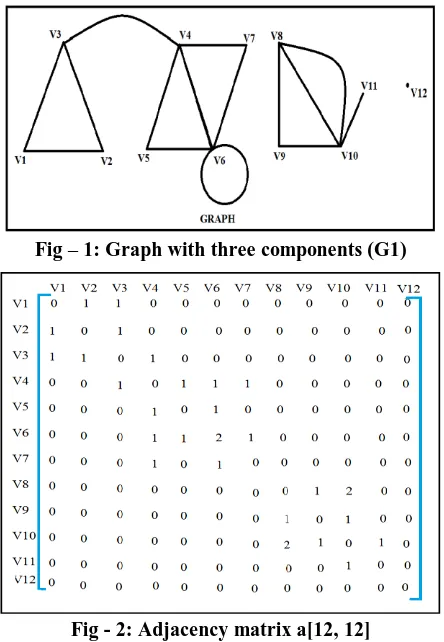
[image:2.595.317.529.418.561.2]The minimum number of networks of network is one and a maximum number of networks of network may be n, where n represents the number of nodes and indicates that all nodes are isolated. The graph is represented using adjacency matrix a[n,n], where n is a number of vertex and size of the matrix. The different vertex that is, indices are represented as V1, V2… Vn and stacks are represented as S1, S2…Sn.
Fig – 1: Graph with three components (G1)
Fig - 2: Adjacency matrix a[12, 12]
In this methodology, only undirected graphs are considered so the adjacency matrix is always a symmetric matrix with its diagonal elements equal to zero or two. The
traversal can be checked only for elements above diagonal or for the elements below the diagonal. Traversal always starts from a[i][i+1].
The traversal starts from first-row second column element of the matrix, that is from a[V1][V2] the element at a[V1][V2] is 1 that indicates there is a path from V1 to V2. V1 and V2 are pushed on to stack. V2 will be at the top of the stack S1. The next traversal starts from top element of the stack that is V2. The element at a[V2][V3] is 1 hence V3 is pushed on to the stack. The process continues until further traversal is not possible or all the vertices are covered. If further traversal is not possible and all vertices are not covered then a new stack is created and the vertex is pushed on to the stack. In this example from V7 traversal is not possible and vertices V8, V9, V10, V11, and V12 are remaining so the traversal starts from V8. V8 is pushed to new stack S2. From V8 the possible traversal is V9 hence V9 is pushed on to the stack. The traversal starts from top element of the stack that is V9. The traversal continues until all vertices till V11 are pushed on to the stack S2, so S2 has elements V8, V9, V10, V11. The traversal cannot be continued but the vertex V12 is still remaining, hence the traversal starts from V12, V12 is pushed on to the new stack S3. No more traversal is possible from the vertex V12, vertex V12 considered as an isolated vertex. The number of the stack at the end of traversal gives the number of components in the graph and the size of each stack gives the number of vertices in each component, here S3 has one element that indicates V12 is an isolated vertex.
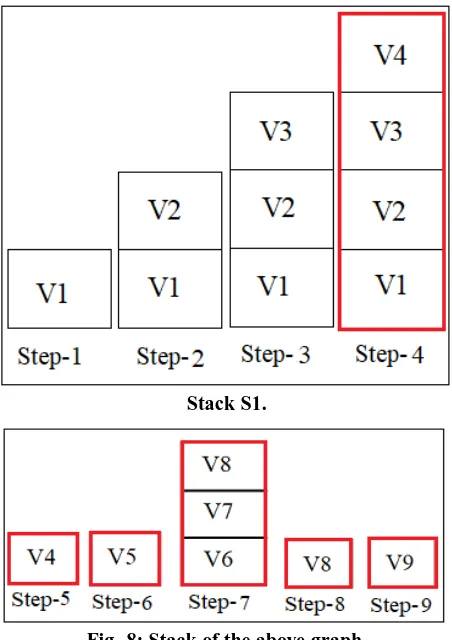
Stack S1: First stack with 7 vertices.
Fig - 3: Stack S1 for the first component
Stack S2: Second stack with 4 vertices.
[image:2.595.58.280.421.742.2]International Journal of Innovative Technology and Exploring Engineering (IJITEE) ISSN: 2278-3075, Volume-8 Issue-8 June, 2019
Stack S3: Third stack with 1 vertex.
Fig -5: Stack S3 for the third component.
Three stacks are produced for this graph. That shows there are three components in the graph. The size of the first stack is seven that means the first component has seven vertices V1, V2, V3, V4, V5, V6, and V7. The size of the second matrix is four that indicates the second component has four vertices that are V8, V9, V10, and V11. And the size of the third matrix is one that indicates that the third component has one vertex V12.
[image:3.595.313.539.50.370.2]This method works well for graphs with ordered vertices, graphs with isolated vertices and graph with maximum of one pendant vertex for a component. The ordering of vertices means that all vertices are traversable starting from one vertex without repeating any vertices.
[image:3.595.134.205.55.133.2]Fig - 6: Graph with changed vertex order and three pendant vertices
Fig - 7: Adjacency matrix a[9,9].
Stack S1.
Fig -8: Stack of the above graph.
[image:3.595.51.287.314.473.2]The result indicates that there are 6 components in the graph with four isolated vertex which is wrong. So the ordering of the graph and pendant vertices not more than 1 for a component is important in this algorithm. The proposed algorithm is implemented to check the connectivity between all nodes, between sub-networks and individual network infrastructure. This can be further used in electronics to find a number of circuits, also useful in designing layouts for water connections and electric connections
IV. ALGORITHM
Input: n-number of nodes, adjacency matrix a[n][n]. Output: S1, S2… Sm, that is m number of stacks, k1, k2… km that is the size of each stack.
push(V): Sm[top]==V top++;
1: a[n][n] input. 2: m=1, p=0 3: top= -1
4: push (V1) to stack S1 5: for i=1 to (n-1) 6: for j=(i+1) to (n-1) 7: if a[i][j]==1 8: push Vj to stack Sm 9: i=j
10: end if 11: else
12: if ((a[i][n]==0)&&(i<n)) 13: p=top
14: (p+1) number of vertices in a component. 15: m++
16: top= -1
17: push (V(i+1)) to stack Sm 18: go to step-4
19: end for
20: m number of components.
V. TIMECOMPLEXITY
The time complexity for this algorithm directly depends on the number of vertices in a graph as the number of vertices increases the time complexity also increases. If there are n isolated vertices in a graph then n stacks are generated.
The time complexity of this algorithm is (n/2)(n2-n+1). Time com-plexity always depends on the number of vertices in a graph. The complexity of this algorithm is Ɵ(n3/2).
T α (n/2)(n2-n+1)
Fig-9: Time versus a number of vertices.
n=1 n=2 n=3 n=4 n=5
T 0.5 3 10.5 26 52.5
0
10
20
30
40
50
60
1
2
3
4
5
6
Time
-->number of
-->Ti
me
Fig-10: Graph for time versus number of vertices
VI. CONCLUSION
This algorithm performance is efficient with parallel communication links between the nodes, self-path, bridges and isolated nodes. But requires nodes to be in order according to the physical or logical address and it should be in the form of the adjacency matrix. It efficiently gives the number of networks of network and listing the number of nodes of each network.
APPLICATIONS
This can be implemented in maps, electricity connection, networks to find a number of connected components and disconnected com-ponents.
This algorithm can be extended to work for graphs with more than one pendant vertices and tree.
ACKNOWLEDGEMENT
Wholeheartedly, I thank Mr.Santosh Anand and Mr. Manishankar for supporting us in all aspects to publish this paper, providing encouragement and for extending the support possible at each stage of the paper.
REFERENCES
1. S G Shrinivas, S Vetrivel and Dr. N M Elango “Application of Graph Theory in Computer Science an Overview”, International Journal of Engineering Science and Technology, Volume 2(9), 2010, 4610-4621. 2. Bhagya Jyothi Nath “Applications of Graph Theory in Different Branches
of Science”, International Journal of Mathematics and its Applications, Volume 5, Issue 3-A (2017), 57-60, ISSN: 2347-1557.
3. Tami Dudo, Sarah Kostroun and Dr. Dylan A. Shell “Graph Theory in Everyday Life”, Research Experience for Teachers Summer 2014, Department of Computer Science and Engineering Texas A&M University.
4. Kiran Kaundal “Application of Graph Theory in Everyday Life and Technology”, Imperial Journal of Interdisciplinary Research (IJIR), Vol-3, Issue-3, 2017, ISSN: 2454-1362.
5. Narasingh Deo, “Graph Theory with Applications to Engineering and Computer Science”, Prentice Hall of India, 1990.
6. Sven Dickinson, Pelillo, Ramin Zabih, “Introduction to the special section on Graph algorithm in Computer Vision”, IEEE on pattern analysis, Vol 23 No. 10, September 2001.
International Journal of Innovative Technology and Exploring Engineering (IJITEE) ISSN: 2278-3075, Volume-8 Issue-8 June, 2019
hoto
8. Balaban, T., Ed. Chemical(1967), “Applications of Graph Theory”, Academic Press, London.
9. Besjana, Tosuni, Albania, “Some interesting topics of Graph Theory in Modern Computer Science and Engineering”, ISSN 1946-4690.
10.S. Gokuldcv and Radhakrishnan, R., “An improved log-based scheduling and load balancing in computational grid”, International Journal of Applied Engineering Research, vol. 10, pp. 33819-33825, 2015.
11.Manishankar, S., Ranjitha, P.R., Manoj, K.T. ”Energy-efficient data aggregation in sensor network using multiple sink data node”, Proceedings of the 2017 IEEE International Conference on Communication and Signal Processing, ICCSP 2017, 0448 – 0452. 12.Santosh Anand, Pillai Atulya Radhakrishna,”A Protocol for the Effective
Utilization of Energy in Wireless Sensor Network” International Journal of Engineering and Technology (UAE), 2018, Pages: 93-98, DOI: 10.14419/ijet.v7i3.3.14495, Published on: 21-06-2018
13.Santosh Anand, Akarsha R, “A Protocol for the Effective Utilization of Energy in Wireless Sensor Network” International Journal of Engineering and Technology (UAE),2018, Pages: 82-86, DOI: 10.14419/ijet.v7i3.3.14491 Published on: 21-06-2018.
14.Debasis Mitra, Sarmishtha Ghoshal, Hafizur Rahaman, Krishnendu Chakrabarty, Bhargab B. Bhattacharya. “Testing of Digital Microfluidic Biochips Using Improved Eulerization Techniques and the Chinese Postman Problem”, 2010 19th IEEE Asian Test Symposium, 2010.
15.Duc Tai Le, Taewoo Lee, Hyunseung Choo. “Delay-aware tree construction and scheduling for data aggregation in duty-cycled wireless sensor networks”, EURASIP Journal on Wireless Communications and Networking, 2018.
16.Manisha Shivaji Pawar, Louis Perianayagam, N Shobha Rani. “Region based image classification using watershed transform techniques”, 2017, International Conference on Intelligent Computing and Control (I2C2), 2017.
17.Prajwala, N.B.. (2018). Defect Detection in Pharma Pills Using Image Processing. International Journal of Engineering and Technology(UAE). 7. 102-106. 10.14419/ijet.v7i3.3.14497.
AUTHORSPROFILE
Prajwala.N.B Mysuru, Karnataka. MTech in ComputerScience in the year 2016 from University of Mysuru.Bachelor of Engineering in Computer Science in theyear 2013. Was selected as an intern to L&T, Mysuruduring 2015. Worked as an intern in Aplus intellitechsolution for one year on embedded c and on image processing. Worked asa team lead in aplus intellitech solution. Worked as software developer inInqola. Also worked as quality analyst. Was faculty cum research associatein the department of computer science, Amrita School of arts and science,Mysuru, Amrita Vishwa Vidyapeetham, Mysore, India. Have publishedthree research articles on image processing which are indexed in Scopus,“Defect Detection in Pharma Pills Using Image Processing” inInternational Journal of Engineering & Technology during 2018,“Identification of Fake Notes and Denomination Recognition” and “FacialExpression Recognition by Calculating Euclidian Distance for Eigen FacesUsing PCA” in IEEE explorer. Research interested area in Graph theory and Image processing.
Vijayalakshmi M K, Mysuru, Karnataka. Completed B.Ed in theyear 2018 from Amrita School of Education,AmritaVishwaVidyapeetham, Mysuru.Studied M.Sc Mathematics in the year 2015 from JSS College ofArts, Commerce and Sciences, Ooty road Mysuru. Have done fourmonths of teaching internship in Vishwaprajna School, Mysuru while doing B.Ed.Attended ‘One day National Conference on Recent Advances in Mathematics’ , organized by Department of Mathematics, JSS College of Arts, Commerce and Science,, Mysuru.Attended ‘International Conference on Mathematics- Yesterday and Today’ at JSS College of Arts, Commerce and Science, Mysuru.Participated in ‘One Day National Seminar – SUJNANA Education for Excellence’ at RIMSE, Mysuru.Project on ‘Data Integrity Proof in Cloud Storage’.Project on ‘Leaf Chromatography’.Presented a paper in National Conference “Structural,Institutional and Financial sector changes in the new Millennium and theroad ahead” on the topic “Perspective of Teacher Educators on two yearB.Ed course suggested by NCTE and assessing their TeachingCompetencies in imparting it”. Published an article “Perspective of Teacher Educators on two year B.Ed course suggested by NCTE and assessing their Teaching Competencies in imparting it” in an IOSR JOURNAL.Presented a paper in Two Day National Conference “Recent Innovations in Computing, Communication and Intelligent Systems (RICCIS’19) on the topic “An Efficient Stack Based Graph Traversal Method