Retrospective Theses and Dissertations Iowa State University Capstones, Theses and Dissertations
1-1-1981
Hydrogel coated silicone rubber for catheter
applications
Michael David Baudino
Iowa State University
Follow this and additional works at:https://lib.dr.iastate.edu/rtd Part of theEngineering Commons
This Thesis is brought to you for free and open access by the Iowa State University Capstones, Theses and Dissertations at Iowa State University Digital Repository. It has been accepted for inclusion in Retrospective Theses and Dissertations by an authorized administrator of Iowa State University Digital Repository. For more information, please contactdigirep@iastate.edu.
Recommended Citation
Baudino, Michael David, "Hydrogel coated silicone rubber for catheter applications" (1981).Retrospective Theses and Dissertations. 18073.
Approved:
Hydrogel coated si.l icone rubber for catheter applications
by
Michael David Baudino
A Thesis Submitted to.the
Graduate Faculty in Partial Fulfillment of the Requirements Tior the Degree of
MASTER OF SCIENCE
Major: Biomedical Engineering
Signatures have been redacted for privacy
Iowa State University Ames, Iowa
1981
ii
TABLE OF CONTENTS
LIST OF SYMBOLS INTRODUCTION LITERATURE REVIEW
Catheters Hydrogels Thrombosis Surface Energy MATERIALS AND METHODS
Techniques
RESULTS
Fabrication Blood Data Surgery
Scanning Electron Microscopy Contact Angle Determination SEM Micrograph Ratings
Materials Implantation
DISCUSSION
Method 1 Method 2 Method 3
SEM Analysis Contact Angle
Thrombogenicity Index CONCLUSION
RECOMMENDATIONS FOR FUTURE RESEARCH LITERATURE CITED
Figure
Figure
iii
LIST OF FIGURES
1. Schematic illustration of.the unsatisfied bonding capacity at a free surface. (Andrade, 1973).
2. The asymmetric nature of the forces exerted on surface atoms .resulting in an attraction towards the·bulk. The atom depleted·surface is then in tension. (Andrade, 1973)
12
12
Figure 3. The contact angle measurement. (Andrade, 1973). 12
Figure 4. Schematic diagrams of glass capjJlary suppor't
tubing inserted in. the Silasti'CJY tubing. 14
Figure 5. Schematic diagram of the catheter introduction unit placement in the external jugular vein,
method 1. 17
Figure 6. Schematic diagram of the catheter placement in
the external jugular vein, metli.od 2. 18
Figure 7. Schematic diagram of the catheter placement in
the vessel, method 3. 19
Figure 8. Sectioning of the catheter for SEM analysis. 20
Figure 9. Measurement of contact angle of H20 on silicone
rubber. 21
Figure lOa.
Figure lOb.
Figure lOc.
Figure lOd.
Figure lOe.
Scanning electron micrograph of Silastic<R>
(scale bar= 100 µm). · 15 keV: ·
Higher magnification of Figure lOb (scale
bar= 10 µm). 15 keV. ·
Radiation grafted 20% HEMA/0% NVP in silicone rubber (scale bar= 100 µm) 15 keV.
Higher magnification of Figure lOc (scale bar = 10 µm). 15 keV.
Radiation grafted 15% HEMA/5% NVP on silicone ·rubber (scale bar= 100 µm). 15 keV.
24
24
24
24
Figure lOf.
Figure lOg.
Figure lOh.
Figure lOi.
Figure lOj.
iv
Higher magnification of Figure lOe (scale bar = 10 µm). 15 keV.
Rad it ion grafted 10% HEMA/10% NVP on s il i corie
rubber (scale bar= 100 µm). 15 keV.
Higher magnification of Figure lOg (scale bar = 10 .µm). 15 keV.
Radiation grafted 5% HEMA/15% NVP in silicone ·rubber (sea 1 e bar = 100 µm}. 15 keV.
Higher magnification of Figure lOi {scale bar= 10 µm). 15 keV.
Figure lOk. Radiation grafted 0% HEMA/20% NVP on silicone
26
26
26
28
28
rubber (scale bar= 100 µm). 15 keV. 28
Figure 101.
Figure 11.
Figure 12. ·
Figure 13.
Figure 14a.
Figure 14b.
Figure 14c.
Figure 15a.
Higher magnification of Figure lOk (scale bar = 10 µm). 15 keV.
Crossectional view of radiation grafted 15% ·HEMA/ 5% NVP on s·ilicone rubber. (S) destgnates silicone ·rubber, (H) designates hydrogel coating. Hydrogel
coating .thickness·
is
0~05 min.(scale bar= lOOµm).Zisman plot for determining the critical surface tension of each formulation. (•) is silicone rubber, (o) is 15% HEMA/5% NVP, (~) is 10% HEMA/
10% NVP, (•) is 0% HEMA/20% NVP. Linear re-gression was utili.zed for line placement.
p _::. 0.06 for all correlation coefficients.
Sample platelet counting area (s;cale bar = 10 µm).
The counting area equals 2500 µm2. · .
;
Graphs of platelet densities for dog 2148. Catheter coating was 10% HEMA/10% NVP. Graphs of platelet densities for dog 2148. Catheter coating was 5% HEMA/15% NVP.
Graphs of platelet densities for dog 2148.-Catbeter coating was 0% HEMA/20% NVP.
Scanning electron micrograph of Silastic® catheter, section 1, at 15 minutes (scale bar= 100 µm). 15 keV. dog 2146.
v
Figure 15b .. Higher magnification of Figure 15a (scale bar =
10 lJ]ll). dog 2146. 15 keV. 43
Figure 15c.
Figure 15d.
Figure 16a.
Silastic® catheter, section 2, at 15 minutes (scale bar = 10 µm). · 15 keV. 20° tilt. dog 2146 ..
Silasti~
catheter, section 6, at 15 minutes(scale bar = 33.3 um). 15 keV. 20° tilt. dog 2146,
Scanning electron
mic~ograph
of Si"lastic®catheter, section 2, at 30 minutes· (scale bar= 100 µm). 15 keV. dog 2146.
Figure 16b. Higher magnification of Figure 16a (scale
bar = 10 µm). 15 keV. dog 2146.
Figure 16c.
Figure 16d.
Figure 17a.
Figure 17b.
Figure 17c.
Figure 17d.
Figure 17e.
Figure 17f.
Si lastic® catheter .. section 4, at 30 minutes (scale bar = 33.3 µm). 15 keV. 30° tilt. dog 2146.
Silastic® catheter, section 8, at 30 minutes (scale bar= 33.3 µm). 15 keV. :30° tilt. dog 2146.
Scanning electron micrograph of Silastic® catheter, section 1, at 60 minutes (scale bar= 100 µm). · 15 keV. dog 2146.
Silastic® catheter, section 4 at 60 minutes (scale bar = 20 µm). 15 keV. 2d' tilt. dog 2146.
Silastic®catheter, section 5 at 60 minutes (scale bar = 10 µm). 15 keV. dog 2146. Sil asti c® catheter, section 7, at 60 minutes
(scale bar= 2 µm). 15 keV. dog 2146. Silastic® catheter, section 8, at 60 minutes
(scale bar= 33.3 µm), 15 keV. 30° tilt. dog 2146.
Higher magnification of Figure 17e (scale bal' = lOOµm). · 15 keV. 30° tilt. dog 2146.
Figure 18a.
Figure 18b.
Figure 18c.
Figure 19a •
Figure 19b.
vi
Saanning electron mi<;:rograph of SHastic®
cath.eter, section 1,
at
15 minutes (scalebar = 100 i.im). · 15 keV. dog 2130.
Higher magnification of Figure 18a (seal e bar = 10 µm). 15 keV. dog 2130.
Sil asti c® catheter, section 7, at 15 minutes (scale bar= 10 µm). · 15 keV. dog 2130. Scanning electron micrographs of Silastic® . catheter, section 1, at 30 minutes {scale
bar = 100 µm). 15 keV. dog 2130.
Scanning
electr~n
micrograph ofS.ilasti~
catheter, section 1, at 60 minutes (scale bar ,; 100 µni). 15 keV. · dog 2130.
52
52
52
54
54 Figure 19c. Photograph of the recovered thrombi stripped
during withdrawal1. (scale bar = 1 inch). 54
Figure 20a. Scanning electron micrognaph of the 20% HEMA/ 0% NVP grafted catheter, section 1, at 15
minutes (scale bar = 100 µm). 15 keV. dog 2146. 52
Figure 20b. Higher magnification of. Figure 20a (scale bar =
10 µm). 15 keV. dog 2146. 56
Figure 20c. 20% HEMA/0% NVP, Section 2 at 15 minutes (scale
bar= 20 µm). 15 keV. dog 2146. 56
Figure 20d. 20% HEMA/0% NVP, Section 4, at 15 minutes (scale bar= 33.3 µm). 15 keV. dog 2146. Figure 21a.
Figure 2lb.
Figure 21c.
Figure 21d. ·
Scanning electron micrograph of the 20% HEMA/ 0% NVP grafted catheter, section 1, at 30
minutes (scale bar= 100 µm). 15 keV. ·dog 2146. Higher magnification of Figure 21a (scale bar = 10 µm). 15 keV. dog 2146.
20% HEMA/0% NVP grafted catheter, section 2, at 30 minutes (scale bar= 33.3 µm). 15 keV. dog 2146.
20% HEMA/0% NVP grafted catheter, section 4, at 30 minutes (seal e bar = 33. 3 µm) . · 15 keV. dog 2146.
56
58
58
60
Figure 21e.
Figure 22a.
Figure 22b.
vii
20% HEMA/0% NVP. grafted catheter, section 7, at 30 minutes (scale bar = 10 µm). 15 keV. dog 2146.
Scanning electron micrograph of the 20% HEMA/ 0% · NVP grafted· catheter, .section 1, at 60 . mtnutes (scale bar = 100 µm). 15 keV. dog
2146.
Higher magnification of Figure 22a (scale bar = 10 µm). 15 keV. dog 2146.
Figure 22c. 20% HEMA/0% NVP grafted catheter, section 2, at 60 minutes (scale bar = 0.4 mm). 15 keV.
60
62
62
dog ·2146. 62
Figure 23a. Scanning electron micrograph of the 20% HEMA/ 0% NVP grafted catheter, .section 1, at 60 minutes (scale bar = 100 µm). 15 keV.
dog 2130. 65
Figure 23b. Higher magnification of Figure 23a (scale bar
=
10 µm). 15 keV. dog 2130. · 65
Figure 23c. 20% HEMA/0% NVP grafted catheter, section 1,
at 60 minutes (sea 1 e bar = 10 µm). . Thrombus
partially stripped. 15 .keV. dog 2130. 65
Figure 24a. Scanning electron micrograph of the 15%.HEMA/ 5% NVP grafted· catheter, section 1, at 15 minutes (scale bar= 100 µm). 15 keV. dog
2146. . 67
Figure 24b. Higher magnification of Figure 24a (scale bar
=
10 µm). 15 keV. dog 2146. · 67
Figure 24c. 15% HEMA/5% NVP, grafted catheter, section.2,
at 15 minutes (scale oar :: 10 µm). 15 l<eV~
10 tilt. dog 2146. 67
figure 24d. 15% HEMA/5% NVP, grafted· cath.eter, section 3, at 15 minutes (scale bar = 10 ]lm). 15 keV.
Figure 24e.
vi ii'
The 15 % HEMA/5% NVP grafted catheter, section 4, at 15 minutes (scale bar = 10 µm). 15 keV,
10° tilt. dog 2146. 67
Figure 24f. · Lower.magnification of Figure 24e (scale bar=
33.3 µm). 15 keV. dog 2146. 69
Fi g\ire 24g.
Fi'gure 24h ..
Figure 25a.
Figure 25b.
Figure 25c.
15% HEMA/5% NVP .grafted catheter; section 6, at 15 minutes (scale bar = 33.3 µm). 15 keV. dog 2146.
15% HEMA/5% NVP.grafted catheter, section 8, at 15 minutes (scale bar = 33.3 iim). 15 keV. 10° tilt. dog 2146.
Scanning electron micrograph of. the 15% HEMA/ 5% NVP grafted catheter, section 1, at 30 minutes (scale bar= 100 µm). 15 keV. dog 2146.
Higher magnification of Ftgure 25a (scale bar = 10 µm). 15 keV. dog 2146 •
. The 15% HEMA/5% NVP grafted catheter. sectio.n 3, at 30 minutes· (scale bar,; 100 µm). · 15 keV. dog 2146.
69
69
71
71
73 Figure 25d. Higher magnification of Figure 25c. (scale bar=
10 µm). 15 keV. dog 2146. 73
Figure 25e. 15% HEMA/5% NVP ,grafted catheter, section 2, at 30 minutes (scale bar= 0.25mm ). 15 keV.
dog 2146. 73
Figure 25f. 15% HEMA/5% NVP grafted catheter, section 4, at 30 minutes (scale bar = 0.25 mm). 15 keV.
dog 2146. 73
Figure 25g. The 15% HEMA/5% NVP grafted catheter, section 6, at 30 minutes (scale bar= 0.25mm). 15 keV.
dog 2146. 75
Figure 25h. 15% HEMA/5% NVP grafted catheter, section 7, at 30 minutes (scale bar = IO µm). 15 keV.
dog 2146. 75
Figure 25i. 15% HEMA/5% NVP grafted catheter, sec ti on 8 at 30 mi'nutes (scale bar= TOO µm). 15 keV.
Figure 25j.
Figure 26a.
ix
Hi.gber magnification of Figure 25i (scale bar =
io µm). · 15 keV ~ d.og 2146.
Scanning electron micrograph of .the 15% HEMA/ 5% NVP grafted catheter; section 1, at 60 minutes (scale bar= 50 µm). · ·15 keV. dog
2146.
Figure 26b. Higher magnification of Figure 26a (scale bar =
75
78
3.33 µm). 15 keV. dog 2146. 78
Ftgure 26c.
Ftgure 26d.
Figure 26e.
Figure 26f.
Figure 26g.
Figure 27a.
.15% HEMA/5% NVP grafted catheter, section 2 at
60 minutes· (scale bar= 10 µm). 15 keV~ dog
2146.
15% HEMA/5% NVP grafted catheter, section 4, at. 6.0 minutes (s:cale bar ,; 10 µIn). · 15 keV.
10° tnt. dog 2146.
The 15% HEMA/5% NVP grafted catheter, section 6,
at 60 mi nut es (seal e bar
=
10 µm). 15 keV.dog 2146.
15% HEMA/5% NVP grafted catheter, section 7; at 60 minutes (s:ca le bar ,; 10 µm). 15 keV. dog 2146.
15% HEMA/5% NVP grafted catheter, secti'on 8, at 60 minutes (scale oar ,; 10 µm) •. 15 keV.
dog 2146. ·
Scanning electron micrograph of. the 15% HEMA/ 5% NVP grafted catheter; .section 1, at 15 minutes (scale bar ,; 100 t1m). · 15 keV. dog
2130. ,
78 78 80 80 80 82 Figure 27b. Higher magnification of Figure 27a (scale bar =
10 µm). 15 keV. dog 2130. 82
Figure 27c. 15% HEMA/5% NVP, grafted catheter, sec ti.on 1, at 15 minutes (scale bar = 10 µm). · 15 keV.
dog 2130. 82
Figure 27d. 15% HEMA/5% NVP ,grafted cathetflr, section 7, at 15 minutes (scale bar,; 10·\Jm). 15 kev;
Figure 28a.
x
Scanning electron micrograph of the 10% HEMA/ 10% NVP grafted catheter, section 1,. at 15 minutes (scale bar = 100 µm). 15 keV.
dog 2146. 84
Figure 28b. Higher magnifieation of Figure 28a (scale bar =
10 µm). 15 keV. dog 2146. · 84
Fi'gure. 28c.
Figure 28d.
Figure 29a.
Figure 29b.
Figure 29c.
Figure 29d.
Figure 29e.
10% HEMA/10% NVP grafted catheter, s.ection 2, at 15 minutes (scale bar= 10 µm). 15 keV. dog 2146.
10% HEMA/10% NVP grafted catheter, section 6, at 15 minutes (scale bar= 33.3 µm) ... 15 keV. 30° tilt. dog 2146.
Scanning electron micrograph of the 10% HEMA/ 10% NVP grafted catheter, .section ·I at 30 minutes (scale bar"' 100 µm). 15 keV. dog 2146.
Higher magnification of Figure 29a (scale bar =
1 O µm) . 1 5 keV. dog 2146 •
10% HEMA/10% NVP grafted catheter, section 2, at 30 minutes (scale bar= 10 µm). 15 keV. 20° tilt. dog 2146.
10 % HEMA/10% NVP grafted catheter, section 3, at 30 minutes (scale bar = 10 µm). 15 keV;
dog 2146. ·
10% HEMA/10% NVP grafted catheter, section 6, at 30 minutes (scale bar = 10 µm). 15 keV. 30° tilt. dog 2146.
Figure 30a. Scanning electron micrograph. of the 10% HEMA/ 10% NVP grafted catheter; section 1, at 60 minutes· (sea 1 e bar = 100 µm). · 15 keV. dog
84 84 86 86 88 88 88
2146. 90
Figure 30b. Hfgher magnification of Ftgure 30a (scale bar =
10 µm). 15 keV. dog 2146. 90
Figure 30c. 10% HEMJi/10% NVP grafted catfleter, section 5, at 60 minutes (sea 1 e bar :: 10 µm). 15 keV;
Figure 3Qd.
Figure 3la.
Figure 3lb.
Figure 31c.
Figure 31d.
Figure 3le.
Figure 31 f.
Figure 31g.
Figure 32a.
Figure 32b.
figure 32c.
figure 32d.
xi
10% HEMA/10% NVP. grafted catheter, section 6, at 60 minutes (scale bar = 30 µm). ·· 15 keV.
20° tilt. dog 2146; ·
Scanning electron micrograph of the 5% ·HEMA/ 15% N\iP grafted.catheter, section 1, at 15 minutes (scale bar ,; 100 µm). 15 keV. dog 2146.
Higner magnification of Figure 3la (scale bar = 10 µm). 15 keV. dog 2146.
·· 5% HEMA/15% NVP grafted catheter, section 2, at 15 minutes ·(scale oar = 33.3 µm). 15 keV. 20° tilt. dog 2146.
5% HEMA/15% NVP grafted catheter, s.ection 3, at 15 minutes (seal e oar = 10 µm). 15 keV.
dog 2146. ·
5% HEMA/15% NVP grafted catheter, section 5, at 15 minutes (scale bar,; 10 µm). · 15 keV. dog 2146.
5% HEMA/15% NVP grafted catheter, section 6,
at 15 minutes·(scale bar= 20 µm). · 15 keV, 0 • >
20 tilt. dog 2146. .
5% HMEA/15% NVP grafted catheter, section 7,
at 15 minutes (scale bar ,; 10 µm). · 15 keV~
dog 2146.
Scanning electron micrograph of the 5% HEMA/ 15% NVP grafted catheter, section 1, at 30 minutes {scale bar = 100 µm). · 15 keV. dog
2146.
Higher magnification of Figure 32a (scale bar = 10 µm). 15 keV. dog 2146.
5% HEMA/15% NVP grafted catheter, section 2,.
150 30 h1inutes (scale liar= 33.3 µm). ·· 15 keV~
20 ·tilt. dog 2146.
5% HEMA/15% NVP grafted catheter, section 3, at 30 minutes {scale bar .. 10 µm). i5 keV. dog 2146.
Figure 32e.
xii
5% HEMA/15% NVP grafted catheter, section 4, at 30 minutes. (s;C:ale bar "' 33.3 µm). 15 keV.
dog 2146. ·
Figure 32f .. Figure 32e at 30° tilt (scale bar = 33.3 µm}.
99
15 keV. dog 2146. 99
Figure 33a. Scanning electron mi'crograph of the 5% HEMA/ 15% NVP·graftedcatheter; section.I, at 60 minutes (seal e bar ,; 100 µm). 15 keV.
dog 2146. 101
Figure 33b. ·Higher magnification of Figure 33a (scale bar =
33.3 µm). 15 keV. dog 2146. 101
Figure 33c.
Figure 33d.
Figure 34a.
Figure 34b.
Figure 34c.
Figure 34d.
Figure 35a.
5% HEMA/15% NVP grafted catheter, section 2, at 60 minutes (scale bar = 33.3 µm). 15 keV. 20° tilt. dog 2146.
5% HEMA/15% NVP grafted catheter, section 6,
at 60 minutes (scale bar= 33.3 µm). 15 keV. 0 . .
20 tilt. dog 2146.
Scanning electron micrograph of the 0% HEMA/ 20% NVP grafted catheter, .. section 1, at 15 minutes (seal e bar = 100 µm). 15 keV. dog 2146.
0% HEMA/10% NVP grafted catheter, section 2, at 15 minutes (scale bar ,; 10 µm). 15 ReV. 5° tilt. dog 2146.
0% HEMA/20% NVP grafted catheter, section 5, · at 15 minutes (scale bar = 10 µm}. 15 keV •. dog 2146.
0% HEMA/20% NVP grafted catheter, section 6, at 15 minutes (scale bar = 10 µm). 15 keV. 30° tilt. dog 2146.
Scanning electron micrograph of the 0% HEMA/ 20% NVP grafted· catheter, section 1, at 30 minutes (scale bar= lOOµm). 15 keV: dog
2146. .
Fi'gure 35b .. Higher magnificatton of Figure 35a (scale
bar =
Hi
µm). 15 keV. dog 2146.101
101
104 .
104
104
104
106
Figure 35c.
Figure 35d.
Figure 35e.
Figure 35f.
Figure 36a.
xiii
0% HEMA/20% NVP grafted catheter, section 2,
at 30 minutes (scal·e bar= 33.3 µm). · 15 keV.
20° tilt. dog 2146.
0% HEMA/20% NVP gl'lafted catheter, s·ection 6, at 30 minutes (scale bar = 33.3 µm). 15 keV. 20° tilt. dog 2146.
0% HEMA/20% NVP grafted catheter, section 7.,
at 30·minutes (s·cale bar= 10 µm). 15 keV. dog 2146. ·
0% HEMA/20% NVP grafted catheter, section 7,
at 30 minutes (scale bar= 10 µm). 15 keV~
dog 2146.
Scanning electron micrograph of the 0% HEMA/ 20% NVP grafted catheter; .section 1, at ·60 .·
minutes (scale bar= 100 µm). 15 keV. dog
2146. 106 108 108 108 . 110 Figure 36li. Higher magnification of Figure 36a (scale
bar = 10 µm) • :1!5 keV. dog 2146. 110
Figure 36c.
Figure 36d.
Figure 36e.
Figure 36f.
Figure 37a.
Figure 37b.
0% HEMA/20% NVP grafted catheter, section 2,
at 60 minutes (s~ale bar= 33.3 µm). 15 keV.
20° tilt. dog 2146. · 110
'0% HEMA/20% NVP grafted catlieter, section 5, at 60 minutes (scale liar= 3.33 µm). 15 Rev.
dog 2146. 112
0% HEMA/20% NVP grafted catheter, section 7,
at 60 minutes (scale liar = 10 ifll). · 15 l<.eV.
dog 2146. 112
0% HEMA/20% NVP grafted catheter, s~ction 8,
at 60 minutes (s:cale bar = 33.3 µm). ·· 15 keV.
20° tilt. dog 2146. 112
Scanning electron micrograph of. the 0% HEMA/ 20% NVP grafted catheter; .section 1, at 15
minutes (scale bar = 100 µm). 15 keV~ dog 2130. 115
Higher magnifkation of Figure 37a. (scale bar =
Figure 38a.
xiv
Scanning electron micrograph of.the 0%.HEMA/ 20% :NI/!' grafted catheter, sectfons 1-2, at 30 minutes (.seal e bar ,; 100 'µm). 15 keV. dog
2130.
Figure 38b. Higher magnification of Figure ·3aa (scale bar
=
115
10 µm). 15 keV. dog 2130. 115
Figure 39. Thrombogenicity index vs. criti'cal :surface tension for experimental animals ·2442, 2504, and 2297. (•) is s·ili:cone:rubber, (o) is· 15% HEMA/ 5% NVP, ( .o.
J
is 10% . HEMA/10% NVP, ( '"') is· 0% HEMA/20% NVP.Figure 40. Thrombogeni city index .vs. contact a.ngl e for experimental animals 2442, 2504, and 2297. (•) is silicone rutiber, (o) is 15%.HEMA/ 5% NVP, (..o.) is 10% HEMA/10% NV P, (A.) is 0% HEMA/20% NVP.
122
xv
LIST OF TABLES
Table 1. Review of Catheter Literature
Table 2. Chemical formulae for HEMA and NVP
Table 3. Blood compatibility testing of hydrogel' coated devices
Table 4. Hydrogel deposition thickness
Table 5. Surface energies of the liquids used in the contact angle measurements
Table 6. Results of the contact angle determinations Table 7. Compa,ri son of contact angle measurements Table 8. Experimental data for dog 2148
Table 9. Experimental data for dogs 2346 and 2130
Table 10. Analysis of cellular deposition.thickness on catheter· surfaces for dog:number 2146
Table 11. Formulations compared to the Silastic® control, method 2
Table 12. Experimental data for dogs 2442, 2504, 2232, and
2297, Method 3
Table 13. Results of the 5 minute implantation of catheters,, Method 3
pH EMA pNVP EMA SiR PE PVC PVC(l) PVC(2) H-RSD SEM TEM ESCA IPN F µm
I.
v.
RBC WBC USCI B-D 'Mr ad xvi
LIST OF SYMBOLS
poly (hydroxyethyl methacrylate) poly (n-vinyl .PYrrolidone)
ethyl methacryl ate silicone rubber polyethylene
polyvinyl chloride
polyvinyl chloride supplied by Dural Plastics, Ltd., Dural, NSW, Australia
polyvinyl chloride supplied by Portex, Ltd., Hythe, Kent, England
heparinized hydrophilic polymer scanning electron microscopy transmission electron microscopy
surface analysis with X-ray. photoel ectron
spec-troscopy ·
interpenetrating network French gauge
micrometer intravenous. red blood cell white blood cell
A division of C.R. Bard, Inc, Becton-Di~kinson
wt.
xvii
critical surface tension surface tension of a liquid surface tension·of a solid
solid-liquid interfacial surface tension edetic acid
1
INTRODUCTION
Venous catheters are commonly employed for long-term i ntravascular access. Hecker (1979) states that there is ample evidence that-thrombi form on vascular catheters, but that few studies have addressed this problem. Thrombus formation on the catheter surface can lead to cath-eter occlusion or vessel occlusion, both of which require treatment to correct the problem and placement of a new catheter at a different site. Also with thrombus formation, emboli formation and migration may lead to death. Si.nee the vascular catheter is probably the most frequently used implant in man, development of a hemocompatibl e material which may diminish the risks associated with long term catheterization is desirable.
A series of polyhydroxyethyl methacrylate (HEMA) and/or N-vinyl-2-pyrrol idone (NVP) copolymers were radiation grafted onto a silicone rubber substrate by Vale and Greer (Vale, 1980, pp,. 71-139) ·to produce materials of varied wettability, but similar texture. These .materials were found to produce acceptable results when tested in an ex-vivo arterial shunt system and consequently were chosen as candidates for testinq as catheter coatings.
In this study, the series of copolymers of HEMA and/or NVP were radiation grafted onto silicone rubber tubing to determine whether changing.the hydrophobic.character of the silicone rubber could in-crease its thromboresistance. The coated silicone·rubber catheters were tested by implantation in the venous system of the dog •.
2
LITERATURE REVIEW
Catheters
Catheters are used for a number of diagnostic monitoring 'purposes; these incl:Lide: pressure measurements within the arterial and venous systems, continuous blood sampli'ng, and angiography. Therapeutically• they are used for long-term venous infusions.
A tabulated review of selected catheter literature follows. The table emphasizes current experimental data and cl i ni.ca 1 eva 1 uations. This offers an overview of some of the recent investigations of .cathe-,ter testing and the results of these trials.
As can be seen in Table l there are some discrepencies in findings. Durst et al. (1974a), Hoar et al. (1978), and Hecker (1979) all report thrombus formation on the catheters tested, while Bottino et al .. (1979) reports that 91% of the catheters were unassociated with any clinical complications. Durst et al. (1974b) reported no difference .between siliconized and control surfaces, while Welch et al. (1974), Boros et
al. (1975), and Hecker (1979) r~ported that silicone rubber catheters
produced a favorable response. Lisback and Kollmeyer (1979) found no positive correlation between catheter roughness and resulting thrombus formation, while Bourassa et al. ( 1976) and Hecker and Edwards ( 1981) associated surface irregularities with thrombus formation.
Hydrogels
Table 1. Review of Catheter
L
iterature -Author, DateDurst, et al. 1974(a)
Durst, et al . 1974(b)
Welch, et al. 1974
Anderson, et al. 1974
Boros, et al. 1975
Kaganov, et al. 1979
Bourassa, et al. 1976
Clawson and Boros, 1978 Hoar, et al. 1978
Subjects
dogs
3 dogs
21 dogs
---20 newborn 'infants
human
human
---10 cardiac surgery
pa ti en ts
Material
Cook Teflon
Cordis Polyurethane Cook PE
USC! Dacron Red Kifa PE B-D PE
Rothene Elecath PE 5 uncoated
5 silicone ,c:oated,
&
5 neparin coated PE cathetersPE and SilasticR catheters
Teflon, PE, and Polyurethane. (15 of each)
10 SilasticR 10 PVC
HEMA Coated PE
Polyurethane and
Polyethylene Catheters
Silastic R PVC
Location, Duration
Right Femoral Artery, 30 cm of catheter Exposed to Free Flowing Blood; 1 Hour
Abdominal Aorta; 30 Minutes
External Jugular Veins; (B) on Alternative even days (10) at 10 days
(3) at 10 days, excised in situ.
SEM Study
Umbilical Artery; Silastic 24-164 hrs. PVC 35-232 hrs. Femoral, Subclavian and Jugular Veins; Duration 2-7 days.
Coronary Arteriography via femoral approach;
10-12 minutes SEM Study
Pulmonary Artery via.the external Jugular;
104 ± 6 minutes.
4
Analysis
All Catheters Proved to be Thrombogenic
No difference between control and siliconized surfaces, Heparinized showed no fibrin buildup.
Silastic-small amount of
reaction, vein remained patent. P.E. - Consistently thrombosed, little observable flow.
Al though the presence of surface irregularities are of interest, clinical significance· requires further investigation.
Silastic - g normal, 1 thrombosed PVC· - 1 normal, 9 thrombosed.
No formation of thrombi was · observed nor did the catheters cause pill ebi tis
Surface irregularities play an important role in. the initiation
of thrombosis.
Although Silastic is smoother, differences are minimal.
Table 1. {continued} Author, Date
Wilner, et al. 1978
Yonaha, 1978
Botti no, et al. 1979
Hecker, 1979
Lisback and Ko 11 meyer, 1979
Mortensen
&
Schaap; 1980
Hecker and Edwards; 1981
Subjects
Adult Dogs
Human
81 Patients
with malig-nant
diseases 48 ewes sheep
8 Adult Dogs
Adult Dogs
40 ewes sheep
Material
PE, Te fl on, Wired
PE, Polyurethane, Woven Dacron Heparinized
-Hydrophilic polymer {H-RSD}, PVC, PE,
Teflon, Silicone Rubber Silicone Elastomer
PE, PVC{l}, PVC{2}, Silicone Rubber
Argyle Umbil i ca 1 Catheters {PVC).
Commercial and
Proprietary catheters
Polyvinylchloride Tubing of Varying Surface
[image:23.568.111.495.83.617.2]Location, Duration
Femoral Artery; 30 Minutes
Central vein; 3 to 85 days
Basilic or
Cephalic vein; 5 to 171 days, 45 days mean time
Right Saphenous Vein Ri ght Femoral Artery; 9 days
Superior Vena Cava, Descend-ing thoracic aorta,
Abdominal aorta, Inferior Vena Cava; 200 ± 30
minu tes .
Ca rotid, Brachial and femoral arteries; 30 mintues
Saphenous vein and Aorta; 9 days
6
Analysis
Platelet and Fibrin Deposition.
Thrombus formation and a large number of platelets seen in PVC, PE, Teflon, 70% of SiR and 14% of H-RSD.
91% of the catheters were
un-associated with clinical complications.
Significantly more thrombosis on venous than arterial catheters . PE most thrombosed, SiR least thrombosed PVC(l) produced most renal infarction . Found no positive corelation between catheter roughness and catheter
thrombus formation .
Thrombogenic1ty index, mg/nm2
7
l:ii:omatertals by Wichterle and Lim in 1960. Their usefulness as
bio-materials is handicapped because they are generally weak.when unsupport-ed. Because of their lack of mechanical strength, techniques to incor-porate or graft the hydrogel onto a·substrate material, e.g. silicone rubber, were initiated by Predecki (1974) and Ratner and Hoffman (1974).
The monomers used to prepare hyt;lrogels are 2-hYdroxyethyl
methacry-late (HEMA) and N-vinyl-2~pyrrolidone (NVP). Their chemical formulae
are given in Table 2.
Table 2. Chemical formulae for HEMA and'NVP
Monomer Chemical Formula
HEMA CH2 =
T -
COOCH2CH20HCH3
NVP CH2 =CH -N-<J
. .
·o
I;.
The HEMA monomer can be polymerized by cobalt-60 irradiation to form a chemically stable three-dimensional gel. The gel is hydrophilic due to the presence of large numbers of hydroxyl groups within its structure.
The NVP monomer is unique because hi its uncrosslinked form it is
8
et a 1 . , 1977) .
A number of hypotheses have been offered to explain why the.
hydro-gel family may be successful biomaterials. One hypothesis is that if
a surface were similar to a plane through an aqueous saline solution, there could be no driving force for either protein adsorption or plate-let adhesion, and thus no clotting (Kronick and Rembaum, 1977). Hydro-gels With a high water content might resemble such a structure.
Another hypothesis suggests.that a proper distribution of hydro-philic (both neutral and .charged) and hydrophobic regions on a bio-materi.al interface could yield the optimum synthetic biocompatible materia.l (Nakashima et al., 1977). By polymerizing monomers of
hydro-phi 1 i c and hydrophobic character, this di stri.buti.on could be achieved. Jhon and Andrade (1973) state that the organization of water mole-cules at the interface stro.ngly influences the i nterfacia 1 free energy, which affects the ·thrombus format.ion process. The water structure in living tissues has been studied, and it is believed that some amount of water is associated with the macromolecules in the tissue. rn the hydrogels, it has been shown that there is also some water bound to the polymer. This suggests that binding of water to the polar groups in the hydrophilic material might play an important role in the inhi:bition of blood coagulation (Nakashima et al., 1977).
9
wJll not denature. Denaturation may initiate the coagulation process. The flexibi l i:ty in the' choice of monomers and solvents allows for con-trol of the surface characteristics as shown by Vale (1980). With the proper combination, the possibility of achieving a low surface energy may exist.
Andrade. (1973) argues .that zero interfacial free energy is the parameter which should be considered instead of critical ·surface ten-sion or surface free energy. By having zero interfacial free energy, the blood-solid interface would essentially be eliminated. The ability of the hydrogel system to imbibe up to 90% its own weight in water may reduce the interfaci'al energy to a minimal value.
Successful applications of hydrogel coated devices have been re-ported by a number of investigators. Selected examples are tabulated in Table 3.
Thrombosis
The primary ev.ent foll owing contact between a foreign· surface and blood is the deposition of a stable film of plasma proteins (albumins, globulins, fibrinogens, etc.). This occurs almost ins.tantly (Beugeling, 1979; Barber et al., 1978; Kroni'ck and Rembaum,1977; Fromageot et al.,
1976; Baier and Dutton, 1969). This is followed by a series of re~
10
Table 3. Blood compatibility testing of hydrogel coated devices
Investigator Hydrogel Application
Singh & Melrose HEMA on suture sutures in dog
1971 material atrium
Hoffman & Harris HEMA, NVP enhanced blood
1972 on silicone rubber compatibility
Kaganov et a 1. HEMA on catheters
1976 polyethylene
Abrahams.and HEMA coated arterial, venous
Ronel 1916 catheter and tissue
o
2 monitoringGreer & Kno 11 HEMA on arterial
1'980 Dacron velour prosthesis
Vale & Greer HEMA/NVP on ex-vivo
(Vale, 1980 $i 1 i cone rubber A-V shunts
pp. 71-139)
proteinaceous film deposition, any adsorption of an activatable factor of blood constituents must involve displacement of, or interaction with, this initially formed macromolecular monolayer (Beugling, 1979; Fromgeot et al., 1976}. Thus, the chemical constitution of this adsorbed film will determine the ultimate compatibility of the surface.
There is evidence that fibrinogen is quantitatively.the most
im-portant component of the adsorbed lrayer on both the hydrophi 1 i c .and
[image:28.567.76.528.98.402.2]11
fibrinogen during the initial time period of blood contact (Barber et al., 1979; 1978).
The adsorption of the clotting factors to 'various catheter sur-faces may be influenced by a variety of parameters·such as flow condi-tions, surface properties, catheter s·ize, morphology, duration of in-fusion and interactions with the plasma proteins and platelets. A possible explanation for surface influence is direct activation of the clotting mechanism·due to the severe conformational alterations of the deposited proteins adsorbed to high and very low energy surfaces, and
lesser modification of proteins adsorbed onto materials of mid range critical surface tensions (Wilner et al., 1978).
Surface Energy
A surface can be represented by· a surface energy, a measure of the unsatisfied bonding capacity of the surface (Figure 1). The surface energy may be a result of unsatisifed primary or secondary bonds. Surface tension is often used in describing a surface. The surface
atoms in any condensed phase are attracted towards the bulk. The atom-depleted surface is then in tension Figure 2. Solids may have minimal ·or zero surface tension. The surface tension is also referred to as
.
0
" ,~
"'
~~ n
~ ~ k
a
. 12
,
" •
le ~ • "
•
, ~ ~ \.•
UNSATISFIED SURFACE BONDSSP.TIS FI ED BULK OR INNER BONDS
Figure 1. Schematic illustration of the unsatisfied bonding capacity at a free surface. (Andrade, J97_~J.
•
•
•
•
•
•
•
•
•
• •
Figure 2. The asymmetric nature of the forces exerted on surface atoms resulting in.an attraction towards the bulk. The atom depleted surface is then in
tension. (Andrade, 1973)
-VAPOR
LIQUID
13
then described as the contact angle, and is a measure of the surface energy. This is the a.ngle used in .the Young-'Dupree Equation for sur-face energy, Ysv=y5L+yLV(cos e). If e =
o,
the liquid spreads comp·letely and the surface is said to be completely wettable. The critical sur-face tension (ye) is defined as cos e = 1 and is sometimes used in pre-dicting the compatibility of the substrate (Andrade, 1973), This value is obtained by extrapolating to cos e = 1 the Zisman plot of cos e -vs. yl. These types of measurementsare used to determine the hydrophilicity14
MATERIALS AND METHODS Techniques
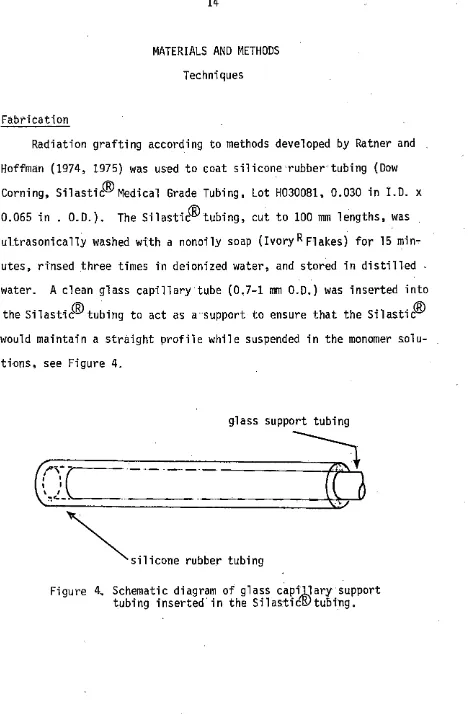
·Fabrication
Radiation grafting according to methods developed by Ratner and Hoffman (1974, 1975) was used to coat silicone rubber tubing (Dow Corning, Silastic<IDMedical Grade Tubing, Lot H030081, 0.030 in I.D. x 0.065 in . O.D.). The Silastic<IDtubing, cut to 100 mm lengths, was
ultrasonically washed with a nonoily soap (Ivory R Flakes). for 15 min~
utes, rinsed .three times in deionized water, and stored in distilled water. A clean glass capillary·tube (0.7-1 mm O.D.) was inserted into
the Silastic<ID tubing to act as a support to ensure that the Silastic® would maintain a straight profile while suspended in the monomer solu-tions, see Figure 4.
glass support tubing
---~~~
(Jc----:_-__ ·___
(D
~,,,,,,,,
,.,,,,,
'"''"'
[image:32.570.66.534.48.762.2]15
The Silastic® tubing was. suspended in pint jars which were filled with.
monomer soiutions in a solvent of 15% methanol, 65% wate.r. The five
monomer solutions used were 20% HEMA1/0% NVP2, 15% HEMA/5% NVP, 10% HEMA/ 10% NVP, 5% HEMA/15% NVP and 0% HEMA/20% NVP. The solutions were
de-.oxygenated by bubbling nitrogen gas through the solution for 30 min-utes. Then, a 0.25 Mrad dos:e from a cobalt-60 source was used for poly-merization.
After grafting, the
Silasti~Hydrogel
tubes were removed from thebulk polyiner. Adhering bulk .Polymer was removed by vigorous rubbing with a gauze pad soaked in an ethanol/water mixture, (50:50 v/v). The
tubes were then soaked in this mixture for 30 minutes to leacb·out any unreacted monomer. After soaking, .the tubes were stored in distilled water.
Blood Data
Healthy, mongrel dogs weighing 16-22 kilognams. were used for .the experiments. Data recorded for each dog included the followtrig: weight, sex, and activated coagulation time. For some dogs hematocrit and
platelet count were· also recorded. Hematocrit was determined from venous blood collected in a vacuum tube containing 5 mg EDTA (vacutain-er #6453) 3. Capillary tubes w(vacutain-ere filled with the venous blood and then
~HEMA
Purchased from Alcolac, Lot No.B8~9F9·
NVP Purchased from Monomer-Polymer & DaJak. Labs., I:nc., Lot No.
236-12.
16
centrifuged. The percent hematocrit was read using a Spiracrit Mi crohematocri t Tube Reader.
Activated Coagulation Time (ACT) was determined by allowing 2 milliliters of venous blood to fill a vacuum tube containing 12 mg of
silicious earth (Vacutainer #6522)1, incubating the tube at 37°C, and recording the time required for the first clot to appear.
2
Pl a tel et counts were made using. the Pl a tel et Unopette® method. '
-Venous blood, diluted in an ammonium oxalate solution, was used to charge a hematocytometer. Platelets in the center square were then counted and the result multiplied oy 1000 to determine the. count.
Surgery
Method 1 The dogs were fasted overnight and anesthetized wi:th sodium pentobarbital. Presurgery blood values were determined. Cut-downs were performed to expose both jugular veins. The fasci ae
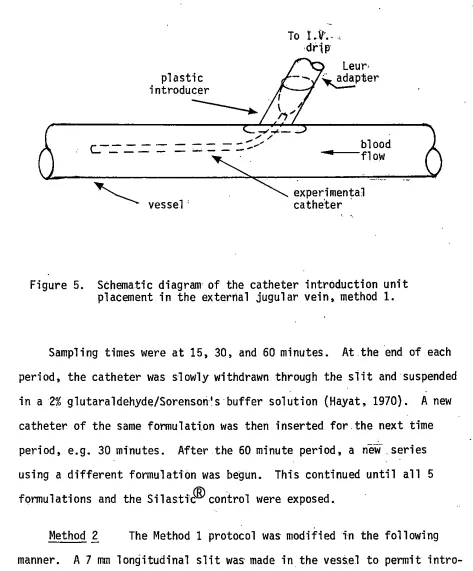
cover-ing the vessels were removed. Side btanchesnear where the catheters were to be introduced were ligated. A slit was made in the vessel· wall to introduce a plastic sheath which was. then held in place by a purse string suture pattern, (see Fi'gure 5), simi'lar to the technique described by Anderson et al. (1974). This allowed repeated access to the venous system. After catheter placement usi'ng the plasti.c s.beatli, a lactated Ringers solution drip insured that the lumen of the catheter remained patent.
plastic introducer
r---
-
"---~vessel'
17
To i.ll' ....
drip
Leur-. -- ~pter
blood ---flow
experimental catheter ·
Figure 5. Schematic diagram of the catheter introduction unit placement in the external jugular vein, method 1.
Sampling times were at 15, 30, and 60 minutes. At.the end of each period, the catheter was slowly withdrawn through the slit and suspended in a 2% glutaraldehyde/Sorensori's buffer solution (Hayat, 1970). A new catheter of the same formulati.on was then inserted for the next time period, e.g. 30 minutes. After the 60 minute period, a new .series using a different formulation was begun. This continued until all 5 formulations and the Silastic® control were exposed.
Method 2 The Method 1 protocol was modified in the following
[image:35.567.49.522.56.627.2]18
To I. V. drip
)
Slit held closed with mosquito hemostat·
....---~~~~~~~-"~~~----:
-,,
"'
-
.... ,,.C - - - .
---
----::-""'' vessel
blood· ---f)ow. ·
experimental catheter
Figure 6. Schematic diagram of the catheter placement in the external jugular vein, method 2.
[image:36.570.90.505.47.551.2]19
were again placed on the vessel, and the vessel wall was slit longi-tudinally to allow removal of the catheter. The catheter was fixed in a 2% glutaraldehyde/Sorenson's buffer soluti_on.
Both presurgery and postsurgery catheter weights were recorded to allow determination of. thrombus weight. The thrombus weight was divided by the surface area exposed to the blood to determine a thrombo-genicity index for the implants:
Thrombogeni city index
=
(post· surgery catheter ·wt).:.( presurgery catheter wt)surface area exposed
Saline-filled experimenta 1
catheter
[image:37.567.50.536.232.758.2],;r, ...
...
...
-::::---
---=====>"
~vessel
blood .flow
20
Scanni nq Electron Mi croscopY
After glutaraldehyde fixation, the samples were dehydrated in a series of ace.tone rinsks (30, 60, 75, 90, 100, 100%, 30 minutes each), sectioned in 8, !,;" sections, {See Figure 8), and critical point dried
with
co
2. After drying, the sections were then hemisected. Sections 1, 3, 5, and 7 were mounted, using colloidal graphite, on aluminum stubs to permit observation of the outer, blood contacting surfaces. Sections 2, 4, 6, and 8 were used to obtain cross-sectional thrombus0
layer information. The samples were sputter coated with 200 A of gold and examined in.a JOEL-U3 scanning electron microscope at 5-15 KeV. Micrographs made at 25x to 5000x were used to examine the homogeneity of cellular deposition, platelet numbers,, and cellular condition.
·.
'
/
•
r I I I I I
•
I1 2 3 4 5 6 7 8 external
portion of the cathete r
8 - l;i" sections
21
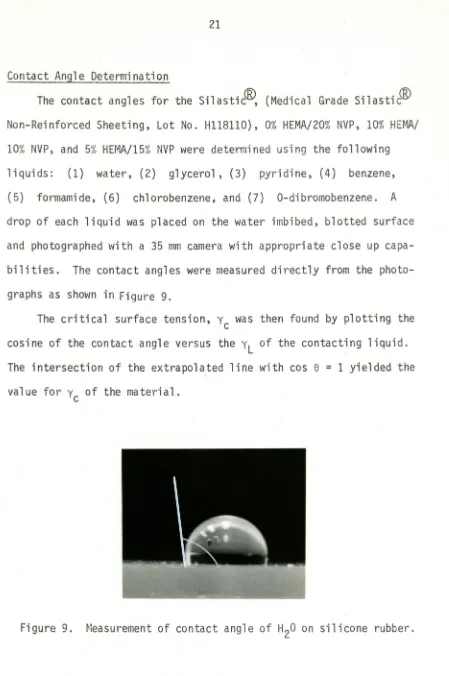
Contact Angle Determination
The contact angles for the SilasticGD, (Medical Grade Silastic(B) Non-Reinforced Sheeting, Lot No. H118110), 0% HEMA/20% NVP, 10% HEMA/ 10% NVP, and 5% HEMA/15% NVP were determined using the following
liquids: (1) water, (2) glycerol, (3) pyridine, (4) benzene,
(5) formamide, (6) chlorobenzene, and (7) 0-dibromobenzene. A drop of each liquid was placed on the water imbibed, blotted surface and photographed with a 35 mm camera with appropriate close up capa-bilities. The contact angles were measured directly from the photo-graphs as shown in Figure 9.
The critical surface tension, y c was then found by plotting the cosine of the contact angle versus the yl of the contacting liquid.
The intersection of the extrapolated line with cos
e
=
1 yielded thevalue for ye of the material.
[image:39.551.57.506.30.706.2]22
SEM Micrograph Ratings
~Jhen method 2 was used, the SEM micrographs of the hydrogel
surfaces were compared .to those of the control surface, silicone
rubber. If the response was more reactive, a plus (+) is indicated;
Figure lOa. Scanning electron micrograph of Silastic® (scale bar= 100 µm). 1!) 1<eV.
Figure !Ob. Higher magnification of Figure !Ob (scale bar = 10 µm). 15 keV.
Figure lOc. Radiation grafted 20% HEMA/0% NVP in silicone rubber (scale bar= 100 µm). 15 keV.
Figure lOe. Radiation grafted 15% HEMA/5% NVP on silicone
rubber (scale bar= 100 µm). 15 keV. ·
Figure lOf. Higher magnification of Figure lOe (scale bar = 10 µm). 15 keV.
Figure lOg. Radition grafted 103 HEMA/10% NVP on silicone rubber (scale bar= 100 µm). 15 keV.
Figure lOh. Higher magnification of Figure lOg (scale bar =
Figure lOi.
Figure lOj.
Radiation grafted 5% HEMA/15% NVP in silicone rubber (scale bar = 100 µm). 15 keV.
Higher magnification of Figure lOi (scale bar = 10 µm). 15 keV.
Figure lOk. Radiati.on grafted 0% HEMA/20% NVP on silicone rubber (scaie bar= 100 µm). 15 keV.
31
Table 5 lists the surface energies of the various liquids used in the contact angle determinations. Table 6 shows the results of the
contact angle determinations. Figure 12 shows the Zisman plot for
determining the critical surface tension from·surface energy and contact angle.
Table 5. Surface energies of the liquids used in the contact angle measurements
Liquid
Pyridine Benzene Formamide Chlorobenzene 0-dibromobenzene
y L (ergs/cm2)
72.8 63.4 38.0 28.8 58.2 37.0 42.0
Table 6. Results of the contact an~le determinations
Formulation H20 Glycerol Pyridine Benzene Formamide Chloro-benzene 0-dibromo benzene
Silastic 100.3 89 32.7 22.3 91 32 52.5
15% HEMA
58 46 a
c.s.
41c.s.
c.s.
5% NVP
c.s.
10% HEMA w N
10% NVP 70 49.8
c.s.
c.s.
33.8c.s.
c.s.
0% HEMA
20% NVP 90.5 88.5
c.s.
c.s.
89.5 25.5 55.333
30 40 50 60 70 80
1.0
•
"'
0.8
0.6 .
~~
0
~]
~ 0.4
CD VJ 0 u ~ w -I <.!:> z ct: I-u ct: I-z 0 u I>.
0. 2
-[ll.]
0
'
•
•
-0.2~
-0.4
r•1
SURFACE TENSION, yL (dynes/cm)
Figure 12. Zisman plot for determining the critical surface tension of each formulation. (•) is silicone rubber, (o) is
[image:51.564.49.528.40.680.2]Table 7. Comparison of contact angle measurements
Chemicals used in Methods 1 and 2 Chemicals used in Method 3
Silastic Lot No. HH0699 Dow Corning Lot No. Hll8110 Dow Corning
HEMA Lot No. unspecified Alcolac Lot No. B889F9 Alcol ac
NVP Lot No. unspecified Alcolac Lot No. 236-12 Alcolac
Silastic soa 1oob
15% HEMA 69a s4b 5sb -I'> w
5% NVP
10% HEMA
4ob ?Ob
10% NVP 57a
0% HEMA
88b 91b
20% NVP 87a
ilvalues reported by Vale (1980).
[image:52.783.93.743.71.462.2]35
would alter the polymerization process. A thicker layer of HEMA may mask the effect of the silicone rubber.
I
The results of the Zisman Plot for the various liydrogel coatings indicate that examination of the surface can indicate the effect of the hydrogel coating on the silicone rubber·surface. Note that while the HEMA/NVP copolymer grafts have decreased the hydrophobicity of the silicone rubber substrate, the copolymers liave raised the critical surface tension. The critical surface tension is an approximation of' the: surface free energy of the ma teri a 1.
Imp l anta ti on
A s.ed es of HEMA/NVP copolymers. were radiation grafted onto
silicone rubber tubi1ng and implanted into the venous system of the dog. Three methods of implantation and the two methods of analysis were utilized in testing the response of blood to these materials •. The results of each a.re as follows. A total of 7 dogs were used and are designated by. their Laboratory Animal Resource identifi ca ti on number.
Method 1
-The experimental.data for dog 2148 are given in Table 8. In method
1, a plastic introducer was· used to gain access to the venous system.
Al tho.ugh . this a 11 owed repeated acces·s for catheteri za ti on, . this tech-nique was inadequate ·due to formation.o.f blood clots within :the intro- . ducer. This clotting i'nterfered'wi'th tlie catheter retrteval. Also, in
36
catheter.
Table 8. Experimental data for dog 2148 Experimental Data
Method 1
Dog Number Hematocrit Platelet Count
(per mm3)
Activated.Clotting Time (sec)
Formulations Implantation Site Time (minutes) 2148 36 140,000 112 a Comp
Right and Left Jugular Veins 15, 30, and 60
a fomprehensive set - (1·) Silastic, (2) 20% HEMA/0% NVP, (2Y-i5% HEMA/5% NVP, (3) 10% HEMA/10% NVP, (4) 5% HEMA/15% NVP, (6) 0% HEMA/20% NVP.
[image:54.569.44.498.45.555.2]260
240 Section 1 Section 3 Section 5 Section 7
220
N
E ;:t 200 0
0 180
"'
N
...._
"'
.µ 160
QJ
~
"'
"'
QJ
"'
.µ
"'
140"'
~ "'O
Q_ QJ
S- w
120
"'
QJ ():)>
0
u
100 c:
·~
S-.c
80 ·~ u..
"'
1 30 60 15 30 60 15 30 60 15 30 60
(min) (min) (min) (min)
[image:56.777.71.682.64.535.2]260
240 220
"'
·E 200;1
0
0 180
LC>
"'
...
Vl
...., 160
Q)
~
Q)
....,
"'
140~ 0... 120 100 80 - -
-Section 1
...
...
...
15 30 60 (min)
Section 3
...
15 30 60 (min)
Section 5
... ...
...
15 30 60
(min)
Section -7
,.
...
[image:57.781.74.708.54.547.2]15 .30 60 (min)
Figure .14b. Graphs of platelet densities for dog 2148. Catheter coating was 5% HEMA/ 15% NVP.
w
260
240 220
"'
5.·
2000
0 180
LO
"'
...._VI 160
...,
QJ~
QJ
...,
140"'
~ C-120 100 80Section l
• •
•
15 30 60 (min)
Section 3
•
15 30 60 (min)
-Section 5
15 30 60 (min)
Sec ti on 7
...,
c:QJ
s...
QJ
..c:
"' "'
QJ~
..., ...,
·~
_,
15 30 60 (min)
Figure 14c. Graphs of platelet densities for dog 2148. Catheter coating was 0% HEMA/ 20% NVP.
.,,,
[image:58.778.66.696.57.437.2]41
densities. The reaction of the 0% HEMA/20% NVP polymers also remained stable through the course of 60 minutes; platelet densities remaining constant indicates a steady-state condition. The 5% HEMA/15% NVP and 10% HEMA/10% NVP samples have increasing and decreasing platelet densi-ties indicating a sloughing of the populations and adherence of new
platelet populations.
Method 2
The experimental data for dogs 2146 and 2130 are given in Table 9.
Table 9. Experimental data for dogs·2146 and 2130 Experimental Data
Method 2
Dog Number 2146 2130
Hematocrit 36 35
Platelet count 230,000 98,000
(per rrun3)
Activated Clotting 81 95
Time (sec)
Formulations Campa Compa,
Implantation Site Right and Left Right and Left
Jugular vei.ns Jugular veins
Time 15, 30,
&
60 15, 30, and 60(minutes)
a comprehensive set - (1) Silastic, (2) 20% HEMA/0% NVP, (2) 15% HEMA/5% NVP, (3) 10% HEMA/10% NVP, (11) 5% HEMA/15% NVP, (6) 0%
42
In method 2, the plastic introducers were deleted. This technique was successful for gaining access for multiple insertions, but also had drawbacks upon implant retrieval. A few cases were noted in which the thrombi were stripped from the catheters upon withdrawal. The samples retrieved were prepared for SEM analysis and are seen in the micrographs in Figures 15 through 38. Selected micrographs for dog 2130 a.re pre-sented when the results were not comparable· to those of dog 2146. Thrombus formation was observed on the surfaces of all catheters. The types of cells deposited and amount adherent to the surface varied.
Silastic®
Silastif8:·~·2146
SEM.micrographs of the Silastit©Figure 15a. Scanning electron micrograph of Silastic® catlieter, section 1, at 15 minutes (scale bar= 100 µm). 15 keV. dog 2146.
Figure 15b. Higher magnification of Figure 15a (scale bar =
10 JJll1). dog 2146. 15
kev.
..
Figure 15c.
Figure 15d.
Silastic® catheter, section 2, at 15 minutes (scale bar = 10 µm). 15 keV. 20° tilt. dog 2146.
Figure 16a.
Figure 16b.
Figure 16c.
Figure 16d.
Scanning electron micrograph of Silastic9D catheter, s.ection 2, at 30 minutes (scale bar= 100 µm). 15 keV. dog 2146.
Higher magnification of Figure 16a (scale bar = 10 µm). 15 keV. dog 2146.
Silastic® catheter .section 4, at 30 minutes (scale bar = 33.3 µm). 15 keV. 30° tilt. dog 2146.
Figure 17a.
Figure 17b.
Figure 17c.
Scanning electron micrograph of
Silasti~
catheter, section 1, at 60 minutes (scale bar = 100 µm). 15 keV. dog 2146.Silastic9D catheter, section 4 at 60 minutes (scalebar=20µm). 15keV. 20' tilt. dog 2146.
Figure 17d. Silastic® catheter, section 7, at 60 minutes (scale bar = 2 µm). 15 keV. dog 2146. Figure 17e. Silastic® catheter, s.ection 8, at 60 minutes
(scale bar= 33.3 µm). 15 keV. 30° tilt. dog 2146.
[image:67.785.56.726.136.550.2]51
SilastiJID, dog 2130. Comparable results using Silastic®in dog 2130 are limited to those from one 15 minute trial because the adhering thrombi were stripped from the catheters during withdrawal in the 30 and 60 minute trials. The 15 minute trial results are shown in Figures 18a through. 18c. Considerable fibrin deposition and platelet aggregation are evident. Figures 19a and 19b show the catheters from 30 minute and 60 minute trials. Although they appear to be clear of thrombus, a significant amount of material was deposited on.the surfaces. The .thrombi which were stripped from the catheter during withdrawal were retrieved from the vessel and are.shown in Figure 19c. ·
. 20% HEMA/0% NVP
20% HEMA/0% NVP, dog·2146 The response of· blood to the 20% HEMA/0% NVP formulation for dog.2146 is documented in Figures 20 thorugh 22. The 15 minute time interval micrographs (Figures 20a through 20d} show a deposition of platelets and RBCs with a fibrin net-work developing. The deposition thickness was approximately 10 µm. The 30 minute interval results (Fi'gures 21a. through 21e) show RBC deposition along with areas of leukocyte activity .. The cellular depo-sition thickness for 30 minutes varied from 3-50 µm. The 60 mi'nute tri'al response is.sho111n in Figures 22a and 22b to the heavy thrombus build up seen in Figure 22c. Th.e cellular deposition thickness for this 60 minute trial was from O - 200 µm.
Figure 18a.
Figure 18b.
Figure 18c.
Scanning electron micrograph of snastic!ID catheter, section. 1, at 15 minutes (scale'
bar= 100 µrn). 15 keV. dog 2130.
Higher magnification of Figure 18a (scale
bar = 10 µrn). 15 keV. dog 2130.
Si'lasticfID catheter, section 7, at 15 minutes
[image:70.784.38.743.128.548.2]Figure 19a.
Figure 19b.
Figure 19c.
Scanning electron microg.raphs of Silastic® catheter, section 1, at 30 minutes (scale bar = 100 µm). 15 keV. dog 2130. ·
Scanning electron micrograph of
S.ila~ticf©
catheter, .section 1, at 60 minutes (scale bar ,,; 100 µm). 15 keV. dog 2130.
Figure 20a.
Figure 20b ..
Figure 20c.
Scanning electron micrograph of the 20% HEMA/ 0% NVP grafted catheter, section 1, at 15
minutes (scale bar = 100 µm). 15 keV. dog 2146. Higher magnification of Figure 20a .(scale bar =
10 µm). 15 keV. dog 2146.
20% HEMA/0% NVP, Section 2 at 15 minutes (scale bar= 20 µm). 15 keV. dog 2146.
Figure 21a. Scanning electron micrograph of the 20% HEMA/ 0% NVP grafted catheter, section 1, at 30
minutes (scale bar
=
100 µm). 15 keV. dog 2146. Figure 21b. Higher ma0nification of Figure 21a (scale bar=
- Figure 21c.
Figure 2ld.
Figure 21e.
20% HEMA/0% NVP grafted catheter., section 2, at 30 minutes (scale bar= 33.3 um). 15 keV. dog 2146.
20% HEMA/0% NVP grafted catheter, section 4, at 30 minutes (scale bar = 33.3 um). - 15 keV. dog 2146.
20% HEMA/0% NVP grafted catheter, section 7, at 30 minutes (scale bar_= 10 um). 15 keV.
-Figure 22a.
Figure 22b.
Figure 22c.
Scanning electron micrograph of the 20% HEMA/ 0% NVP grafted catheter, section 1, at 60 . minutes (sea 1 e bar = 100 µm). 15 keV. dog
2146.
Higher magnification of Figure 22a (scale bar
=
10 µm). 15 keV. dog 2146.20% HEMA/0% NVP grafted catheter, section 2, at 60 minutes (scale bar = 0.4 mm). · 15 keV.
611
Some catheters of this formulation had grooved surfaces (see Figure 20a). These depressions served as channels which collected RBCs and possibly acted as sites for the thrombus development. The grooves produced were probably a produc~ of mechanical abrasion produced in
the catheter preparation procedure, see the Materials and Methods section. This formulation also had the thickest graft deposition, 0.09 mm.
20% HEMA/0% NVP, dog 2130 In the·15 minute trial .for dog 2130, a well-developed fibrin network was seen over all sections of the catheters. The adherent thrombus on the 30 minute trial; was lost due to stripping during withdrawal. In the 60 minute trial the catheter surface is covered with a fibrin sheath along its entire. length. Note. the abundance of leukocytes fn Figures 23a through 23c.
Figure23c is near the end of section 1 where the fibrin sheath was pulled away. The leukocytes can b_e seen adhering to the surface Cell spreading is also evident.
15% HEMA/5% NVP
15% HEMA/5% NVP, dog. 2146 · The blood response for the 15% HEMA/5% NVP formulation in dog 2146 ts.shown in Figures 4 through 6. Again the prevalent response is RBC deposition i"n a fibrin film. The 15 minute trial is shown in Figures 24a through 24h. RBC deposition appears uniform over the surface with a deposition thickness of
Fi°gure 23a.
Figure 23b.
Figure 23c.
Scanning electron micrograph of the 20% HEMA/ 0% NVP grafted catheter, section 1, at 60 minutes (scale bar = 100 µm). 15 keV.
dog 2130.
Higher magnification of Figure 23a (scale bar
=
10 µm) • 15 . keV. dog 2130.20% HEMA/0% NVP grafted catheter, section 1, at 60 minutes (scale bar ~-10 µm). Thrombus