International Journal of Innovative Technology and Exploring Engineering (IJITEE) ISSN: 2278-3075, Volume-8 Issue-10, August 2019
Geographical Information System Based Safe Path
Recommender
Aman Jain, Simran Sharma, Hrishav Kumar, Deepak Parashar
Abstract: The threat to women safety, especially on road, has become a major concern these days and the problem is increasing dramatically. Women are unsafe not just in the night but also in the day, they fear getting assaulted not only in public transport but also while travelling in cars and two-wheelers. People are harassed on road in various ways like robberies, killings, etc., but women go through even bigger traumas. Cases like, rape in moving cars, sexual assault and robberies by forcefully stopping the vehicle, teasing women on two-wheelers, etc. have increased to an alarming level. This study is an initiative to safe-guard the self-esteem of our women and prevent them from any ugly experience, while on road. It aims to find and suggest the safest path for women and tells the level of crime of the locations in that path, while travelling from one place to another. The system determines the various paths from source to destination, as entered by the user on the map interface, by calculating the danger index. This index is found on the basis of the crime rate of the grouped locations. These locations are grouped by clustering them on the basis of the crime history of that location. The app as a result suggests the best three paths in different colours (Green, Red, Yellow).
Keywords : crime against women; safest path; maps; location; clustering of locations.
I. INTRODUCTION
The problem of crime is growing every second in our country, especially in the capital. Crimes like robbery, murder, theft, kidnapping, etc have increased a lot. But cases about crimes against women, especially sexual harassment, rape and molestation have shot up dramatically. Unfortunately, there is immense insecurity and fear in the fair sex when they are out on the road, not just at night, but also in the day. This insecurity in the society has driven the idea behind this project. It enables women to see the safest route from one place to another, with the objective to make travelling for women as safe as possible. According to National Crime Records Bureau (NCRB) 2016 annual report, Delhi was rated the most jeopardous place in the country. Delhi had the worst crime rate, 182.1 crimes per 100,000 women against national average of 77.2, the capital was hence declared the most unsafe and hostile place for women all over the world. All the locations of the city are clustered on the basis of the crime records of that location. The crimes against women are given more weightage.
Revised Manuscript Received on August 05, 2019
Aman Jain, Jaypee Institute of Information Technology, Noida Sector 62, pursuing final year of B. Tech in Computer Science and Engineering.
Hrishav Kumar, Computer science student from Jaypee Institute of Information Technology (graduating in 2020)
Deepak Parashar, Computer science student from Jaypee Institute of Information Technology (graduating in 2020). Simran Sharma, Jaypee Institute of Information Technology, Noida Sector 62, pursuing 4th year of
B. Tech in Computer Science and engineering
The centre of each cluster is the index of that cluster. Each cluster is assigned a magnitude index according to the index calculated. The safest route is determined by calculating the danger index, which is the average of the index of each location in the path. The user enters the source and destination at the maps interface and the map shows maximum 3 paths, out of which, the one with the least danger index is the safest. The dataset used is really huge and nearly impossible to analyse manually. It has 80,052 records for 166 localities of Delhi and 14 features. The features are the types of crimes and values under them are the number of reports of that type of crime. This initiative is a preventive measure, promoting the idea: “Look Before You Leave”. This is presented in the form of a web-application and works with the motive to avoid any place which is prone to mishaps with women instead of getting into any problem, as precaution is always better than cure. This will keep them untouched from any ugly feeling and keep their confidence uplifted.Social development is one of the key factors that help prevent crime. In this study, unsupervised learning technique is applied on crime records to predict the type and intensity of crime. This work will be very helpful to the police department in order to decrease crime.
II. LITERATURE
Crimes are a social displeasure and cost our society heavily in various ways. There is a considerable range of references and referrals on crime analysis for detecting a safe path form one place to another. Akaash Vishal Hazarika, et al. [1] discussed about clustering of the crimes of Delhi using distinct metrics of calculating distance. The two metrics tested in this paper are Haversine and Euclidean distances. Further, K-Means algorithm has been applied on the ‘Missing Children Dataset of Delhi’ using Euclidean distance and Haversine distance and the results have been compared. Adel Ali Alkhaibari, et. al. [2] have discussed about using cluster analysis to reduce crime. Two clustering algorithms – K-means algorithm and agglomerative algorithm – are studied and applied to ‘The Stop, Question and Frisk Report Database’, City of New York Police Department, to cluster all the locations according to crime and predict the result. Thakral, et al. [3], Motivated us to compare between seven categories of clustering – Hierarchical clustering algorithm, Density based clustering algorithm, Partitioning clustering algorithm, Graph-based algorithm, Grid-based algorithm, Model-based clustering algorithm and Combinational clustering algorithm. Agarwal, et. al. [4], elaborated on k
extract useful information from a huge crime dataset and to interpret the data which assist police in identify and analyse crime patterns to reduce further occurrences of similar incidence and provide information to reduce the crime. Patchava, et. al. [5], have introduced the concept to use crime statistics in local areas and try to decipher that data to monitor for patterns. Their data contains real estate values of the areas that correspond to those crime statistics so as to make correlational assessments. Along with the crime, they got each crime and mapped it to a specific longitude and latitude. But they could not implement maps to portray this study. More so, they have used a different algorithm for clustering. Chhaya Chauhan, et. al. [6] have elaborated on the use of data mining techniques and algorithms for crime analysis. The concepts of data mining have been used to extract previously unknown useful information from unstructured data and hence devising a system to perform predictive policing.Shaohong, et. al. [7], have focussed their study on the improvising the k-means algorithm and as a result, devised the ‘improved k-harmonic means’ algorithm using a new distance measure.Yadav, et. al. [8], discussed about crime prediction by using supervised, semi-supervised and unsupervised learning methods on the crime records to predict crime more accurately. In this project, a regression model is created from the data and the crime rate is predicted for the coming few years in different states.Moni Arora, et.al. [9] have proposed an app for making travelling public transport easy and safe for people, especially women. This is achieved by using the concept of Swarm Intelligence (SI) and psychological concepts of “group dynamics”. Lalitha Saroja Thota, et. al. [10] have discussed about clustering of locations, i.e., cluster-based zoning of crime information. This is done using K-means algorithm of clustering of criminal dataset of India. Aldecimo, et. al. [11] have studied about the development of an open street map based safe zone routing system. This system recommends the optimal route to the safest zone using a map interface. This study greatly contributes to disaster preparedness and response efforts for earthquake disasters.Richard Frank, et. al. [12] have worked with a different clustering algorithm on crime data to evaluate the activity paths of offenders. This algorithm is based on K-means algorithm and modified for angles. Yunkai Liu, et. al. [13] have performed a case study addressing on unique environment or each individual. This is done by making a mobile app, which contains local crime maps and a GPS tracking component. Mugdha Sharma, et. al. [14] have proposed a tool to detect suspicious criminal activities based on Decision Tree classification technique. This is done by detecting suspicious e-mails about criminal activities by applying enhanced decision tree classifier. Carlos Caminha, Vasco Furtado [15] have studied about how movement of people influence crime in big cities and how these findings influence police allocation. This is achieved by using cluster analysis on the data.
III. PROPOSED APPROACH
The system is a dynamic web-application in which the user can find the safest path as well as report crime in any locality of Delhi.The various regions of the city as available in the dataset, are clustered using k-means algorithm on the basis of the crime rate. This crime rate is calculated by giving more weightage to some particular crimes against women. Accordingly, clusters are formed containing locations of similar type.Each cluster is assigned with a crime index ranging from 0 to 4. It is calculated, for each custer, by giving special weightage to the features – rape, sexual harassment and gang-rape. For each cluster of locations, the mean of these features is summed up and then resultant sums are sorted in increasing order. The cluster with minimum sum gets minimum crime index 0 and consequently the one with maximum sum gets maximum crime index 5. The localities along with their final crime index are stored in the database.Coming to the user-interface, the homepage of the website displays a message if the user wants to report any crime can press the globe icon at the top.If yes, the user is asked to select the locality and type of crime and report the crime by submitting the data, which is used to calculate new crime indices. Otherwise, user is asked to enter source and destination. Google maps fetches all possible routes from source to destination. The danger index of each path is calculated by taking the mean of the crime indices of all the locations in that path. Three routes with the least danger indices are displayed to the user.
IV. DATASET
The dataset used in this paper contains number of crimes recorded by the police. The original data contained 80,052 rows holding the number of crimes for every location. This was further refined and moulded according to the various locations, to form a new dataset containing 166 records, as there are 166 locations in order to make it suitable for us to use it in our implementation. The new data is labelled and it contains crime statistics of all the areas for which, we will measure the level of safety. In the data, crimes are divided into 7 categories of crime – assassination, theft, gang rape, burglary, rape, assault, sexual harassment. There are 14 columns in the dataset, namely – localities, assassination, theft, gang_rape, burglary, rape, assault_attack, harassment(sexual), crime_total, area_total, longitude, latitude, area/1000000, crime_total/area. They are used as features in the algorithm.The values under the features – theft, gang_rape, burglary, rape, assault_attack, harassment(sexual) – reperesent the number of cases reported under these crimes.
TABLE I. Sample Dataset
1 localities assa ssin at
theft Gang _rape
bur gla ry
rape Ass ault _at
hara ssm ent
Crime_tot al
Area_tota l
International Journal of Innovative Technology and Exploring Engineering (IJITEE) ISSN: 2278-3075, Volume-8 Issue-10, August 2019
2 JAFFARP UR
4 724 2 41 11 11 6 799 70481699 76.91555 28.59572 70.4817 11.33628
3 MUNDK
A
3 244 1 14 5 12 4 270 48594571 76.96085 28.67042 48.59457 5.556176
4 BABA HAR
4 414 2 70 9 18 8 512 28994346 76.96681 28.62867 28.99435 17.65862
5 NAJAFG
ARH
4 900 1 60 4 10 10 973 8473809 76.98269 28.60975 8.473809 114.8244
6 CHHAW
LA
4 485 1 65 6 16 11 575 26321658 77.99466 28.58691 26.32166 21.84513
7 KANJHA
W
3 312 3 21 6 24 12 381 35502403 77.00361 28.72582 35.5024 10.73167
8 DWARK
A NAGAR
5 109 1 16 3 13 15 162 30080760 77.01564 28.60369 30.08076 5.385502
9 BAWAN
A
8 388 4 96 20 14 9 526 40340135 77.0228 28.80659 40.34014 13.03912
10 RANHOL A
5 324 3 48 15 48 34 464 11296036 77.03599 28.65375 11.29604 41.07636
V. OVERVIEW
When the user enters the website, the crime indices are
if he/she wants to report a crime, can press the globe icon at the top.
If yes,
The user is asked to select the type and location of crime. The dataset along with this data, undergoes re-clustering. Newly computed crime indices are allocated to each cluster of localities and are stored in the database.
The user can report more crimes, if so, the same process above takes place. Otherwise, the user comes back to the homepage of website and new crime indices are fetched.If no,
The user inputs source and destination for which, routes are fetched from google maps. For every route, danger index is calculated, by taking the average of the crime indices of each location in the route.
The best three, i.e., three routes with least danger index are selected and are assigned colours (red, yellow or green), based on this index.
These routes are then displayed to the user, with some more information – danger index, total distance and total time.
VI. IMPLEMENTATION
A. Feature Scaling
From the improvised dataset, we select eight features – murder, rape, gang-rape, robbery, assault murders, sexual harassment, crime/area and theft –for the clustering purpose.As can be seen, the dataset contains features highly varying in magnitude, range and units, so feature scaling is used here, to ensure that all 8 features are in the same range, and features with high magnitude do not weigh more in distance calculations than features with low magnitude. For this purpose, Min max scaling has been used to scale the data in the range (0,1).
B. Clustering
After scaling the data, clustering of data is performed, for which, the best clustering algorithm is selected. The Silhouettes score of K-means algorithm and Agglomerative algorithm were compared.
TABLE II. Silhouettes Score of the algorithms compared Clustering
Algorithm
Silhouettes Score K-means 0.63029
Agglomerative 0.61092
To use this algorithm, the total number of clusters in which the data has to be divided should be known before-hand. On applying Elbow Method on the data, the number of clusters was deduced to be 5. After this, K-means is applied to the dataset.After assigning a cluster to each of the data points by the algorithm, the crime index of each cluster is computed, (ranging from 0 to 4), for which, the mean values of all clusters are considered. Since the concern of this study is women safety, the crime index of each cluster is calculated by giving special weightage to the features – rape, sexual harassment and gang-rape. For each cluster of locations, the mean of these features is summed up and then resultant sums are sorted in increasing order. The cluster with minimum sum gets minimum crime index 0 and consequently the one with maximum sum gets maximum crime index 5.
For example:
{3: 0, 4: 1, 1: 2, 0:3, 2: 4}
Here, cluster 3 is assigned crime index 0, cluster 4 assigned crime index 1 and so on. The localities along with their final crime index are stored in the database.
C. Crime Reporting
The top icon at the homepage, when pressed, takes the user to the crime reporting page. Here, the user is asked to select the type and location of crime. This data is added to the dataset for re-clustering to take place, by which new set of crime indices are obtained. These indices are then stored in the database.
D. Map Implementation
Google Maps API is initialised with the allocated Private Key. An inbuilt library called “Places” is loaded simultaneously. A Hash is initialised to store:
Crime Index of the localities.
Latitude and Longitude of the Localities
As the user enters the “Origin” and “Destination”, Google maps returns all the possible paths along with the coordinates of all localities in each path. These coordinates are compared with the coordinates of each locality and the crime index is plotted accordingly.
Here, a new factor called Danger Index is introduced. It is calculated as average of the crime index of each and every locality in a given path.
Sum of Magnitude of Crime in the Path Danger Index =
Total Number of Locations in the Path
Three paths with lowest danger index are selected and displayed to the user.
VII. RESULTS
[image:4.595.337.517.180.251.2]The user interacts with the system through a map interface. There are multiple paths from source to destination. Out of these, at most three paths, with least danger index are highlighted using three colours – green, yellow and red.
Table Iii. Representation Of Danger Level Of Each Path.
Colour of path Level of danger
Green Least dangerous
Yellow Second least dangerous Red Most dangerous
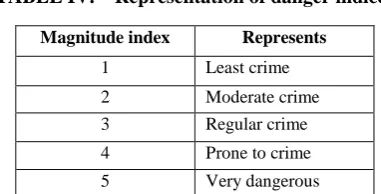
The paths have some indices denoting the magnitude index for each location in the path, which is stored in our database. These indices are:
TABLE IV. Representation of danger indices
Magnitude index Represents
1 Least crime
2 Moderate crime 3 Regular crime
4 Prone to crime
5 Very dangerous
When the user hovers on this magnitude index displayed on the map, the name of the location is displayed.The website
https://www.safepath.in/
is the practical implementationfor this research.
[image:4.595.329.520.306.403.2] [image:4.595.304.532.464.654.2]International Journal of Innovative Technology and Exploring Engineering (IJITEE) ISSN: 2278-3075, Volume-8 Issue-10, August 2019
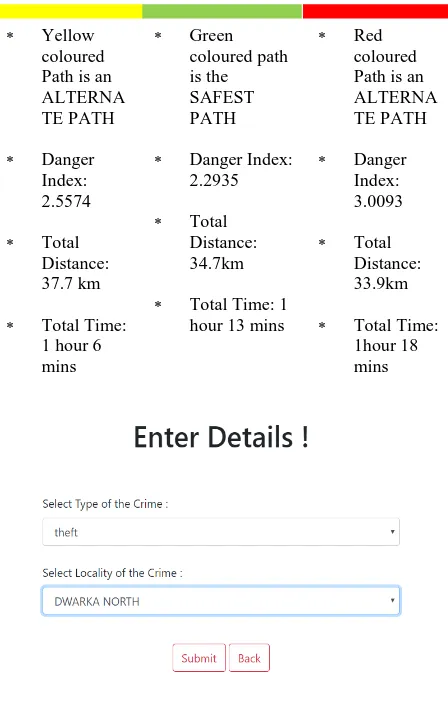
[image:5.595.44.268.58.421.2]FIGURE V. Crime reporting page asking the user to select locality and type of crime.
FIGURE VI. Webpage after submission
For example: User wants to travel from Patparganj to Rohini, the result is as follows:
FIGURE VII.
All three paths from Patparganj to Rohini
TABLE V. Detailed information of each path
The green path is always the safest path with the least danger index here, 2.6207. The yellow path is the second better option to take on road, with an index of 2.9861. While, the red path is the most dangerous one, with an index of 3.0190.If there are only two paths from one place to another, then only green and red colours are used to show the level of danger in the path.
VIII. CONCLUSION
In this paper, K-means clustering algorithm is being applied to solve the social concern of women safety. This is an attempt to deduce a solution or prevention of the hardships faced by women while travelling across the city. As the system is a web-application, it is easy to use and available to all, at any time of the day. The web-app through its map interface, eases the identification of the best path. It solves the problem of inefficacy to implement maps in the various referred papers.In addition to this, the web-app facilitates users to report crime at any location in the city at any time, which leads the system to change the result accordingly. This makes the web-application dynamic. The concept of finding and filtering out the safest path, out of all the paths possible, plays an important role to meet the safety requirements of the respondents, particularly, female respondents. This is done by predicting and clustering the crime-prone areas using the available history of crime for all the regions in Delhi.
REFERENCES
1. ORACLE+Datascience.com- https://www.datascience.com
2. Research India Publication- http://www.ripublication.com
3. Akaash Vishal Hazarika, G Jagadeesh Sai Raghu Ram, Eeti Jain, Deegoju Sushma, Anju, Cluster Analysis of Delhi Crimes using Different Distance Metrics, International Conference on Energy, Communication, Data Analytics and Soft Computing (ICECDS-2017).
4. Adel Ali Alkhaibari and Ping-Tsai Chung “Cluster Analysis for Reducing City Crime Rates”, IEEE Long Island Systems, Applications and Technology Conference (LISAT), 2017.
5. KM Archana Patel and Prateek Thakral, “The Best Clustering Algorithms in Data Mining”, International Conference on Communication and Signal Processing, April 6-8, 2016, India.
Yellow coloured Path is an ALTERNA TE PATH
Danger Index: 2.5574
Total Distance: 37.7 km
Total Time: 1 hour 6 mins
Green coloured path is the SAFEST
PATH
Danger Index: 2.2935
Total Distance: 34.7km
Total Time: 1 hour 13 mins
Red coloured
Path is an ALTERNA
TE PATH
Danger Index: 3.0093
Total Distance: 33.9km
Total Time: 1hour 18 mins
[image:5.595.48.280.472.643.2]6. Jyoti Agarwal, Renuka Nagpal and Rajni Sehgal “Crime Analysis using K-Means Clustering”, International Journal of Computer Applications (0975 – 8887) Volume 83 – No4, December 2013. 7. Bavin Ondieki and Chaitanya Patchava, “Safe Path Recommender:
Using Crime Statistics”, Stanford University.
8. Chhaya Chauhan, Smriti Sehgal, “A REVIEW: CRIME ANALYSIS USING DATA MINING TECHNIQUES AND ALGORITHMS”, 2017 International Conference on Computing, Communication and Automation (ICCCA2017).
9. Ren Jingbiao and Yin Shaohong, “Research and Improvement of Clustering Algorithm in Data Mining”, 2010 2nd International Conference on Signal Processing Systems (ICSPS).
10.Sunil Yadav, Meet Timbadia, Ajit Yadav, Rohit Vishwakarma and Nikhilesh Yadav, “Crime Pattern Detection, Analysis & Prediction”, International Conference on Electronics, Communication and Aerospace Technology ICECA 2017.
11.Moni Arora, Nisha Kaushik, Tanya Jain, Baljeet Kaur, Pooja Vashisth, Kamakshi Khosla, Suruchi Bhatia, “HumSafar: An Android App enabling a Safer Way to Travel", 2016 Fourth International Conference on PDGC.
12.LalithaSarojaThota, MohrahAlalyan, AL-OtaibiAwatif Khalid, FabihaFathima, Suresh BabuChangalasetty, Mohammad Shiblee, “Cluster based Zoning of Crime Info”.
13.Mark Robert M. Aldecimo, Marlene M. De Leon, “Development of an OpenStreetMap Based Safe zone Routing System for West Valley Fault Earthquake Disaster in the Makati Central Business District, Philippines”.
14.Richard Frank, Bryan Kinney, “How Many Ways Do Offenders Travel – Evaluating the Activity Paths of Offenders”, 2012 European Intelligence and Security Informatics Conference.
15.Yunkai Liu, Christopher Magno, “A Case Study to Apply Mobile Technology into Individual’s Local Community”, 2015 IEEE International Conference on Big Data.
16.Mugdha Sharma, “Z - CRIME: A Data Mining Tool for the Detection of Suspicious Criminal Activities Based on Decision Tree”.
17.Carlos Caminha, “Impact of Human Mobility on Police Allocation”.
AUTHORS PROFILE
Aman Jain
I am a student of Jaypee Institute of Information Technology, Noida Sector 62, pursuing final year of B. Tech in Computer Science and Engineering. Successfully published three papers on “A Novel Digital Image Encryption Method Based on RSA Algorith”, “Heart Disease Predicting Using Machine Learning Algorithms and Data Mining Technique” and “A Novel Digital Image Encryption Method Based on RSA Algorithm”. Member of IEEE, JIIT Student Branch. I have in-depth knowledge of – Machine Learning, Ruby on Rails and Android App Development. Made several successfully running projects.
Simran Sharma I am a student of Jaypee Institute of Information Technology, Noida Sector 62, pursuing 4th year of B.
Tech in Computer Science and engineering. I have knowledge of – Machine Learning with python, Android App Development and Data Structures and Algorithms – and I have made several projects using these technologies. I have worked on and successfully published three research papers namely, “A Novel Digital Image Encryption Method Based on RSA Algorith”, “Heart Disease Predicting Using Machine Learning Algorithms and Data Mining Technique” and “A Novel Digital Image Encryption Method Based on RSA Algorithm”.
Hrishav Kumar I am 4th year Computer science student from Jaypee
Institute of Information Technology (graduating in 2020). My technical expertise includes Machine Learning, Deep Learning and Data structures and algorithms and I have gained some relevant experience while working on some Machine Learning and Deep Learning projects (like Autonomous driving using CNN, Music generation using RNN, Traffic sign detection and classification, Sentiment analysis, etc). I am also active member of my
college programming hub. I have Sound understanding of algorithms and was the finalist of some of the most prestigious national coding event.