Abstract: Now a days, in each year thousands of car accidents occurs in India. Therefore, most of the automobile companies tries to give best Advanced Driver Assistance System (ADAS) to avoid the accidents. The lane detection is one of the approach to design the ADAS, if the vehicles follows the lane then there is less chance to get an accident. The detected information of lane path is used for controlling the vehicles and giving alerts to drivers. Therefore most of the researchers are attracted towards this field. But, due to the varying road conditions, it is very difficult to detect the lane. The computer vision and machine learning approaches are presents in most of the articles. In this paper, a seed method is designed for the road picture segmentation for the multi-lane detection. The sparking method is applied to the segmented image to increase the speed of computer. In this proposed method, the target grids are selected form the road lane. Distance is calculated for road and lane. Based on the distance measure, the optimal segments are chosen, following an iterative procedure. The accuracy, sensitivity and specificity are considered for the performance point of view for this paper. The calculated maximum detected accuracy is 98.89 %.
Keywords : Advanced Driver Assistance System (ADAS) , Sparking Method, Region Based Iterative Seed, Segmentation, Multilane Classification, Multilane Detection.
I. INTRODUCTION
E
very year, there are a large number of auto crashes in the India. These accidents affect numerous lives. There are a wide range of sorts of accidents, including back end crashes, side swipes, head on impacts, crashes with static obstacles, mishaps while blending or moving to another lane, and driving off the street. To avoid these types of accidents, in India it is mandatory to use seat belt, air bags, lower speed limits, stricter vehicle safety requirements have all helped to reduce the number of accidents. Most of the road accidents are occurs in traffic conditions. These types of accidents occur due to driver’s carelessness and tiredness. Drivers need to focus on different conditions, including vehicle speed and direction, the separation between vehicles, passing vehicles, and potential risky or uncommon events ahead. Also the Accidents occurs due to the who use cell phones while driving, drink and drive, etc.[2] A failure to properly control the vehicle in such a case could lead to an crash. To avoid and reduce the accidents, in last few years an intelligent on-boardRevised Manuscript Received on July 10, 2019.
Suvarna Shirke, Research Scholar, Department ofComputer Science and Engineering, Bharath Institute of Higher Education and Research, Chennai, India. Assistant Professor at Atharva College of Engineering.
Dr. R. Udayakumar, Professor and Supervisor, Department of Information Technology, Bharath Institute of Higher Education and Research, Chennai, India
system plays a very important role. These systems are said to be Advanced Driver Assistance Systems (ADASs), as they assists the driver in marked decisions, implement counteractive measures, and provide signals in possibly dangerous driving situations.
The ADAS system uses the cameras to track the lanes is used in most of the applications. This ADAS system gives notification to the driver if he is driving outside the lens unintentionally and takes automatic action to avoid wrong lane path. The secure driving tasks are relying upon the vehicle's driver. The position of a vehicle is depends on the road lane markings which helps to ADAS for the identification of vehicle. The presentation of path following depends on lighting conditions, path markings quality, and climatic components, similar to day off, and downpour. The plane of the road may perhaps vary in emergence due to neighboring trees, shadows casted by vehicles, tyre markings and construction material used [5]. Therefore it is more chances for wrong classification of getting the information of road markings. It is a challenge to identify the lane markings in the vehicle markings, also the lane marking sometimes completely disappears due to the heavy traffic conditions. It is also difficult to identify the side lanes due to the heavy traffic. Most of the papers presents the detection of ego lane instead of side lane. The traditional computer vision techniques are used for the most of lane detection in which hand-made highlights are planned by difficult procedure offline tuning.
For the machine learning and for computer vision the lane detection is the most hot topic which is applied to the intelligent vehicle systems. It is very important to self-driving vehicles to identify the particular lane. These days, computer stereo vision has been predominantly used for improving the accuracy of the lane location system. Path recognition framework is utilized in different applications, as LDW, path bobbing identification, and blind spot checking. The line and edge detection is the main task for lane detection. In recent years, lane detection is attracted by many researchers and many works had been implemented for detecting the lane. Over the most recent couple of decades, several lane recognition methodologies are presented dependent on different sensors, similar to lidar, camera, and GPS. There are three steps of the lane detection system namely lane model fitting, feature extraction and tracking. Different systems, for example, color information, learning approaches, steerable filters, etc. are used for removing lane features by preparing the input pictures. Lane detection procedures utilizing hand-crafted features are utilized for identifying conventional shapes of markings and attempt
to fit a spline or line for localizing lanes [7].
Multiple Lanes Identification using Novel
Region-Based Iterative Seed Method
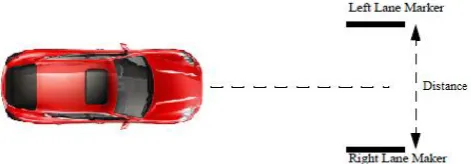
Fig. 1.Example of Lane Detection System.
Deep learning approaches have shown familiar in computer vision as well as lane detection. The CNN and Recurrent Neural Network (RNN) are developed for detecting lane boundaries [8]. This article proposes an area based iterative seed division for the segmentation for multi-path identification. In the first step the input lane image is partitioned into two parts. In the first part of partition the road image is presents and in the second part the lane image is present. And for this partition purpose the Bhattacharya distance separation is used. The minimum distance image is lane image and maximum distance image is road image. After the partition of an image the sparking method is performed for the segmentation from the multi-lane input image. Thus, the proposed region based iterative seed segmentation method performs the multi-lane detection by segmenting the lane regions that are determined optimally based on an iterative procedure. The contribution of this research work towards the multi-lane detection is developing a novel segmentation method, named region based iterative seed, for the detection of multi-lanes from the images based on an iterative approach that depends on the Bhattacharya distance, and the neighborhood distance measures.
The remainder of the work is sorted out as pursues: Section 1 is the introduction of proposed system. Segment 2 shows the proposed methods are used while designing this article. The evolutional matrices are presents in Segment 3. Section 4 shows the Experimental results of the proposed system. At last, the conclusion is presents in segment 5.
II. PROPOSEDMETHODS
This section describes the proposed multi-lane detection methods and recognition for driver assistance systems.
A. Road Lane Pictures Detection
[image:2.595.319.541.54.243.2]Road lane pictures detection is most complicated work. Most of the researchers either uses the color information or shape information to detect the road lane. It is hard to catch a great picture for street path detection which contains increasingly number of surface or highlights of the picture. Yet, in this framework we get the street path pictures with adequate sharpness and resolution, Less number of artifacts in infrared light. Additionally we get appropriate light of inside street path design. In this step the street path picture was taken by great camera with 14 megapixels, so that there was a decent circulation of pictures taken under various lighting conditions and at various edges.
Fig. 2.Different Lines on the Road.
The dataset is taken from KITTI vision benchmark dataset [29] for lane detection. This benchmark dataset has been created by Jannik Fritsch and Tobias Kuehnl from Honda Research Institute Europe GmbH. The road and lane estimation benchmark comprises of 289 training and 290 test images. The images of the road scenes fall under three categories, and they are urban unmarked, urban multiple marked lanes, and urban marked.
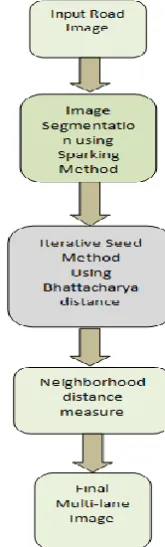
Fig. 3.Block Diagram of Proposed System.
B. Pre-processing and De-Noising
The per-processing stage is utilized to improve the various parameters an lane detection pictures, for example, contrast, intensity, signal to noise ratio, etc. Additionally it is utilized to expand the nature of a picture because of undesired distortions. This progression
[image:2.595.390.473.373.648.2]detection picture which are required for further handling. It just upgrades the nature of picture, it doesn't expands the data substance of a picture. The intensity range of an lane picture is standardized to [0 1]. This range of intensity values demonstrates the most intensity value by partitioning all intensity values. The diffusion filter process is clarified in [11] is utilized to expand the intensity and contrast of an lane picture. The signal to noise ratio of lane picture is improved with the assistance of anisotropic dispersion filter. The instrument which is utilized for this reason for existing is MatLab understand the numerous brightness transformations. The noises shot and impulse noise are rejected by the median filter. To find the rank-order information and spatial information of an iris image a weighted median (WM) filter is used and this is one of the type of median filter.
C. Image SegmentationUsing Sparking Method
Presently the caught pictures are given to the detection module. The primary work of the detection module is to segment the input caught by picture and extract out the areas and contain road lane patterns. With the help of color segmentation division method unwanted background picture can be removed. The segmentation is the first step of this lane detection system. The main aim of this method is to detect the lane borderline, layout, centers, etc. Initially, the images are subjected to the segmentation that is carried out using sparking method. Sparking process is utilized for automatic segmentation of lane images through the computation of optimal threshold.
Assume an input image I of size x × y, which undergoes sparking process [27], for making it suitable to perform the segmentation. An exponential kernel is utilized for converting the input image into n images. The exponential kernel is identified by converting the data into exponential function, as follows,
22
1 2 exp b P r e (1)
where, r is the random integer of size 1× n, and Pbbe the threshold value provided by the user. The vector e1 is normalized for obtaining the kernel function, expressed as,
n e n e e e e e e n k 1 1 1 1 1 1 1 1 ) max( ) max( 1 (2)To obtain the sparking image, the input image J is rotated to n different angles for generating n images of same size. Thus, the obtained sparking image is represented as,
255
)
,
(
)
,
(
max ) , min(n
m
n
m
e mnnew
(3) where
(
,
),
(
,
),
,
(
,
)
min
)
,
(
1 2min
m
n
x
m
n
x
m
n
x
bm
n
,)
,
(
),...,
,
(
),
,
(
max[
)
,
(
1 2max
m
n
x
m
n
x
m
n
x
bm
n
,
xe denotes threshold value, m indicates row wise pixel values, and n specifies column wise pixel values.
The optimal threshold is determined based on the sparking image. In the Neighbor Pixel (NP), each column signifies the pixel values of generated NPs and each row refer to the pixel value of the current pixel. Using this criterion, NP matrix NP [m,n] is determined in the sparking matrix with the count value. After that, each pixel value from 0 to 255 is evaluated with “S” to obtain the best threshold value. Considering T as the threshold, the matrix C and D are constructed from the NP matrix as:
T T
C (4)
(
255
T
)(
255
T
)
D
(5)The entropy of C and D is calculated for finding the information gain for threshold T as,
)] ( log ) ( [ 2 1 C p C p HC
(6)
( )log ( )
2 1 D p D p HD
(7)
Where, the probabilities of C and D are denoted as p(C) and p(D). The addition of this entropy provides the cost value of the selected threshold value as depicted in equation (8). The maximum threshold value is chosen as the optimal threshold for binarization, which produces the final segmented image.
HD
HC
S
(8)Where, S denotes the final segmented image.
D. The Region Based Iterative Seed Method for Multi-Lane Detection.
To feed the information presents in a picture, the segmentation method, namely region based iterative seed method, is utilized for the multilane identification, and this method is depicted in this section. For this procedure, at first, the input picture experiences segmentation using the sparking method.
The sparking strategy is adapted in the picture to improve the viability of the picture by utilizing an an estimated threshold value. At first, the sample of input picture experiences the sparking procedure for acquiring the segmented picture and after that, approach, named area based iterative seed, is utilized for recognizing the lanes. In the region based iterative seed
the targets are chosen in random. After that, the Bhattacharyya distance is calculated between the grids and the targets. the grids that have that have least separation are chosen and they have a place with the specific targets. The Bhattacharyya separation can be used for deciding the general closeness of the two samples and is utilized for estimating the separability of classes and is more dependable than other separation measures. This measure gives exact outcomes while evaluating the final targets. Thus, the region-based iterative seed technique identifies the patterns of roads and lanes dependent on maximum occurred cases. Here, the segmented image S is partitioned into grids of size 3×3, as represented below,
E E Ej Ev
E 1, 2,..., ,, (9)
From the partitioned grids, three grids, targets are selected, and is expressed as,
T1,T2,T3
T (10)
The Bhattacharyya distance is adapted for computing the features in a two pattern recognition problem. The grid points indicate that have belong to the relating targets are averaged to form the target at the next iteration. The technique is repeated until the last targets are determined, and after that, grouped to separate the lanes from the roads based on the nearest neighbor distance measure. The closest neighbor distance measure is simpler to implement and executes in less time. The closest neighbor distance measure is simpler to implement and executes in less time.
E. Bhattacharya Distance Separation
The distance between the grid points and the targets of the road is calculated using Bhattacharya distance [1]. It is used to measures the similarity of two probability distributions. Here, the Bhattacharya distance selects the grids among the n
number of centroids that matches best with the points and select the target with minimum distance. Calculation using Bhattacharya distance separation method is shown in figure 4.The equation which is used to calculate the Bhattacharya distance is given as
T E T E T E T E E T T E D r r T EB 2 2 2 2
2 2 2 2 2 4 1 4 1 2 4 1 ln 4 1 , (11) where, BD(E,T) is the Bhattacharya distance between the grid and the target ,
E
2
is the variance of the Eth distribution,
T
2
is the variance of the T th distribution,
E
is the mean of Eth distribution,T
is the mean of T th distribution, and rE and rT are the kurtosis of the centroid. [image:4.595.306.542.53.135.2]The distance calculated by Bhattacharya distance separation method is belongs to particular target.
Fig. 4.Distance Calculation using Bhattacharya Distance Separation Method.
F. Hough Transform
For the feature extraction used in image analysis, digital image processing, and computer vision, the Hough transform is used. The Hough transform uses the voting procedure to detect the damaged instances of items within a certain class of shapes. The Hough transform is used to find lines, different shapes like circles or ellipses and identify the positions of arbitrary shapes. A two-dimensional array algorithm is used in linear Hough transform to detect the existence of a line and it is also called an accumulator. The line can be detected by the formula
r = a cos θ + b sin θ (12) The r and θ are considering quantized values in the pair (r,θ). The (r,θ) of the line can be calculated by applying the Hough transform algorithm to its neighborhood pixel at (a,b). The result obtained from the Hough transform is two-dimensional matrix with values of quantized distance r and quantized angle θ. Each element of the new matrix obtained has a cost equal to the addition of the points or pixels that are located on the line represented by quantized parameters (r, θ). The edges of images are improved by introducing the intermediate stage by using the Hough transform. Different shapes like circle, ellipse, etc. can also be finds and represents by the set of parameters by using Hough transform [17]. For the circle, the Hough transform finds the set of radius and center. The different curves and ellipses can also found using the same method of Hough transform and expressed in the set.
G. Lane Detection
The people who use the road (Vehicle drivers, motorcyclist, and person on foot) can peruse significant information from pavement markings. The information is in three types word-marking, pictogram marking and line-marking. Word-markings are usually used to deliver a text message to drivers. Pictogram-markings are well designed ideogram and present as understandable graphics, e.g. bicycle lanes or bus lanes.
The line marking are used to control the traffic and it has different shapes and colors. The solid yellow lines indicates that the moving from the one lane to other lane is prohibited and it represents the opposite direction of two lanes. While a dashed yellow line enables drivers to switch between lanes if they need to. White lines are generally painted on a multi-path roadway, which
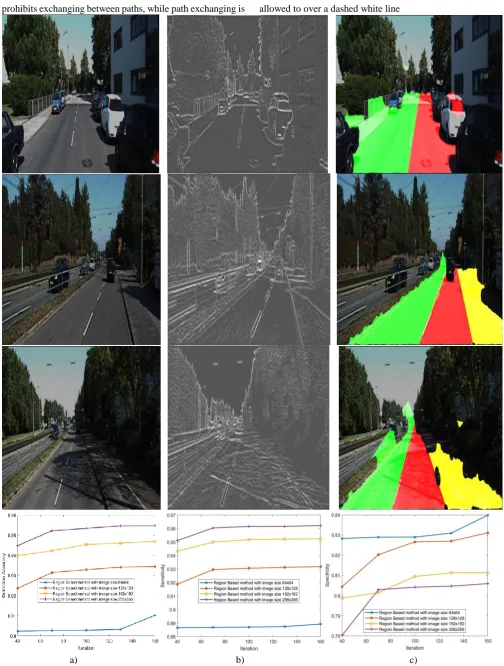
prohibits exchanging between paths, while path exchanging is allowed to over a dashed white line
[image:5.595.45.550.48.715.2]
a) b) c)
Fig. 5.Experimental results of the proposed lane detection algorithm, (a) Original image, (b) Sparking image, and (c) Overlay image detected by proposed region based iterative seed segmentation. Performance analysis of the proposed region based
III. EVOLUTION MATRICES
The metrics employed for the analysis include Specificity, Sensitivity and Detection accuracy and they are formulated as follows,
A. Detection Accuracy
It refers to the average rate of correct lanes detected by the algorithm against the ground truth information.
Fn Fp Tn Tp
Tn Tp Accuracy
(2)
where, Tp, Tn ,Fp and Fn, shows the true positive, true negative, false positive, and false negative, respectively.
B. Sensitivity
It is a measure to identify correctly detected lanes and is referred as true positive rates.
Fn Tp
Tp y Sensitivit
(3)
C. Specificity
It is a measure to identify the correctly rejected lanes and is also known as False Positive Rate (FPR).
Fp Tn
Tn y Specificit
(4)
IV. EXPERIMENTALRESULTS
The step by step execution of the proposed framework is displayed. Here observational results are characterized in this unit of proposed framework.
Figure 5 depicts the proposed lane detection approach against four sample input images from the database. Figure 4 a) shows the original images, b) shows the sparking images of c) shows the final overlay image detected based on the proposed method. Performance analysis of the proposed region based iterative seed method based on image size, (a) Detection accuracy, (b) Sensitivity, and (c) Specificity.
V. CONCLUSION
The proposed model is used for integrating the results obtained by two phases for multilane detection. In the first phase, the multi-lane detection is performed using developing a novel segmentation method, named region based iterative seed, for the detection of multi-lanes from the images based on an iterative approach that depends on the Bhattacharya distance, and the neighborhood distance measures. This paper plans a strategy for helping the Driver-assistance system for preventing the accidents. The lane detection is done by utilizing the proposed entropy based fusion model for identifying numerous lane.
Here, an iterative procedure is followed to determine the optimal targets, and finally the lanes are detected by merging the grids based on neighborhood distance measure. Besides, the performance of the proposed method is measured based
on the metrics, such as detection accuracy, sensitivity, and specificity. The simulation results of the proposed method are compared against the existing techniques, and the proposed region based iterative seed outclassed other techniques by achieving maximum detection accuracy value of 0.9889, maximum sensitivity value of 0.9916, and the specificity value of 0.8863.
REFERENCES
1. Guorong Xuan, Xiuming Zhu, PeiqiChai ,Zhenping Zhang, Yun Q. Shi, and Dongdong Fu, "Feature Selection based on the Bhattacharyya Distance ", In Proceedings on 18thInternational Conference on Pattern Recognition (ICPR'06), September 2006.
2. Jingchun Piao1, Hyunchul Shin,"Robust hypothesis generation method using binary blob analysis for multi-lane detection", IET Image Processing,vol.11, no.12, pp.1210-1218, 2017.
3. Chao Li, Hongzhe Liu, Mingli Yang, Yongrong Zheng, Hanyu Xuan,"Multi-lane Detection Based on RMFP for AutonomousVehicle Navigation in Urban Environments", vol. 31, pp. 177-196, 2016. 4. Yeongho Son, Elijah S. Lee, and DongsukKum,"Robust multi-lane
detection and tracking using adaptive thresholdand lane classification",Machine Vision and Applications, pp 1–14, October 2018.
5. Zhenqiang Ying and Ge Li,"Robust Lane Marking Detection Using Boundary-Based InversePerspective Mapping", In proceedings of International Conference on Acoustics, Speech and Signal Processing (ICASSP), March 2016.
6. Xinxin Du, and KokKiong Tan, "Comprehensive and Practical Vision System for Self-Driving Vehicle Lane-Level Localization", IEEE Transactions On Image Processing, Vol. 25, No. 5, May2016. 7. Heba Aly, Anas Basalamah, and Moustafa Youssef, "Robust and
ubiquitous smartphone-based lane detection", Pervasive and Mobile Computing, 2015.
8. Soonhong Jung, JunsicYoun, and SanghoonSull, "Efficient Lane Detection Based on Spatiotemporal Images", IEEE Transactions on Intelligent Transportation Systems, January 2015.
9. Apurba Das, Member, Siva Srinivasa Murthy, and Upendra Suddamalla, "Enhanced Algorithm of Automated Ground Truth Generation and Validation for Lane Detection System by M2BMT", IEEE Transactions on Intelligent Transportation Systems, vol. 18, no. 4, April 2017.
10. D. Geronimo, A. M. Lopez, A. D. Sappa and T. Graf, "Survey of Pedestrian Detection for Advanced Driver Assistance Systems," IEEE Transactions on Pattern Analysis and Machine Intelligence, vol. 32, no. 7, pp. 1239-1258, July 2010.
11. Yoichi Sugimoto, and Craig Sauer,"Effectiveness Estimation Method for Advanced Driver Assistance System andits Application to Collision Mitigation Brake System", In Proceedings of 19th International Technical Conference on the Enhanced Safety of Vehicles, pp. 5-148, June 2005.
12. Markus Forster, Raphael Frank, Mario Gerla, and Thomas Engel," A Cooperative Advanced Driver Assistance Systemto Mitigate Vehicular Traffic Shock Waves", In proceedings of IEEE Conference on Computer Communications, 2014.
13. Davis, L.C., ”Effect of adaptive cruise control systems on traffic flow”, Physical Review E, vol.69, no.6, pp.066110, 2004.
14. Vijay Gaikwad, and ShashikantLokhande," An Improved Lane Departure Method forAdvanced Driver Assistance System", In proceedings of International Conference on Computing, Communication and Applications (ICCCA), pp. 1-5, 2012.
15. Yan Jiang, Feng Gao, Guoyan Xu," Computer Vision-Based Multiple-Lane Detectionon Straight road and in a Curve", In proceedings of International Conference on Image Analysis and Signal Processing (IASP), pp. 114-117, 2010.
16. Amol Borkar, Monson Hayes, and Mark T. Smith,"A Novel Lane Detection System with Efficient Ground Truth Generation",IEEE transactions on intelligent transportation systems, vol. 13, no. 1, March 2012.
17. Soren Kammel, and Benjamin Pitzer," Lidar-based lane marker detection and mapping",IEEE, Intelligent Vehicles SymposiumEindhoven University of TechnologyEindhoven, June 2008. 18. Mengyin Fu, Xinyu Wang, Hongbin
Panoramic Camera", In proceedings of 11th IEEE InternationalConference on Control & Automation (ICCA), June 2014. 19. Chuanxiang Li, Bin Dai and Tao Wu, and YimingNie,"Multi-lane Detection in Urban Driving EnvironmentsEmploying Omni-directional Camera", In Proceedings of the IEEEInternational Conference on Information and Automation, July 2014.
20. MingfaLi ,Yuanyuan Li , and Min Jiang,"Lane Detection Based on Connection of Various FeatureExtraction Methods", Advances in Multimedia, pp.13, 2018.
21. Meng-Che Chuang, Jenq-Neng Hwang, and Kresimir Williams", A Feature Learning and Object Recognition framework for underwater fish images", IEEE transactions on image processing, vol.25, no.4, pp.1862-1872, 2016.
22. Yuichi Saito, Makoto Itoh, and Toshiyuki Inagaki,"Driver Assistance System with a Dual Control Scheme: Effectiveness of Identifying Driver Drowsiness and Preventing Lane Departure Accidents",IEEE transactions on human-machine systems, March 2016.
23. K. Bengler, K. Dietmayer, B. Farber, M. Maurer, C. Stiller, and H. Winner, “Three decades of driver assistance systems: Review and future perspectives,” IEEE Intelligent Transportation Systems Magazine, vol. 6, no. 4, pp. 6–22, April 2014.
24. Ju Han Yoo, Seong-Whan Lee, Sung-Kee Park, and Dong Hwan Kim, “A Robust Lane Detection Method Based on Vanishing Point Estimation Using the Relevance of Line Segments", IEEE Transactions On Intelligent Transportation Systems", vol.18, no.12, February 2017. 25. Gurveen Kaur, and Dinesh Kumar,"Lane Detection Techniques: A
Review", International Journal of Computer Applications, vol.112, no 10, pp.0975 – 8887, February 2015.
26. Seokju Lee, Junsik Kim, Jae Shin Yoon, Seunghak Shin,OleksandrBailo, Namil Kim Tae-Hee Lee, Hyun Seok Hong, Seung-Hoon Han, and In So Kweon, "VPGNet: Vanishing Point Guided Network for Lane and Road MarkingDetection and Recognition", In Proceedings of the IEEE International Conference on Computer Vision, pp. 1947-1955, 2017.
27. Alexander Rakhlin, Alexey Shvets, Vladimir Iglovikov, and Alexandr A. Kalinin, "Deep Convolutional Neural Networks for Breast Cancer Histology Image Analysis", In proceedings of International Conference on Image Analysis and Recognition ICIAR, Image Analysis and Recognition, pp. 737-744, 2018.
28. Jun Li, XueMei, Danil Prokhorov, and Dacheng Tao,"Deep Neural Network for Structural Predictionand Lane Detection in Traffic Scene",IEEE transactions on neural networks and learning systems, January 2016.
29. Mane, V.M. and Jadhav, D.V., "Holoentropy enabled-decision tree for automatic classification of diabetic retinopathy using retinal fundus images," Biomedical Engineering/Biomedizinische Technik, vol.62, no.3, pp.321-332, 2017.
30. The KITTI Vision Benchmark Suite taken from, “http://www.cvlibs.net/datasets/kitti/eval_road.php”, accessed on August 2018.
31. Umar Ozgunalp, Rui Fan, Xiao Ai, and NaimDahnoun, "Multiple Lane Detection Algorithm Based on Novel Dense Vanishing Point Estimation", IEEE Transactions On Intelligent Transportation Systems, Vol. 18, No. 3, March 2017.
AUTHORSPROFILE
Suvarna Shirke-Pansambal is the Research Scholar at Bharath Institute of Higher Education and Research, Department of Computer Science & Engineering, Chennai. She is working as an Assistant Professor in Atharva College of Engineering, Mumbai.