City, University of London Institutional Repository
Citation
:
Gkoktsi, K. & Giaralis, A. (2016). Assessment of sub-Nyquist deterministic and random data sampling techniques for operational modal analysis. In: 8th EuropeanWorkshop on Structural Health Monitoring (EWSHM 2016). (pp. 1684-1693). NDT. ISBN 9781510827936
This is the accepted version of the paper.
This version of the publication may differ from the final published
version.
Permanent repository link:
http://openaccess.city.ac.uk/19262/Link to published version
:
Copyright and reuse:
City Research Online aims to make research
outputs of City, University of London available to a wider audience.
Copyright and Moral Rights remain with the author(s) and/or copyright
holders. URLs from City Research Online may be freely distributed and
linked to.
City Research Online: http://openaccess.city.ac.uk/ [email protected]
Assessment of sub-Nyquist deterministic and random data sampling
techniques for operational modal analysis
Kyriaki GKOKTSI 1, Agathoklis GIARALIS 2
1 Dpt Civil Engineering (City University London)
Northampton Square, EC1V 0HB - London (UK) [email protected] 2 Dpt Civil Engineering (City University London)
Northampton Square, EC1V 0HB - London (UK) [email protected]
Key words: multi-coset sampling, sub-Nyquist sampling, compressive sensing, power spectrum estimation, operational modal analysis.
Abstract
In this paper the performance of a compressive sensing (CS)-based vis-à-vis a power spectrum blind sampling (PSBS)-based spectral estimation approach is numerically assessed in undertaking operational modal analysis (OMA) using the frequency domain decomposition algorithm. The examined approaches consider response acceleration measurements sampled non-uniformly in time at sub-Nyquist average rates at random time instants (the CS-based), and at deterministically defined time instants through a multi-coset sampling strategy (the PSBS-based), aiming to reduce power consumption in arrays of wireless sensors used in OMA. The modal assurance criterion is adopted to gauge the effectiveness of the two approaches using acceleration time-histories with and without additive Gaussian white noise taken from 15 equidistant recording locations on a white-noise excited linear finite element model of a simply supported beam. It is shown that for a given sub-Nyquist sampling rate the capability of the CS-based approach to extract quality estimates of mode shape depends heavily on the sparsity of the acceleration signals in the frequency domain, which is low for the noisy signals, in relation to the target sparsity level that needs to be assumed in the CS signal reconstruction step. However, the PSBS-based approach, pioneered by the authors, performs equally well and consistently better than the CS-based approach in extracting mode shapes even for noisy signals (at SNR=10db) and for a sampling rate as low as 11% the Nyquist rate. This is because the latter approach is signal agnostic and does not necessitate any target sparsity assumption. Overall, the herein reported numerical results demonstrate that the PSBS-based approach is rather advantageous in practical applications where achieving high signal compression levels is desirable irrespective of the additive noise level.
1 INTRODUCTION
2
an important development in OMA in the past 15 years (e.g., [2]). Compared to arrays of wired sensors, WSNs allow for more economical and rapid implementation of OMA. However, wireless sensors do require frequent battery replacement while the amount of data that can be reliably transmitted within WSNs is subjected to bandwidth limitations. Still, the current consensus is that WSNs will become more preferable for OMA once the above practical issues are addressed in a cost-effective and robust manner.
In this regard, recent studies [3-10] explored the potential of sub-Nyquist sampling techniques to reduce the local energy consumption in wireless sensors, associated mostly with data acquisition and wireless transmission rates. In particular, in [3-7] sub-Nyquist non-uniform random sampling techniques are first employed, based on the compressive sensing (CS) theory, to acquire structural acceleration response signals at an average rate below the Nyquist rate. Next, a signal reconstruction step is undertaken to the compressed measurements to extract the underlying signal either in the time or, if desired, in the frequency domain. Typically, these steps involve the solution of an underdetermined set of linear equations tackled by computationally intensive optimization algorithms. Further, according to the CS framework, the achieved (sub-Nyquist) average sampling rate depends strongly on the sparsity (or compressibility) of the acceleration signals in the frequency domain. In this regard, although linear response acceleration signals are inherently sparse in the frequency domain as most of their energy is clustered about their natural frequencies, additive broadband measurement noise reduces their level of sparsity and, therefore, impacts negatively the effectiveness of CS-based techniques to achieve low sampling data rates.
An alternative approach for cost-efficient OMA supporting sub-Nyquist data acquisition rates was recently developed by the authors in [8-10] which does not pose any sparsity conditions to the acquired signals (signal agnostic) and, therefore, enjoys additive measurement noise immunity. This approach couples a deterministic periodic non-uniform-in-time sampling strategy (multi-coset sampling [11]) with a power spectrum blind sampling (PSBS) technique [12], to estimate the covariance function (or equivalently the power spectrum) of the input signal treated as a wide sense stationary stochastic process. The latter consideration is in alignment with the OMA theory. Further, the PSBS step involves the solution of an overdetermined system of linear equations which can be efficiently solved.
Herein, the performance of the standard CS-based approach in [4], vis-à-vis the PSBS-based approach in [9,10] is numerically assessed by relying on the modal assurance criterion (MAC) of mode shapes obtained from the standard frequency domain decomposition (FDD) algorithm [13]. Section 2 briefly reviews the mathematical details of the two approaches. Section 3 furnishes comparative numerical results pertaining to sub-Nyquist sampled acceleration response signals under different compression and noise levels pertaining to a white-noise excited linear finite element model of a simply supported beam. Finally, Section 4 summarizes concluding remarks.
2 THEORETICAL BACKGROUND
2.1 Multi-coset data acquisition and Power Spectrum Blind Sampling (PSBS)
Let x(t) be a continuous in time t real-valued wide-sense stationary random signal (or stochastic process) characterized in the frequency domain by the power spectrum Px(ω)
band-limited to 2π/T. It is desired to sample x(t) at a rate lower than the Nyquist sampling rate 1/Τ (in Hz), and still be able to obtain a useful estimate of the power spectrum Px(ω). To this aim,
3
where N N Z/ . From each block, a number of M samples (M N ) is selected at a deterministically pre-specified position, same for all blocks, which further defines the compression ratio (CR), M N/ . In this manner, the adopted sampling strategy yields non-uniform-in-time deterministicN -periodic samples. In [14], a discrete-time model of an ideal multi-coset sampler is discussed in which the signal x[n] entersM channels and at each m
channel (m= 0,1,…, M1), x[n] is convolved with an N-length sequence cm[n] and
down-sampled byN. The selection of M samples within each N -length block is defined by the sampling pattern T
0 1 1
[n n nM ] ,
n and is governed by the filter coefficients cm[n],
where cm[n]=1 for n=-nm and cm[n]=0 for n -nm with nmi nmj,mi mj. The output of the
m-th channel of the considered sampling device is given by y km[ ]
n0 1 Nc n x kNm[ ] [ n].For the multi-sensor case treated in [9],[10], and [15] an array of D identical multi-coset samplers with M channels each is assumed and the cross-correlation function
y
, [ ] E [ ] [ ]
a b a b i j i j d d m m y y
r k y l y lk of the output signals a[ ]
i
d m
y l , b[ ]
j
d m
y l acquired from all mi, mj=
0,1,…,M1 channels of the da,db=1, 2,…, D is computed, where Ea{·} is the mathematical
expectation operator with respect to a. Further, the following relation holds [10],[11],[15]
c yayb = x xa b,
r R r (1)
where
2 (2 1)
a b
M L D
y y
r is a matrix collecting the sequences
, [ ]
a b i j
y y
r k computed within the range (support) −L ≤ k ≤ L outside which
, [ ]
a b i j
y y
r k take on negligible values,
(2 1)
a b
N L D
x x
r is a matrix collecting the input cross-correlation sequences,
[ ] E a[ ] b[ ]
a b
d d
x x x
r k x n x n k , computed for all da and db devices in the above range, and
2(2 1) (2 1)
M L N L c
R is the pattern correlation matrix populated with the cross-correlations
0
, [ ] 1 [ ] [ ]
i j i j
c c n N m m
r
c n c n , as detailed in [12]. Note that Eq. (1) defines an overdetermined system of linear equations which can be solved for ry ya b without any sparsityassumptions, provided that Rc is full column rank. The latter is satisfied for M2N .
By considering the unbiased estimator of the output cross-correlation function
1 min 0,
,
max 0,
1
ˆ [ ] a[ ] b[ ]
a b i j i j P p d d m m y y l p
r p y l y l p
P p
, (2)together with the standard discrete Fourier transform (DFT) matrix, F(2L1)N N(2L 1)N(2L1), the following estimate of the input cross-spectra sx xa b can be obtained at the discrete
frequencies 0, 2 / ((2 L1) ),N 2 ((2 L1)N1) / ((2L1) )N [12]
T 1
1 T 1(2 1)
ˆ a b L N c c c ˆa b
x x y y
s F R W R R W r . (3)
In the above equation, W is a weighting matrix, and the superscript “−1” denotes matrix inversion. The solution of Eq. (3) relies on the weighted least square criterion 2
c ˆa b arg min ˆa b a b ,
a b x x
x x r y y x x
W
r r R r in which the weighted version of the Euclidean norm is given by || a ||2WaTWa. Notably, the cross-spectra in Eq. (3) are efficiently computed directly from the cross-correlation estimator ˆ a b
y y
r obtained from the compressed measurements of the D sampling devices. This is achieved by exploiting the sparse structure of Rc as detailed in [12].
2.2 Compressive Sensing (CS) and signal reconstruction
4 domain and is written as
1
[ ] N N [ ]
x n F u n , (4) where FN N1 N N is the inverse discrete Fourier transform (IDFT) matrix, and
u[n] Nare the Fourier coefficients of x[n] having only K non-zero entries, with K N.
The theory of compressive sensing (CS) [16,17] asserts that all information contained in the
K-sparse signal x[n] can be retained by taking only M K log(N) non-uniform random measurements y[m] M , where K<M N, and M/N is the CR. Mathematically, this can be achieved by employing a random measurement matrix Φ M N that satisfies, with high probability, the so-called restricted isometry property (RIP) [18], i.e., an orthonormality condition that enables exact recovery of the K-sparse signal x[n] from only M measurements
y[m]. In this work, a random Φ matrix populated with incoherent measurements of zero-one entries that randomly selects M rows of the orthonormal IDFT matrix in Eq. (4) is assumed. In this manner, a partial Fourier matrix FM N1 M N that satisfies the RIP with high probability and I readily implemented in practical CS applications is defined (see also [4] and the reference therein). To this end, the compressed signal y[m] is given by
1 1
[ ] N N [ ] M N [ ]
y m ΦF u n F u n . (5) It is desired to solve the above equation for u[n], that is, to retrieve the non-zero Fourier coefficients of x[n] from the compressed measurement y[m] (the so-called signal reconstruction problem). However, Eq. (5) represents an underdetermined system of linear equations and solving for u[n] is generally an ill-posed problem. To address this issue, numerous algorithms have been proposed within the CS framework (e.g. [19] and the references therein) to obtain a unique solution to the underdetermined problem of Eq.(5) by relying on the signal sparsity property. Herein, the CoSaMP algorithm in [19] is adopted for the task taking an iterative matching pursuit approach which is computationally less involved compared to other signal reconstruction algorithms [18], while it guarantees that a pre-specified (target) level of sparsity KT is achieved in the output spectrum u[n]. CoSaMP takes
as input the compressed observation vector y[m] in Eq. (5), the partial Fourier measurement matrix FM N1 , a target sparsity level KT which should be less than M/3, (i.e., KT<M/3), and a
tolerance parameter η, to generate a KT-sparse estimate u nˆ[ ]that satisfies the condition
2 1
1 ˆ
[ ] [ ] max , [ ] [ ]
T K T
u n u n C u n u n K
. (6)
In the last equation
T
K
u n is the optimal KT-sparse approximation of the K-sparse u[n], C is
the restricted isometry constant, and a
p
is the p norm of a. In each iteration, CoSaMP aims to capture some part of the energy of the target signal by solving a least squares problem involving the pseudoinverse of the measurement matrix appearing in Eq. (5) under the assumption of a small C constant value [4,19]. The extracted energy is subtracted from the target signal and in the next iteration the residual signal becomes the target signal. This iterative process continues until any of three stoppage criteria is met: (i) the relative residual signal energy between two iterations is less than the tolerance η, or (ii) the total residual energy in the last iteration is smaller than η, or (iii) a predefined maximum number of iterations is reached. Note that the accuracy of the CoSaMP algorithm is significantly influenced by the adopted target sparsity level KTwhich should ideally be close to the true K
5
noisy signals x[n]. In this respect, the choice of KT is not a trivial task. Choosing KT>K results
in unnecessarily high computational cost, as the dimensions of the (full) matrix that needs to be inverted in each iteration will be unnecessarily large. At the other end, choosing KT<K
results in poor signal approximation. Further discussion on the influence of the adopted KT is
included in a following section in view of numerical results pertaining to the quality of the achieved OMA. Nevertheless, it is important to appreciate that the previously reviewed PSBS-based spectral estimation approach does not require any sparsity assumption (i.e., is signal agnostic), and this makes it quite advantageous from a practical viewpoint.
The above CS-based data acquisition and signal reconstruction approach is herein applied to an array of D identical CS-based samplers that compressively sense the input signals xd[n],
d=1,2,…,D and wirelessly transmit yd
m compressed measurements to a base station. Next, signal reconstruction is undertaken to derive D signal estimates xˆd
n at Nyquist rate following the steps taken in [4]. Finally, the estimate sx xˆ ˆa b of the power spectrum densitymatrix of all xd[n] signals is obtained using the standard Welch’s periodogram collecting all
possible auto and cross spectral density functions from the D sensors.
3 COMPARATIVE NUMERICAL ASSESSMENT AND DISCUSSION
3.1 Structural response acceleration signals
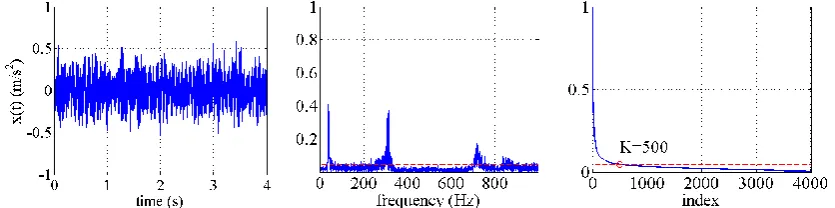
[image:6.595.92.510.610.714.2]To assess the performance of the PSBS-based spectral estimation approach reviewed in sub-section 2.1 vis-à-vis the CS-based approach discussed in sub-section 2.2 for OMA, simulated response acceleration signals from a white noise excited linear finite element model (FEM) of a steel simply supported beam are considered. The considered beam is IPE300-profiled with 5m length and flexural rigidity EI=1678103 kNm2 assumed to be instrumented with an array of D=15 sensors measuring vertical acceleration and being evenly distributed along the length of the beam (see also [10]). The considered FEM is base-excited by a low-amplitude Gaussian white noise of 4s duration with time discretization step 0.0005s applied along the gravitational axis. Assuming a critical damping ratio of 1% for all modes of vibration, linear response history analysis is conducted and the 15 generated vertical acceleration response signals are recorded at the Nyquist sampling rate of 2000Hz (i.e., 8000 “Nyquist samples” per signal). Gaussian white noise is added to the obtained measurements at signal-to-noise ratios (SNRs): 1020dB (i.e., practically noiseless case), and 10dB (noisy case). Figure 1 plots a typical noisy acceleration response signal with SNR=10dB in time (left panel), its single-sided magnitude Fourier spectrum (middle panel) normalized to its peak value, as well as the normalized magnitude Fourier coefficients sorted in descending order (right panel).
6
Clearly, three dominant harmonics are included in the signal, corresponding to the three first flexural mode shapes of the beam, on top of broadband noise. By inspection (i.e., heuristically), a threshold is set in Fig. 1 (red broken line) to indicate that the significant signal energy/information is captured from about 500 Fourier coefficients and thus, a sparsity level of K=500 may be assumed for the noisy signals herein considered (see also [4]).
3.2 Multi-coset and random sub-Nyquist sampling and power spectral estimation
The linear noisy and noiseless response acceleration response signals generated as detailed in the previous sub-section are compressively sampled at two different CRs of approximately 31% and 11% (i.e., 69% and 89% fewer samples compared to the Nyquist samples) using the deterministic multi-coset sampling scheme of sub-section 2.1 and the random CS-based sampling scheme of section 2.2. Table 1 reports the parameters considered for the sub-Nyquist sampling. For example, for CR= 31% the multi-coset samplers comprise M =5 channels and each channel samples uniformly in time with a rate N=16 times slower than the Nyquist rate. The adopted sampling pattern is n=[0 1 2 5 8]T. In this respect, only
M=2500 samples are acquired by each sensor out of the N=8000 Nyquist samples. This exact pair of M, N values (i.e., M=2500, N=8000) is further used to define the partial IDFT matrix
1 2500 8000
M N
F in Eq. (5) in the CS-based approach. Further, the accuracy of the CS-based approach is assessed for various assumed (target) sparsity levels KT in therange of [50, 500].
The case of CR=11% is also examined and the adopted parameters required in applying the two different sub-Nyquist approaches are defined in the same manner as above (see Table 1).
Approach Compression ratio CR 31% 11%
Multi-coset sampling
& PSBS
Number of channels M 5 14
Downsampling N 16 128
Sampling pattern n [0,1,2,5,8]T [0,1,2,6,8,20,29, 38,47,50,53,60,63]T
CS & CoSaMP
Nyquist samples N 8000 8000 Sub-Nyquist samples M 2500 875 Target Sparsity Level KT 50-500 50-290
Table 1: Parameters used within the multi-coset PSBS and the CS-based FDD approaches for two compression ratios at 31% and 11% respectively.
Next, power spectral density matrices collecting estimates of the auto-and cross- power spectra of the acceleration signals from the D=15 sensors are obtained from the two considered methods as detailed in sections 2.1 and 2.2. Specifically, for the CS-based approach, the power spectral density functions are derived in three steps (see also [4]): (i) compressive sensing using the matrix in Eq(5); (ii) signal reconstruction using the CoSaMP algorithm in Eq.(6) and assuming a target sparsity KT; and (iii) power spectrum estimation
using the standard Welch periodogram. The PSBS-based method estimates the same power spectral density functions in three different steps: (i) multi-coset sampling; (ii) Cross-correlation estimation applied to the compressed measurements in Eq. (2); and (iii) power spectrum estimation using Eq.(3), without assuming any target sparsity.
3.3 Operational Modal Analysis using the Frequency Domain Decomposition algorithm
7
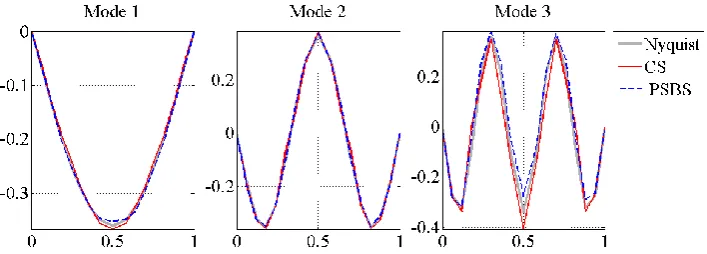
measurements as described in the previous sub-section to extract the mode shapes of the considered beam. For illustration, in Fig. 2 all the three excited mode shapes derived from the noisy measurements (SNR=10dB) from the two different approaches (CS-based for KT=290
and PSBS-based) are shown for CR=31%. In Fig.3 only the first two mode shapes are shown for CR=11% as the third one is not detectable from the noisy signals sampled at this low CR
[image:8.595.125.479.270.397.2]corresponding to almost 90% less than the Nyquist measurements. On all the above plots, the mode shapes extracted by application of the FDD to the Nyquist measurements (conventional approach) are also superposed for comparison. It is observed, from a qualitative viewpoint, that both sub-Nyquist approaches perform well for CR=31% in capturing the shape and relative amplitude of the modal deflected shapes compared to the conventional approach, with the PSBS-based method being slightly more accurate. For the higher CR=11%, the PSBS- based method clearly outperforms the CS-based method.
[image:8.595.175.431.441.564.2]Figure 2: Mode shape estimation for CR=31%, SNR=10dB and target reconstruction sparsity KT=290 in the CS-based approach.
Figure 3: Mode shape estimation for CR=11%, SNR=10dB and target reconstruction sparsity KT=290 in the CS-based approach.
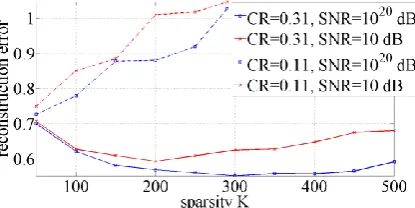
To quantify the level of accuracy in the estimated mode shapes, the well-known modal assurance criterion (MAC) [13] is further employed, which measures the level of similarity between mode shape vectors estimated using all the Nyquist samples with modes estimated from the sub-Nyquist samples. A value of MAC=1 implies perfect matching. Focus is given on quantifying the performance of the CS-based approach to extract mode shapes for different assumed (pre-specified) values of the target reconstruction sparsity KT. Specifically,
Figs. 3 and 4 plot the MAC for CR=31% and CR=11%, respectively, for mode shapes extracted by noiseless (SNR=1020 dB) and noisy signals (SNR=10 dB) as a function of the
assumed target sparsity KT. It is confirmed that in all cases the PSBS-based approach
8
approach for the same number of acquired (and wirelessly transmitted) sub-Nyquist measurements. It is also noted that the MAC values of the PSBS-approach are the same for all KT values since this approach does not require to make any sparsity assumption (i.e., it is
signal agnostic). Still, the CS-based approach does perform quite well at least for CR=31% even though its performance clearly depends on the assumed KT value. Importantly, for
CR=31% higher accuracy is achieved for higher KT values at the cost of higher computational
cost in the signal reconstruction step, however, this is not the case for CR=11% and for the second mode shape where the accuracy deteriorates with increase of KT. This is because at
[image:9.595.84.533.288.383.2]this high compression level (i.e., small number of sub-Nyquist measurements y in Eq. (5)) the CoSaMP algorithm becomes unstable, as shown in Fig. 5, since the underlying conditions are, purposely (i.e., for the sake of comparison), violated. In particular, note that for CR=11% only M=875 sub-Nyquist samples are acquired; fewer from the requirement of M3K, where a representative (but heuristic) value of K=500 can be taken for the noisy signals (see Fig.1).
[image:9.595.124.483.421.516.2]Figure 4: MAC versus reconstruction sparsity level KT, obtained from the two considered approaches, PSBS-based and CS-PSBS-based FDD, for CR= 31% and SNR={1020,10}dB.
Figure 5: MAC versus reconstruction sparsity level KT, obtained from the two considered approaches, PSBS-based and CS-PSBS-based FDD, for CR= 11% and SNR={1020,10}dB.
Figure 5: Signal reconstruction error of CoSaMP algorithm with respect to the target sparsity level K.
[image:9.595.198.406.563.667.2]9
4 CONCLUDING REMARKS
The performance of two recently proposed in the literature spectral estimation approaches, namely a (CS)-based approach and a (PSBS)-based approach, was numerically assessed in extracting mode shapes from noisy response acceleration signals within an OMA framework using the FDD algorithm. To this aim, response acceleration signals with and without additive Gaussian white noise taken from 15 equidistant recording locations on a white-noise excited linear finite element model of a simply supported beam were considered. The MAC was adopted to gauge the effectiveness of the two approaches for the task at hand. Both the examined approaches consider response acceleration measurements sampled non-uniformly in time at sub-Nyquist rates. It was theoretically discussed and numerically verified that for a given sub-Nyquist sampling rate the capability of the CS-based approach to extract faithful estimates of the mode shapes depends heavily on the actual sparsity of the acceleration signals in the frequency domain and on the target sparsity level that needs to be assumed in the CS signal reconstruction step. This verification has been accomplished by considering two different compression ratios (i.e., sub-Nyquist sampling rates) of the same signals and by purposely violating the minimum required target sparsity constraint imposed by the adopted CS reconstruction algorithm for the high compression level and for the noisy acceleration signals. The latter signals are not significantly sparse (and, therefore, compressible in the CS framework) since they attain non-negligible magnitude Fourier coefficients across the full frequency spectrum and not only in the vicinity of the structural natural frequencies. More importantly, it was numerically shown that the PSBS-based approach which treats response acceleration signals as stochastic processes and estimates the power spectral density matrix in a computationally efficient manner without imposing any sparsity conditions, performs equally well and consistently better than the CS-based approach in extracting mode shapes for all the herein considered cases; even for the noisy signals (SNR=10db) and for sampling rate as low as 11% the Nyquist rate. Further, the fact that it does not necessitate any target sparsity assumption being genuinely signal agnostic renders the PSBS-based approach rather advantageous in practical applications where achieving high signal compression levels is desirable irrespective of the additive noise level to address energy consumption issues and wireless bandwidth transmission limitations.
AKNOWLEDGEMENTS
This work has been funded by EPSRC in UK, under grant No EP/K023047/1. The first author further acknowledges the support of City University London through a PhD studentship.
REFERENCES
[1] E. Reynders, System Identification Methods for (Operational) Modal Analysis: Review and Comparison. Arch. Comput. Methods Eng., 19, (1), 51–124, 2012.
[2] J. P. Lynch, An overview of wireless structural health monitoring for civil structures. Philos. Trans. R. Soc. A Math. Phys. Eng. Sci.365, (1851), 345–372, 2007.
10
wireless sensor network to achieve energy efficiency in long-term monitoring applications. Smart Mater. Struct., 23, (8), 085014, 2014.
[5] J. Y. Park, M. B. Wakin, A. C. Gilbert, Modal analysis with compressive measurements. IEEE Trans. Signal Process., 62, (7), 1655–1670, 2014.
[6] J. Y. Park, M. B. Wakin, A. C. Gilbert, Sampling considerations for modal analysis with damping. Proceedings of SPIE - The International Society for Optical Engineering, 9435, 94350U, 2015.
[7] Y. Yang, S. Nagarajaiah, Output-only modal identification by compressed sensing: Non-uniform low-rate random sampling. Mech. Syst. Signal Process., 56–57, 15–34, 2015.
[8] B. TauSiesakul, K. Gkoktsi, A. Giaralis, Compressive power spectrum sensing for vibration-based output-only system identification of structural systems in the presence of noise. Proc. SPIE 9484, Compressive Sensing IV, doi:10.1117/12.2177162, 2015.
[9] K. Gkoktsi, B. TauSiesakul, A. Giaralis, Multi-channel sub-Nyquist cross-Spectral Estimation for Modal Analysis of Vibrating Structures. Proc. IEEE International Conference on Systems, Signals and Image Processing, doi:10.1109/IWSSIP.2015.7314232, 2015.
[10]K. Gkoktsi, A. Giaralis, B. TauSiesakul, Sub-Nyquist signal-reconstruction-free operational modal analysis and damage detection in the presence of noise. Proc. SPIE 9803, Sensors and Smart Structures Technologies, doi:10.1117/12.2219194, 2016.
[11]M. Mishali, Y. C. Eldar, Blind Multiband Signal Reconstruction: Compressed Sensing for Analog Signals. IEEE Trans. Signal Process., 57, (3), 993–1009, 2009.
[12]B. Tausiesakul, N. Gonzalez-Prelcic, Power Spectrum Blind Sampling Using Minimum Mean Square Error and Weighted Least Squares. 47th Asilomar Conference Signals, Systems and Computers (ACSSC), 153–157, 2013.
[13]R. Brincker,C. E. Ventura. Introduction to Operational Modal Analysis, Chichester, UK: John Wiley & Sons, Ltd, ISBN: 9781118535141, (2015).
[14]D. D. Ariananda and G. Leus, Compressive Wideband Power Spectrum Estimation. Signal Process. IEEE Trans., 60, (9), 4775–4789, 2012.
[15]D. D. Ariananda, G. Leus, Cooperative compressive wideband power spectrum sensing. 2012 Conference Record of the Forty Sixth Asilomar Conference on Signals, Systems and Computers (ASILOMAR), 303–307, 2012.
[16]E. J. Candès, J. Romberg, T. Tao, Robust uncertainty principles: Exact signal reconstruction from highly incomplete frequency information. IEEE Trans. Inf. Theory, 52, (2), 489–509, 2006. [17]D. L. Donoho, Compressed sensing. IEEE Trans. Inf. Theory, 52, (4), 1289–1306, 2006.
[18]E. J. Candès, The restricted isometry property and its implications for compressed sensing. Comptes Rendus Math., 346, (9–10), 589–592, 2008.