Title: Covert Contrast and Covert Error in Persistent Velar Fronting
Joanne Cleland1, James M. Scobbie2, Cornelia Heyde2, Zoe Roxburgh2 and Alan A. Wrench3 1
Psychological Sciences and Health, University of Strathclyde, Glasgow, UK 2
Clinical Audiology, Speech & Language Research Centre, Queen Margaret University, Musselburgh, UK
3
Abstract
Acoustic and articulatory studies demonstrate covert contrast in perceptually neutralised phonemic contrasts in both typical children and children with speech disorders. These covert contrasts are thought to be relatively common and symptomatic of phonetic speech disorders. However, clinicians in the speech therapy clinic have had no easy way of identifying this covertness. This study uses ultrasound tongue imaging to compare tongue contours for /t/ and /k/ in seven children with persistent velar fronting. We present a method of overlaying tongue contours to identify covert contrast at the articulatory level. Results show that all seven children, contrary to expectations, produced both /t/ and /k/ with near-identical tongue shapes showing no evidence of covert contrast. However, further analysis of one of the participants showed highly variable tongue shapes for /t/ and /k/, including retroflex productions of both. Although not phonologically conditioned, this covert error is evidence of speech disorder at the phonetic level.
Keywords
Introduction
During speech acquisition it is common for children to make apparent substitutions of one speech sound for another present in the target language. This collapse of category, or neutralisation, results in homophony where there ought not to be, and is taken to suggest that children have a difficulty at the phonological level. However, increasing evidence in the literature suggests that these contrasts are not always completely neutralised, but merely difficult to perceive by the adult listener who tends to categorise children’s productions into their own phonological categories (Liberman, Harris, Hoffman, & Griffith, 1957). These covert contrasts might be a relatively common phenomenon in both typical children’s speech acquisition and in children described as phonologically delayed/disordered. Munson, Edwards, Schellinger, Beckman, and Meyer (2010, p248) go as far as to say that covert contrast “might be the rule, rather than the exception” with strong evidence that the broad phonetic transcriptions carried out by clinicians mask the subtle phonetic difference between phonemes transcribed and analysed as neutralised.
Covert contrast may in fact reveal a pervasive effect of overly-broad transcription (Oller & Eilers, 1975) in the clinic driven by either expectation or a focus on quick and subjective binary correct/incorrect judgements for scoring purposes. However, the real theoretical importance lies first in whether the typical, delayed and disordered development of children’s speech involves clear categorical phonological substitutions at an abstract representational level preceding planning or not (Scobbie, Gibbon, Hardcastle & Fletcher, 2000). Alternatively, phonological distinctiveness could be compromised but not wholly neutralised, or clearly distinct mental representations might be phonetically planned or executed in such a way that the phonologically distinct speech events which are produced cannot be (easily) distinguished by a listener. Locating a disorder at the right place in the speech production chain is important for diagnosis and treatment.
that in the 1980s this term was common place for a variety of speech sound disorders) and no overt voicing distinction. Similarly, other studies have found differences at the acoustic level for place of articulation (e.g. Forrest, Weismer, Hodge, Dinnsen, and Elbert, 1990). When evidence is found for covert contrast, the implication is that the child has separate phonological representations for each of the phonemes in question, rather than a collapse of categories. The child’s speech sound disorder is therefore at the phonetic or articulatory level (Gibbon, 1999). This, then, has clear implications for the type of intervention approach clinicians should select, and yet the research on covert contrast has had little impact on the decisions made in the speech therapy clinic (Munson et al., 2010). This must in part be because, by very definition, covert contrast is difficult for the clinician to identify and while acoustic analysis methods are reported in the literature, there is no software package available for clinicians to use to automatically identify covert contrasts in the acoustic signal because phonemes do not have a single easily identifiable acoustic correlate (Munson et al., 2010).
Therefore, where a covert difference in tongue shape or position is detected this can be remediated using a technique that aims to change these very dimensions.
Covert Error
In addition to covert contrast, but equally important for addressing the precise phonological or phonetic nature of a disorder, a number of speech errors which defy broad phonetic transcription have also been reported in the literature, again, mainly in EPG studies. Gibbon (1990) has been influential in her description of “undifferentiated lingual gestures” where the EPG patterns of “phonologically disordered” children reveal difficulty differentiating coronal and dorsal tongue gestures, again pointing towards an issue with the precise motor control required for intelligible speech. A number of other types of errors revealed by EPG are reviewed by Hardcastle and Gibbon (2005), including misdirected articulatory gestures and double articulations where they ought not to exist. While these covert errors may not be contrastive, they are nonetheless important diagnostically because again they provide evidence for motoric difficulties, perhaps suggesting different therapy approaches might be required.
Ultrasound tongue imaging.
most of the surface of the tongue in either the mid-sagittal or coronal plane. In both views, the imageable area is constrained by shadows from bone, with the tongue tip in particular being susceptible to a shadow from the mandible. Unlike EPG, the speaker is not required to have any custom-made appliances and as such it is potentially a quicker and easier way to identify covert contrast (McAllister Byun et al., 2015) which might translate to the clinic if simple analysis methods can be found. The purpose this this study was therefore to contribute one such analysis method so that ultrasound can be used for diagnosis of specific types of speech disorders (Bressmann et al., 2011) and remediation of the same errors (Cleland et al., 2015).
Velar Fronting
Figure 1: Typical ultrasound images for /t/ (left) and /k/ (right). Tongue tip to the right.
be adequate for detecting small changes in, for example, retraction of the tongue root. For this, overlaying of multiple ultrasound images and stabilisation of the probe becomes important.
In this study an objective method of analysing tongue shapes is adopted in preference to visual inspection in order to improve the likelihood of detecting covert contrast and covert errors. Using AAA software (Articulate Instruments, 2015) tongue surface splines are overlaid for visual comparison, as might be employed in the clinical context, and quantified by statistical analysis of radial differences in tongue shape to confirm or refute subjective impressions from visual inspection.
Purpose and hypotheses
The purpose of the current study was to determine whether articulatory evidence of covert contrast could be found in children with persistent velar fronting and to demonstrate a simple method of comparing tongue shapes that might be useable in the field in the future. We hypothesised that covert contrast would be indicated by a statistically significant difference in tongue shapes for /k/ and /t/ attempts despite perceptual neutralisation of these phonemes. In addition to covert contrast, we sought to determine whether children with persistent velar fronting display other imperceptible error types during attempts at /k/ and /t/, which although perhaps not contrastive, might also point towards a phonetic or motor basis as the cause of the speech disorder. This detailed phonetic analysis was carried out on one child with a history of severe SSD.
Method
Two studies were carried out. Firstly, a group study of velar fronting in seven children focusing on the shape and location of the midline tongue surface at the burst of /t/ and /k/ minimal pairs, and secondly a more exploratory case study of one of the children- 01F_Ultraphonix, or “Rachel”.
Participants
Data comes from seven participants aged 6;0 to 10;11 with persistent primary SSDs and highly consistent velar fronting in all word positions from the perspective of transcription/percentage velars correct and their clinical referral. The children were participants in two different intervention studies: the Ultrax Project (http://www.ultrax-speech.org/) and the UltraPhonix project (http://www.qmu.ac.uk/casl/ultraphonix/default.htm). All the children went on to have ultrasound visual biofeedback therapy to establish correct [k] production. The results of the intervention for children in the Ultrax project are reported in Cleland, Scobbie, and Wrench (2015), intervention results for the remainder of the children are in preparation. For both studies children were recruited from local Speech and Language Therapists. We requested children aged over six with lingual errors which had been unresponsive to treatment. The children presented here are a subset of both projects who received treatment targeting production of velars. All participants were monolingual speakers of English and all had received speech therapy in the past, but not using any visual biofeedback methods. Children were selected if they had less than 20% velars correct at baseline probes (see below) and the data presented here were recorded before intervention commenced.
Participant Project Age Sex
BPVS
SS DEAP PCC SSD Subtype
01M Ultrax 6;0 M 109 75 Consistent Phonological Disorder
05M Ultrax 6;5 M 107 52 Consistent Phonological Disorder
06M Ultrax 6;0 M 80 58 Phonological Delay
07F Ultrax 7;6 F 109 86 Phonological Delay
01F Ultraphonix 8;8 F 80 70 Inconsistent Phonological Disorder 03F Ultraphonix 10;11 F 77 57 Developmental Verbal Dyspraxia
04M Ultraphonix 7;2 M 108 72 Phonological Delay
[image:10.595.67.526.106.254.2]MEAN 7;6 95.71 67.10
Table 1: Participant details. BPVS: British Picture Vocabulary Scale- 3 standard score (Dunn et al., 2009); DEAP: Diagnostic Evaluation of Articulation and Phonology, (Dodd et al., 2002) Phonology subtest, percentage consonants correct, assessment recorded at second baseline, B2.
PARTICIPANT
Ultrax Ultraphonix
PROCESS 01M 05M 06M 07F 01F 03F 04M Total %Total
Errors
Velar Fronting 16 14 12 18 20 14 20 114 44.19
Labialisation of
sibilants 4 4 1.55
Post alveolar
fronting 2 5 5 1 6 19 7.36
Backing 1 1 0.39
Gliding 13 10 12 8 7 14 64 24.81
Stopping 1 1 5 7 2.71
Deaffrication 1 1 1 3 6 2.33
Voicing errors 1 4 4 9 3.49
Weak syllable
deletion 1 1 2 0.78
FCD 1 7 8 3.10
MCD 1 1 2 4 1.55
Cluster
Reduction 7 9 6 11 33 12.79
Other 7 2 2 11 4.26
TOTAL 31 48 41 19 42 61 40 282 100
[image:11.595.72.523.114.469.2]% Total Errors 12.02 18.60 15.89 7.36 16.28 23.64 15.50 109.30 100 Table 2: Phonetic and Phonological Analysis. FCD: Final consonant deletion; MCD: word medial consonant deletion.
All of the children also completed a wordlist designed to sample velar consonants in a variety of word positions and vowel environments, producing one token of each word. Wordlists differed between projects (the newer UltraPhonix wordlist is an enlargement of the Ultrax list with 105 rather than 64 words, more minimal pairs and more systematic sampling of vowel context) but are equivalent in that they sample word initial singleton t/k minimal pairs (or near minimal pairs) in a range of vowel contexts. These were:
Ultrax: tore/core, table/cable, tie/Kai, toot/coot (Kai is a common first name in the UK)
Ultrasound Recording
The ultrasound system used was a high-speed cineloop system (Wrench and Scobbie, 2011) with audio synchronisation allowing us to accurately identify tongue shape within 10ms of the acoustic burst of /t/ and /k/, and which was probe-stabilised with a headset (Scobbie, Wrench and Van der Linden, 2006) to allow us to compare tongue shape for /t/ and /k/ directly. The headset was fitted in such a way that the mandible and hyoid shadows were symmetrical on the image, thus ensuring we could see as much of the tongue as possible. However, it should be noted that this approach is approximate and therefore rotation of the images differs between speakers. The headset can become heavy and uncomfortable over time and for this reason recordings were restricted to a maximum of 50mins and removed sooner at participant’s request. The wordlists analysed here took around 10 to 12mins to elicit. All children tolerated the headset during the recording session without having to remove and refit it. Whilst the headset does restrict jaw movement somewhat, we ensured that all speakers were able to articulate the Scottish English corner vowels /i,a,o/ comfortably before beginning as part of our protocol for fitting the headset.
Ultrasound data was acquired using an Ultrasonix SonixRP machine remotely controlled via Ethernet from a PC running Articulate Assistant Advanced TM software (Articulate Instruments Ltd, 2012) versions 2.14 to 2.16 which internally synchronise the ultrasound and audio data. The echo return data was recorded at 121 frames per second (fps), i.e. 8ms per frame with a 135 degree field of view (FOV) in the mid-sagittal plane. Simultaneous acoustic and lip-camera recordings were also made, using an audio technica 803D clip-on microphone sampling at 22050Hz and a NTSC micro-camera (deinterlaced to 60fps), and synchronised to the audio with an electronic clapperboard (SyncBriteUpTM, Articulate Instruments Ltd, 2010).
Auditory Analysis
encouraged to use the full range of IPA and extIPA symbols rather than make a forced choice between /t/ and /k/. This allows us to determine whether there was indeed a perceptual neutralisation in the children’s speech. It should be noted that this does not mean that no perceptual difference exists. Several studies (see for example Munson et al., 2010) have suggested that listeners are able to perceive gradient differences when perceptual rating scales are used. Rather, it suggests that at the level of transcription employed by most SLTs in the field, children would be judged to have neutralised the contrast. Two final year Speech and Language Therapy students who had completed their phonetics training provided inter-rater reliability for 25% of the data.
Ultrasound Analysis and Outcome Measures
Using AAA v2.16 software (Articulate Instruments, 2012) /t/ and /k/ segments were annotated at the beginning of the burst, the corresponding ultrasound frame was then selected and a spline indicating the tongue surface fitted to the image using the semi-automatic edge-detection function in AAA software. This choice of a temporal alignment is most appropriate for an association of tongue shape to burst acoustics and provides a consistent anchor point. Our choice of burst is pragmatic in nature since it is difficult to identify the entire closure phase, as is the tradition in EPG research, with ultrasound alone. The data analyst draws a spline in the region of the ultrasound image of the tongue and AAA’s local edge-detection function is used to search for the best edge locally. AAA then assigns a confidence value to each of the control points on the equally-spaced 42-fan measurement grid, while smoothing the spline spatially within the frame. All splines from all /t/ and /k/ tokens were then averaged within target segment and within speaker and compared.
between means is a minimum of six adjacent radii where the mean difference is significant at p<.05. These six adjacent radii are over a contiguous region of the tongue surface (approximately 2-3cm of surface), reflecting the fact that the adjacent parts of the tongue, and their distance from the fan-grid’s origin (i.e. the centre of the probe) are not independent. This avoids reporting localised differences in tongue shape as clinically significant when they are unlikely to be so and is a conservative approach.
Results
Broad Phonetic Transcription
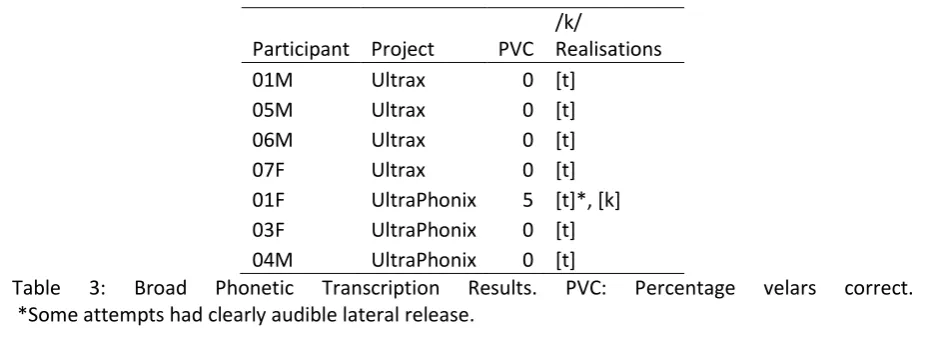
Table 3 shows the percentage of velars transcribed as correct for each child for all of the words in the probes. Six out of seven children perform similarly with no correct velars and all attempts transcribed as [t], demonstrating classic velar fronting in all word positions. The remaining child, 01F_UltraPhonix, produced 5% velars correct in broad transcription, with errors being transcribed as [t], but with two variants that were either centrally released or laterally released. She will be discussed in more detail in Study Two. Inter-rater reliability for 25% of the data was 95% (ranging from 83% to 100% agreement).
Participant Project PVC /k/
Realisations
01M Ultrax 0 [t]
05M Ultrax 0 [t]
06M Ultrax 0 [t]
07F Ultrax 0 [t]
01F UltraPhonix 5 [t]*, [k] 03F UltraPhonix 0 [t] 04M UltraPhonix 0 [t]
Table 3: Broad Phonetic Transcription Results. PVC: Percentage velars correct. *Some attempts had clearly audible lateral release.
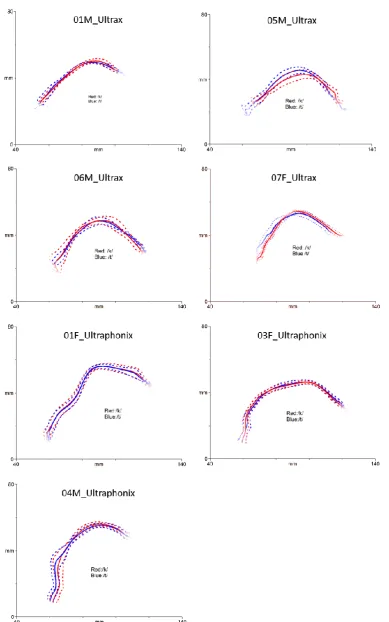
Ultrasound Analysis
[image:14.595.66.531.463.633.2]05M_Ultrax, where unexpectedly, /t/ appears have more dorsal raising. The seven children present with a wide variety of tongue-shapes, despite the consistent transcription as [t]. In part this is due to inter-speaker variability, including different vocal tract shapes, but it should also be noted that the rotation of the ultrasound images is not consistent across participants and this can lead to difficulty interpreting static images (without the context of the dynamics) across speakers and sessions. Statistical analysis using the in-built t-test function in AAA shows no significant difference between tongue shapes for /t/ and /k/ in any of the children, if the stringent criterion of difference in six adjacent fanlines is adhered to (Cleland et al., 2015). 04M_UltraPhonix did show a difference in the tongue root in three adjacent fanlines (lines 33-35, where fanlines are numbered 1 to 42 from tip to root, with an average distance between means of 2.87mm).
Study Two: Single Case Study Participant
Whilst lack of covert contrast at the articulatory level was in line with the auditory analysis in six of the children, for one child, 01F_Ultraphonix, “Rachel”, we were particularly surprised by lack of a contrast because some attempts at /k/ were noted as retroflexed [ʈ] in the ultrasound images. This led the ultrasound clinician to suspect covert contrast based on her own subjective impression. Since previous research (Klein et al., 2013) has suggested that trained ultrasound clinicians might be reliable in online visual judgements of ultrasound images, further investigation of this particular child’s speech was undertaken to determine if covert contrast existed at the articulatory level in some phonologically patterned way that our previous analysis was insensitive to. Retroflexion was visually salient to the ultrasound clinician on raw ultrasound images, but not audible, nor was it immediately clear which, if any, linguistic targets a greater tendency of retroflection was associated with.
The visual percept of a retroflex on the image includes artefacts, sometimes giving the impression of the tongue going beyond the hard palate. Though caused by reflections of ultrasound within the tongue, and the near-parallel orientation of tongue surface to ultrasound scanlines, these limitations of ultrasound are consistently present in retroflexion making these sounds easy to identify visually (Scobbie, Punnoose, & Khattab 2013).
The average tongue shapes for /t/ and /k/ at the burst (see fig 2, 01_UltraPhonix above) show no simple pattern of retroflex for /k/ vs. alveolar for /t/. In this case study we examine the client more extensively, to see whether covert contrast could be found by looking at the data for all productions of /t/ and /k/ (not just the minimal pairs), by examining other baseline sessions, and by looking qualitatively at the dynamics of the closure kinematics in the raw images.
reported a complex history of poor attention, memory difficulties, and specific language impairment. She achieved a percentile rank of 50 on the Raven’s Progressive Matrices (Raven, Raven & Court, 2003), suggesting normal cognitive ability, a standard score of 80 on the BPVS-3 (Dunn et al., 2009) and a standard core language score of 69 on the Clinical Evaluation of Language Fundamentals (CELF-4UK) (Semel, Wiig & Secord, 2006), consistent with the diagnosis of specific language impairment. On the Comprehensive Test of Phonological Processing (Wagner, Torgesen, & Rashotte, 1999) she achieved a “very poor” score on phonological awareness, a “poor” score on phonological
memory and an “average” score on rapid symbolic naming. Orofacial examination identified a
high-arched narrow palate, long narrow uvula, pointing of upper lip and saliva pooling at the corners of her lips.
Speech assessment with the DEAP (Dodd et al., 2002) showed that in addition to velar fronting, Rachel also presented with the developmental processes of gliding, cluster reduction and inconsistent deaffrication and the abnormal phonetic pattern of variable lateral release on oral stops. Probe assessment with a wordlist composed of 105 words containing 82 velars (some words contain no velars as they are minimal pairs, see above) showed velar fronting in all word positions with only 5% velars transcribed as [k] in broad phonetic transcription by the ultrasound clinician.
Ultrasound Analysis
voiceless stops. Both series show the same pattern unless noted. Again, each stop was annotated at the burst (see above).
[image:19.595.79.492.359.508.2]All recordings were inspected qualitatively to identify retroflex articulations by the second and third author using consensus agreement to identify retroflexion by looking at the dynamics of the stop articulation. We classified every token by hand as being either retroflex or not: clear retroflexion involves fairly strong retraction during closure and/or a curving of the tongue blade. Usually, the burst and maximal constriction showed only fairly subtle retraction or curving (Fig 3). Fig 4 exemplifies the dynamic aspects majority non-retroflexing situation. We used Fisher’s exact test of contingencies to determine if our retroflexion categories patterned phonologically, for example with /t/ or with /k/ or by vowel environment.
Figure 4. Non-retroflexing of /t/ in “tub”, /t/ = [t], dynamic sequences. Splines are ~8ms apart. Left: from pre-word stable shape to stop’s maximal constriction (top black spline). The acoustic burst was located 16ms before the maximal constriction, and is almost indistinguishable in shape. Right: the sequence from the maximal constriction (top black spline) to the stable vowel target.
Figure 5: Tongue splines of all /k/s (red) and /t/s (blue) at stop burst
We hypothesised that /t/ vs. /k/ might be differentiated by retroflexion and/or that some other linguistic categories might be reflected in tongue shape differences: voicing, word position, and coarticulation with adjacent vowels. The diagram (Fig 5) of tongue surface splines at the acoustic burst, coloured by phoneme target, confirms that in both WI and WF position, some of the /t/ and /k/ show blade-raising and retroflexion during closure. We tested, again using t-tests, for differences in subsets of the data: words vs. sentences, and WI vs. WF, transcribed retroflex vs. others, voiced vs. voiceless. We also looked at the effect of coarticulation, examining the shape of /k/ and /t/ before high vowels vs. other vowels.
We first confirmed from the larger, more varied dataset, that average /t/ vs. /k/ are not different when all data is pooled. Figure 6 shows the average tongue shapes for all WI and WF /t/ and /k/ and in keeping with the minimal pair data there was no significant difference between tongue curves.
Figure 6: Average for all /t/ (blue) and /k/ (red) tongue splines
Comparing average plots of /t/ vs. /k/ in word-initial (WI) or word-final (WF) position shows no covert contrast in either, and neither is there any significant difference between WI minimal pairs versus WF pairs for either /t/ or /k/. Whether the stops appeared in sentences or words appeared also to be irrelevant. The auditory impression of lateral release, an aspect of variation that was sometimes present, did not appear to show up as a significant differentiator of tongue shape in the midsagittal plane, though careful placement of the probe in the coronal plane may have revealed this.
Figure 7: Averages for retroflex-like /k/ and /t/ (blue) and plain /k/ and /t/ (green)
Figure 8: Averages for /k/ and /t/ before high vowels (purple) and elsewhere (orange)
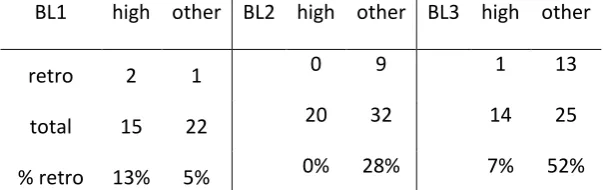
Both these patterns seemed to be present not just in this baseline, but in the other two baselines too. We examined the distribution of transcribed retroflexes in relation to /k/ or /t/ target, and following high vowel or otherwise. The distribution of the retroflex type is shown in table 4, including also the BL1 and BL3 baseline sessions. These do not seem to pattern phonologically.
BL1 /k/ /t/ BL2 /k/ /T/ BL3 /k/ /t/
retro 3 0 5 4 11 3
total 26 11 33 19 28 9
% retro 12% 0% 15% 21% 39% 33%
BL1 high other BL2 high other BL3 high other
retro 2 1 0 9 1 13
total 15 22 20 32 14 25
[image:23.595.147.451.73.168.2]% retro 13% 5% 0% 28% 7% 52%
Table 5: Distribution of retroflex type by vowel environment
In Table 5, from CV contexts, the vowel effect at stop burst seen above in Fig 8 can be seen in terms of the distribution of transcribed tokens. This is significant by a Fisher’s Exact Test of contingencies (p<.01), confirming that the retroflexion is indeed not a function of /k/ vs. /t/, but of the vowel environment.
Though we found the same patterns in BL2 when it was possible to compare /d/ and /ɡ/, or
when pooling /t/ with /d/ and /k/ with /ɡ/, we did notice a subtle difference in tongue surface due to phonological voicing. In WI position for /t/ vs. /d/ in words alone, and in pooled words and sentences, the root of /t/ was more retracted in the upper pharynx by about 2mm. For /k/ vs. /ɡ/ pooled words and sentences were different, with the root of /k/ being more retracted by 1.5-2mm (but in words alone there was no statistical effect). However, if the WI stops from both places were pooled, there was no significant voicing effect. In WF position, a small voicing effect was noted in the blade area. The blade was slightly more raised in /k/ than in /ɡ/, and for both places pooled, by over 3mm. (There were too few WF /d/ to analyse alveolars separately, and there was no significant tongue root difference).
Discussion
Study One: Group Study
minimal pairs we found no evidence for covert contrast in any of the children in the mid-sagittal tongue shape at stop burst. Given that these children have particularly persistent velar fronting, and previous studies have suggested that covert contrast is highly prevalent (Munson et al., 2010), this was a surprising finding. Indeed, the average tongue splines for all the children show productions of /k/ to be very much what would be expected in typically developing children’s productions of /t/. From this apparent lack of contrast it tempting to conclude that these children, unlike others reported previously in the EPG literature, present with a simple case of phonological delay.
However, it should be noted that convert contrast may have been observed with further analysis of the onset to, or offset from, the burst of the consonant, as is the case in previous EPG research, or that further recordings and analysis of coronal ultrasound may also have yielded different results. Dynamic analysis of closure phase is time consuming with ultrasound and unlikely to be usable in the speech therapy clinic. Likewise, there are no straightforward methods of analysing coronal ultrasound reported in the literature. Alternatively, it may still be possible to identify covert contrast in other aspects such as voice onset time using acoustic analysis or more holistically using a gradient perception experiment (see Munson et al., 2010), and we therefore cannot conclude that convert contrast, and therefore a phonetic cause of speech disorder, does not exist in these children.
Positive evidence for a phonetic-level disorder in our study comes from the observation that 5/7 children were unable to achieve a velar consonant in CV or in isolation, despite previous speech therapy targeting this very consonant. When this is the case Dodd (2013) suggests that an “articulation disorder” is the likely cause of impairment. These disorders are at the phonetic, or motor level, though they do not meet the diagnostic criteria for developmental verbal dyspraxia/ childhood apraxia of speech.
However, this was in a single speaker of a much younger age and it is possible that he was in a period of natural acquisition of an overt contrast. This is unlikely to be the case in our participant group since these children all showed a long history of velar fronting across all word positions, and repeated probe baseline data (not reported here) showed no improvement in production of velars across time. A further intervention study of the four children from the Ultrax project has shown that these children did in fact quickly achieve an overt contrast between /t/ and /k/ using ultrasound visual biofeedback therapy, but these contrasts were achieved in a gradient manner with increasing dorsal differentiation towards a normal production by the end of the course of therapy (Cleland, Scobbie, Isles & Alexander, 2015).
The single case study, moreover, illustrates how ultrasound analysis is capable of detecting small and subtle differences in tongue shape arising from coarticulation, similar to EPG. This leads us to conclude that our general finding is not due to a lack of data, noise in the data, or problems with instrumental resolution (see below). Therefore, if not providing evidence of phonological neutralisation, the consistency of these seven cases demonstrates that a phonetic-level failure to encode place of articulation can lack any covert contrast in midsagittal tongue shape or location.
Study Two: Case Study
The subtle phonetic effects we show (a voicing difference and a coarticulatory difference) indicate that ultrasound is capable of picking up small, consistent differences in speech production, if they are present. We therefore take the lack of covert contrast at stop burst in the mid-sagittal plane (in Rachel and in the other children) to be a reliable finding, not just due to the use of ultrasound, rather than EPG.
As far as we are aware, retroflexion has not previously been described in the speech of children with persistent velar fronting, perhaps because EPG (the articulatory technique most used to identify covert contrasts and covert errors in children’s speech) is not able to identify retroflexion. Rachel also demonstrated an “arched” tongue shape, characterised by dorsal raising (relative to typical development). We hypothesise that this is the same type of gesture described by Gibbon (1999) as an Undifferentiated Lingual Gesture (ULG). These gestures occur in the speech of children with persistent speech sound disorders and are taken by Gibbon (1999) to arise from a preservation of a developmental stage in which children lack differential control of the tongue tip/front and tongue body. ULGs are characterised by increased tongue-palate contact, which is easily identified with EPG, a technique which shows tongue-palate contact only. On the other hand, tongue-palate contact can only be inferred from ultrasound recordings because the palate is not imaged during the ultrasound recordings, though its location can be traced from recordings of swallows. Studies which employ simultaneous EPG and ultrasound would be useful in determining whether ultrasound can identify the same errors exemplified in EPG.
On the other hand, EPG only records contact, not close approximation, so has to infer a midsagittal arched tongue shape from peripheral patterns of contact. We conclude that that Rachel presents with ULG amongst other types of covert errors (i.e. retroflection).
Clinical Use of Ultrasound for the Identification of Covertness
A secondary aim of this study was to investigate whether or not ultrasound was a viable tool for identifying covert contrasts and errors in the speech therapy clinic. By using a headset to stabilise the probe it was possible to average and overlay images in order to identify differences in tongue shapes between phonemic targets and unusual errors. Whilst for the purpose of this study we also compared the averaged tongue shapes statistically, it was possible to identify covert errors (or indeed lack of them) by visual inspection alone. This holds advantages over McAllister Byun et al. ‘s (2015) approach of extracting numerical information from ultrasound images and comparing these offline. However, in order for the approach presented here to be viable in the clinic, automatic and preferably real-time spline tracing would have to be employed since here this was achieved only semi-automatically. Development of robust, real-time, fully automatic contour tracking which could be employed in a clinical tool for comparing and classifying tongue shapes automatically is ongoing in various labs (Xu et al., 2015; Fabre et al., 2015) and
results indicate that a practical method is likely in the
near future. Nevertheless, raw ultrasound images themselves do show some errors very clearly, especially retroflexion. Importantly, ultrasound shows promise as a diagnostic tool for motor-based speech disorders, which works in tandem with ultrasound visual biofeedback for motor-based intervention.
Conclusion
the entire stop-closure phase, augmented with a perception experiment designed to investigate the gradient nature of stop continua, such as the visual analogue scale used by Munson et al. (2010). The nature of these children’s speech sound disorder remains unclear, with both phonological and phonetic impairment remaining as candidate causes.
Our single case study, Rachel, also showed no evidence of a covert phonemic contrast of stop place at the articulatory level, in the midsagittal tongue shape at stop release. However she clearly shows a “covert error” of retroflexion which as far as we are aware has not been reported in acquisition of velars in typically developing children, though it is conceivable that some of the reported acoustic difference in young children’s neutralised productions of /t/ and /k/ are due to tongue shapes not attested in typical adults. This hypothesis is difficult to test without articulatory information from young children less than three years old which is experimentally difficult to acquire. We also showed Rachel has small, consistent reflexes of stop voicing and that both velar and alveolar stops tend not to be retroflexed before a following high vowel. For Rachel, the presence of a covert error in her speech with a lack of phonological patterning for target stop place suggests a motor-based speech impairment in line with previous research by Gibbon (1990) on undifferentiated lingual gestures in children with persistent speech sound disorders. Despite the apparent absolute neutralisation of the phonological place contrast which might suggest phonological therapy, the diagnostic value of these covert phonetic errors is that they suggest the selection of therapy approaches which capitalise on motor learning.
Acknowledgments
Thank you primarily to the children and their parents who attended weekly recording and therapy sessions. Thank you also to the Speech and Language Therapists who referred the children. Thank you to Steve Cowen for technical assistance with the ultrasound recordings.
References
Articulate Instruments Ltd. (2015). Articulate Assistant Advanced User Guide: Version 2.16. Edinburgh: Articulate Instruments Ltd.
Articulate Instruments Ltd, 2011. Syncbrightup user’s manual: Revision 1.11. Edinburgh: Articulate Instruments Ltd.
Bressmann, T., Radovanovic, B., Kulkarni, G. V., Klaiman, P., & Fisher, D. (2011). An ultrasonographic
investigation of cleft-type compensatory articulations of voiceless velar stops. Clinical
linguistics & phonetics, 25(11-12), 1028-1033.
Cleland, J., Scobbie, J.M., Isles, J., & Alexander, K. (2015). Gradient acquisition of velars via
Ultrasound Visual Biofeedback for persistent velar fronting. Poster presented at Ultrafest VII,
December 8th-10th, 2015, The University of Hong Kong.
Cleland, J., Scobbie, J. M., & Wrench, A. A. (2015). Using ultrasound visual biofeedback to treat
persistent primary speech sound disorders. Clinical linguistics & phonetics, 29(8-10),
575-597.
Dodd, B. (2013). Differential diagnosis and treatment of children with speech disorder. John Wiley &
Sons.
Dodd, B., Zhu, H., Crosbie, S., Holm, A., & Ozanne, A. (2002). Diagnostic evaluation of articulation
and phonology (DEAP). Psychology Corporation.
Dunn, L. M., Dunn, D. M., Styles, B., & Sewell, J. (2009). The British Picture Vocabulary Scale III – 3rd Edition. London: GL Assessment.
Fabre, D., Hueber, T., Bocquelet, F., & Badin, P. (2015, September). Tongue Tracking in Ultrasound
Images using EigenTongue Decomposition and Artificial Neural Networks. In Interspeech
2015.
Forrest, K., Weismer, G., Hodge, M., Dinnsen, D. A., & Elbert, M. (1990). Statistical analysis of
word-initial /k/ and /t/ produced by normal and phonologically disordered children. Clinical
Linguistics & Phonetics, 4(4), 327-340.
Gibbon, F. (1990). Lingual activity in two speech-disordered children's attempts to produce velar and
alveolar stop consonants: Evidence from electropalatographic (EPG) data. International
Journal of Language & Communication Disorders, 25(3), 329-340.
Gibbon, F. E. (1999). Undifferentiated lingual gestures in children with articulation/phonological
disorders. Journal of Speech, Language, and Hearing Research, 42(2), 382-397.
Gibbon, F. & Scobbie, J.M. (1997). Covert contrasts in children with phonological disorder. Australian Communication Quarterly. Autumn, 13-16.
Hardcastle, W. J., & Gibbon, F. (2005). Electropalatography as a research and clinical tool. 30 Years
on. In Hardcastle, W. J., & Beck, J. M. (Eds.). (2014). A figure of speech: a festschrift for John
Laver. Routledge.
Heyde, C. J., Scobbie, J. M., Lickley, R., & Drake, E. K. (2015). How fluent is the fluent speech of
people who stutter? A new approach to measuring kinematics with ultrasound. Clinical
Linguistics & Phonetics, 1-21.
Home - Ultraphonix - CASL - Queen Margaret University. (n.d.). Retrieved February 05, 2016, from
http://www.qmu.ac.uk/casl/ultraphonix/default.htm
Klein, H. B., Byun, T. M., Davidson, L., & Grigos, M. I. (2013). A multidimensional investigation of
children's /r/ productions: Perceptual, ultrasound, and acoustic measures. American Journal
of Speech-Language Pathology, 22(3), 540-553.
Liberman, A. M., Harris, K. S., Hoffman, H. S., & Griffith, B. C. (1957). The discrimination of speech
sounds within and across phoneme boundaries. Journal of experimental psychology, 54(5),
358.
Maxwell, E. M., & Weismer, G. (1982). The contribution of phonological, acoustic, and perceptual
techniques to the characterization of a misarticulating child's voice contrast for
stops. Applied Psycholinguistics,3(01), 29-43.
Mcallister Byun, T., Buchwald, A., & Mizoguchi, A. (2015). Covert contrast in velar fronting: An
acoustic and ultrasound study. Clinical linguistics & phonetics, 1-27.
Munson, B., Edwards, J., Schellinger, S. K., Beckman, M. E., & Meyer, M. K. (2010). Deconstructing
phonetic transcription: Covert contrast, perceptual bias, and an extraterrestrial view of Vox
Oller, D. K., & Eilers, R. E. (1975). Phonetic expectation and transcription validity. Phonetica, 31(3-4),
288-304.
Raven, J., Raven, J.C., & Court, J.H. (2003, updated 2004). Manual for Raven's Progressive Matrices and Vocabulary Scales. San Antonio, TX: Harcourt Assessment.
Semel, E., Wiig, E., & Secord, W. (2006). Clinical Evaluation of Language Fundamentals, Fourth UK Edition. San Antonio, TX: Harcourt Assessment.
Scobbie, J.M., Gibbon, Hardcastle, W. & Fletcher, P. (2000). Covert contrast as a stage in the
acquisition of phonetics and phonology. Papers in laboratory phonology V: Acquisition and
the lexicon, 5, 194.
Scobbie, J. M., Punnoose, R., & Khattab, G. (2013). Articulating five liquids: A single speaker
ultrasound study of Malayalam. In: Rhotics: New Data and Perspectives. BU Press,
Bozen-Bolzano, pp. 99-124. ISBN 978-88-6046-055-4
Scobbie, J.M., Wrench, A. & van der Linden, M. (2008). Head-Probe stabilisation in ultrasound tongue imaging using a headset to permit natural head movement. Proceedings of the 8th International Seminar on Speech Production, 373-376.
Ultrax home. (n.d.). Retrieved February 05, 2016, from http://www.ultrax-speech.org/
Wagner, R., Torgesen, J., & Rashotte, C. (1999). Comprehensive test of phonological processing
(CTOPP). Pro-Ed, Austin, Texas.
Wrench, A. & Scobbie, J.M. (2011). Very High Frame Rate Ultrasound Tongue Imaging. Proceedings of the 9th International Seminar on Speech Production (pp. 155-162), Montreal, Canada. Zharkova, N. (2013). Using ultrasound to quantify tongue shape and movement characteristics. The
Cleft Palate-Craniofacial Journal, 50(1), 76-81.
Xu, K., Yang, Y., Stone, M., Jaumard-Hakoun, A., Leboullenger, C., Dreyfus, G., & Denby, B.
(2016).Robust contour tracking in ultrasound tongue image sequences. Clinical linguistics &
Appendix: Wordlist for Study 2 Word Initial /k/ Minimal pair
keep team
cape tape
ken ten
cab tab
cop top
core tore
cool tool
cub tub
kip tip
Kai tie
couch
coy toy
cube tube
Word Final /k/ Minimal Pair
meek meet
make mate
peck pet
pack pat
mock pot
boak boat
took toot
muck mut
lick lit
Mike might
Sentences
Kenny drank a tiny tin of coke
My Granny Maggie got a golden gown Ken likes scones with cream and apricot jam Kevin got a cab to the coast


![Figure 3. Retroflexing of /k/ in “coy”, /k/ = [t], dynamic sequences. Splines are ~8ms apart](https://thumb-us.123doks.com/thumbv2/123dok_us/1516117.104229/19.595.79.492.359.508/figure-retroflexing-coy-dynamic-sequences-splines-ms-apart.webp)
![Figure 4. Non-retroflexing of /t/ in “tub”, /t/ = [t], dynamic sequences. Splines are ~8ms apart](https://thumb-us.123doks.com/thumbv2/123dok_us/1516117.104229/20.595.77.495.93.240/figure-non-retroflexing-tub-dynamic-sequences-splines-apart.webp)