City, University of London Institutional Repository
Citation
:
Friederich, S. and Payne, R. (2015). Order-to-trade ratios and market liquidity. Journal of Banking & Finance, 50, pp. 214-223. doi: 10.1016/j.jbankfin.2014.10.005This is the accepted version of the paper.
This version of the publication may differ from the final published
version.
Permanent repository link:
http://openaccess.city.ac.uk/7754/Link to published version
:
http://dx.doi.org/10.1016/j.jbankfin.2014.10.005Copyright and reuse:
City Research Online aims to make research
outputs of City, University of London available to a wider audience.
Copyright and Moral Rights remain with the author(s) and/or copyright
holders. URLs from City Research Online may be freely distributed and
linked to.
City Research Online: http://openaccess.city.ac.uk/ publications@city.ac.uk
Order-to-trade ratios and market liquidity
∗
Sylvain Friederich and Richard Payne
†September 26, 2014
Abstract
We study the impact on market liquidity of the introduction of a penalty for high order-to-trade ratios (OTRs), implemented by the Italian stock exchange to curtail high-frequency quote submission. We find that the fee is associated with a collapse in the quoted depth of the stocks that make up the bulk of trad-ing in Italian equities and an increase in price impacts of tradtrad-ing across the treated stocks. Spreads do not change, however. Stocks from a pan-European control sample show no such liquidity changes. Thus, the Italian OTR fee had the effect of making Italian stocks markets more shallow and less resilient. Large stocks are more severely affected than midcaps. We also find evidence of a limited decrease in turnover. Consolidated liquidity, constructed by aggre-gating across all electronic trading venues for these stocks, decreases just like that on the main exchange. Thus, liquidity was not simply diverted form the main exchange, it was reduced in aggregate.
Keywords: Order-to-trade ratios; High-Frequency Trading; Computerized trad-ing; Italian Stock Exchange; Limit order trading.
∗A pilot study conducted for the UK Government Office for Science project “The Future of
Computer-based Trading in Financial Markets” was the initial basis for this paper. We thank Fanny Declerck, Ian Marsh and S´ebastien Pouget and two anonymous reviewers for their comments. All errors are our own.
†University of Bristol and Cass Business School, respectively. Correspondence:
Enforcing order-to-trade ratios (OTRs) on a trading venue involves financially
pe-nalising individual member firms if the orders to buy or sell they enter do not lead
to a “sufficient” number of trades. As OTRs attack High-Frequency Trading (HFT)
at its root – targeting the high number of “messages” that high speed participants
rely upon – regulators currently consider them as one of the policy tools of choice
to reduce the incidence of HFT. For example Mary Schapiro, then Head of the US
Securities and Exchange Commission, indicated that the SEC was considering
imple-mentation of an OTR penalty scheme.1 The EU Parliament and Commission have gone further: the current draft of the piece of legislation that will regulate trading
across all EU exchanges from 2016, the “Markets in Financial Instruments Directive”
(MiFID), includes across-the-board implementation of OTRs.2
In fact, the national regulators of some of the largest EU countries have decided not to
wait and have either already implemented OTRs or intend to do so. This includes the
Italian stock exchange, which is the focus of our study. On April 2nd, 2012, the Milan Borsa, the historical stock exchange of Italy and part of the London Stock Exchange
Group, implemented an order to trade ratio applying to all its member firms. This
event presents us with a direct way of estimating the link between messaging activity
and liquidity.
There is little doubt that a measure causing high-frequency quoting to contract has
the potential to alter pricing, trading and liquidity processes in a significant way.
By all accounts, high-frequency flow has become very significant in today’s markets.
The Tabb Group, a consultancy, estimated the incidence of High-Frequency trading at
39% for Europe in 2012 (reported in “Understanding High Frequency Trading”, World
Federation of Exchanges report, 29 May 2013). Consistent estimates are available for
1Financial Times, 28 February and 10 April 2012.
2Its Article 51(3) states that “Member States shall require a regulated market to have in place
a few markets where research-based evidence is available: In Nasdaq data, Brogaard,
Hendershott, and Riordan (2013) find that HFT makes up about 42% of traded
volume in large stocks over their sample period, a figure that they indicate does not
include all HFT flow. In Nasdaq-OMX data, Hagstr¨omer and Nord´en (2013) report
an interval estimate of 26-30% for pure HF firms, and a total amount of HF trading
that could be as high as 52%. (The first figures do not include firms using a mix
of low and high frequency strategies.) The effect of a reduction of high frequency
quoting is not clear however. If those using large numbers of messages are making
markets, then liquidity might decline with the imposition of an OTR. If instead,
firms with high messaging rates impose adverse selection costs on other participants,
then constraining this behaviour might attract other traders back to market and thus
increase liquidity.
We find that the introduction of the OTR penalty scheme is associated with a marked
deterioration in quoted depth for Italian stocks. Depth declines particularly steeply in
large stocks that make up the bulk of turnover in Italian equities. Price impacts from
trading are significantly increased following the introduction of the OTR penalty
for all Italian stocks. Measures of quoting and trading activity also fall. Perhaps
more surprisingly, we also find that the deterioration of liquidity on the historical
exchange extends to measures of consolidated liquidity (where consolidated liquidity
is measured from aggregated orders across the historical exchange and alternative
trading venues). Thus, activity did not simply move away from Borsa Italiana and
towards venues such as Chi-X, but liquidity was reduced in aggregate. This suggests
that the historical exchange may dominate price and liquidity discovery. Another
interpretation is that only a limited number of liquidity suppliers make markets across
all venues, resulting in the maintenance of liquidity at less than competitive levels
(see Biais, Bisi`ere, and Spatt (2010) for evidence along these lines from US markets).
In the next Section we discuss the motivation for the Italian OTR scheme. In Section
2, we review relevant theory and evidence and formulate some testable hypotheses.
Section 4 explains our modelling approach and Section 5 presents estimation results.
1
Policy debates and stated goals of the Italian
OTR scheme
There is widespread interest in OTRs on the part of politicians, regulators and
ex-changes. Policy-makers seem driven by the intuition that there must be something
untoward in the submission of a large number of orders that do not lead to
execu-tions. With such low probability of execution, high-frequency orders must either have
lifetimes so short that they can’t be traded against or be too far from current prices
to be “bona fide” (O’Hara, 2010). At best, such orders are dismissed as not
consti-tuting genuine liquidity, while at worst, extremely short-lived quotes raise suspicions
of abusive behaviour, the most obvious example being “quote-stuffing” (attempts to
flood the systems of other firms with order entries and cancellations to hide
manip-ulative behaviour.) Other manipmanip-ulative strategies such as “layering” the order book
or “spoofing” also rely on the submission of multiple orders which are subsequently
cancelled.3
These views are exactly what inspired the Italian OTR scheme – widely reported in
the financial press to have been implemented at the request of the national regulators
CONSOB (see Financial Times, February 20, 2012, and The Trade, February 27,
2012.) To a Finance commission of the Italian Senate, the Head of CONSOB gave
more details on the rationale behind the fee, stating that “the ability of high frequency
traders to suddenly cancel orders placed before they are executed, displacing other
investors, can generate a misleading representation of the actual depth of the order
book, creating favorable conditions for market manipulation.” He went on to say that
3The European regulator ESMA defines layering and spoofing as “submitting multiple orders
“the increase in the number of orders placed in the trading systems and in the
order-to-trade ratio may endanger the regular course of the negotiations and the integrity of
markets, given the limits on capacity and the reliability of the infrastructure.”4 This
confirms that the OTR scheme was explicitly directed at HF traders and motivated by
concern that their rates of order entry may disrupt markets and foster manipulation.
2
Priors and testable hypotheses: HF trading and
liquidity
Whether an OTR will enhance or reduce liquidity depends on the net contribution
to liquidity of those HF agents targeted by the OTR as using the highest speed
(equivalently, the lowest latency). We review both sides of the argument.
An OTR may reduce the likelihood of outright manipulation. If the highest speed
targeted by the OTR is chiefly used for manipulative purposes (e.g. through quote
stuffing or layering of order books), then the OTR may improve liquidity by reducing
the costs that fast traders impose on slower participants. We have no estimate of how
much HF flow might be abusive in nature because such behaviour is very difficult to
detect unambiguously, particularly in its high-frequency flavour.5 Few cases are
pros-ecuted successfully and fewer cases still are found to involve HF traders.6 However, some academic work does raise the possibility that some HFTs engage in behaviour
that is consistent with manipulation. Gai, Yao, and Ye (2012) and Egginton, Van
Ness, and Van Ness (2013) find patterns consistent with quote-stuffing in their data.
Clark-Joseph (2013) finds that HF traders forecast the order flow of slower traders.
4“Audizione del Presidente della CONSOB Giuseppe Vegas, Senato Della Repubblica VI
Com-missione (Finanze)”, 26 June 2012, 54 p., Appendix 5, “High-Frequency Trading”, pp 39-40. (Our translation.)
5There is a suspicion that regulators are overwhelmed by the amounts of data that today’s
markets generate and that they are lagging behind brokers and exchanges in respect of the skills required to analyse the data. This view is expressed for example in “U.S. Securities and Exchange Commission, Organizational Study and Reform”, Boston Consulting Group report, March 10, 2011.
6At the time of writing, we are aware of only three cases of successful prosecution of firms
When they know that liquidity is low and that a big non-HFT order is being worked,
then they trade in front of that order and increase the trading costs of slower traders.
Using Nasdaq data, Hirschey (2013) finds that HFTs trade in front of other traders
and forecast returns associated with price pressure of other traders. All of these
ex-amples of behavior (quote stuffing, anticipatory trading) will likely have the effect of
increasing the execution costs of slow traders, i.e. reducing realized liquidity.
One might also argue that, if HF traders are better informed than other market
participants, then if the OTR was to discourage them from participating in
mar-kets, adverse selection risk would drop and liquidity increase. Both Hendershott and
Moulton (2011) and Menkveld and Zoican (2014) report evidence of greater adverse
selection after systems upgrades that increase the incidence of HF trading by reducing
latency on the NYSE and NASDAQ-OMX respectively.
A counter-argument to this last point relies on the idea that an OTR may damage
liquidity due to the fact that HF traders may be acting as de facto market makers and
the OTR constrains those activities. Decomposing the costs of market making into
order processing costs, inventory risk and asymmetric information risk, one can argue
that an OTR would increase all of them. Order processing costs may mechanically
rise due to the OTR fee itself. Then, as the OTR limits a HF market-maker’s latency
advantage, it increases both the risk associated with carrying unwanted inventory and
the risk of being picked off by fast aggressive traders.7 Overall, limiting the ability of HF market-makers to revise their quotes may reduce their participation in liquidity
supply or cause them to quote poorer prices and smaller sizes.
Finally, a separate argument is that the combination of automation and speed may
be a remedy to the issues of “limited attention” in human market-makers that are the
focus of a recent behavioural literature (Corwin and Coughenour, 2008; Boulatov,
Hatch, Johnson, and Lei, 2009). This work finds that human market-makers are
unable to give equal attention to all the stocks they deal in. As a result, their
7See Hendershott and Menkveld (2014) for a measurement of the economic significance of
liquidity provision is allocated unevenly, especially at times of increased activity:
Corwin and Coughenour (2008) find that market-makers submit fewer quote updates
than would be optimal in some of their assigned stocks, grant less price improvement,
and market efficiency is adversely affected. Again, the combination of automation
and speed provides potential remedies to this issue.
Consistent with these latter lines of reasoning, Hendershott, Jones, and Menkveld
(2011) Menkveld (2013) and Hasbrouck and Saar (2013) are examples of studies
reporting evidence consistent with greater speed allowing HF traders to narrow the
spread and improve liquidity.
2.1
Empirical evidence on the composition of HF activity
and on liquidity effects of trading regulations
How significant is liquidity supply as a proportion of HF activity and to what extent
would it be affected by an OTR? Using Nasdaq-OMX data where participants can
be identified, Hagstr¨omer and Nord´en (2013) report that market-making makes up
63 or 72% of HF business depending on the sample period, and in all cases over 80%
of all HF order submission. They also point out that “any regulatory policy directed
at HFTs as a group would primarily affect market-makers” as a result.
Intuition suggests that enforcement of an OTR seems likely to constrain HF
market-making more than other computerised trading activities such as statistical arbitrage
or execution of agency flow. Agency execution algorithms are designed to generate
executions (trades), and do not rely as heavily on speed as strategies considered “core”
HFT territory like stat arb and market-making do. The former can generate
signifi-cant quote “messaging” but executions are necessary for stat arb strategies to profit
from the mis-pricings that they identify. HF liquidity suppliers, on the other hand,
must revise their quotes to reflect the continuous arrival of macro and asset-specific
news, and to keep inventory risk to a minimum. Consistent with this, Hagstr¨omer
ra-tios” than directional or other strategies. This suggests that market-making systems
may be the first to be revised under an OTR constraint, which is likely to reduce
voluntary HF liquidity supply more than other types of HF flow.
We are aware of one recent study that is closely related to ours, by Jorgensen,
Skjel-torp, and Odegaard (2014), who evaluate the implementation of a “message to trade”
ratio on the Oslo stock exchange. Intriguingly, they find no evidence of impact on
variables of liquidity and activity. Their results, considered with ours, may illustrate
how different calibrations of a constraint on order submission may have different
effects. Other evidence that we have seen is indirect, in that it did not involve
imple-mentation of an actual OTR. Gai, Yao, and Ye (2012) find that a reduction in the
trading latency permitted by an upgrade in Nasdaq’s IT infrastructure has led to an
increase in empirical order-to-execution ratios, which in turn had no effect on quoted
liquidity. Colliard and Hoffmann (2013) and Meyer and Wagener (2013) study the
implementation of a transaction tax in France in August 2012. Although the
poten-tial ability of such a tax to reduce the incidence of HFT is sometimes discussed, it is
not its main goal and it is a very different type of event to ours, as it targets trades
and not HF order submissions.8
2.2
Testable hypotheses
Quoted liquidity at the inside and beyond Existing estimates suggest that
market-making represents the bulk of HF activity, which itself makes up a large
proportion of total activity. The effect of the OTR will depend on whether the
constraint it places on genuine market making strategies dominates the improvement
in liquidity that might result from the reduction in HFT-generated adverse selection.
The bulk of extant empirical work suggests that the negative effect could dominate
here, causing liquidity to fall. In particular, the OTR may cause order submitters to
8In fact, Italy introduced a specific tax on high speed trading in the year after the OTR we study
curtail liquidity supply with low execution probabilities. This could reduce order book
depth away from the inside spread. A similar reasoning applies to price impact of
trades: it may increase (market resilience decrease) if the OTR hampers the ability
of fast liquidity suppliers to refresh their quotes when liquidity is depleted. Price
impacts might also rise if fast informed liquidity suppliers become fast, informed
liquidity demanders under the OTR. If the OTR reduces the ability of HF traders to
trade in front of other traders, price impacts might instead fall.
Activity The average trade size could be affected in opposite ways by an OTR.
Two effects may cause it to increase: First, high-frequency trading seems
charac-terised by small trade sizes (see, for example, Chordia, Roll, and Subrahmanyam,
2011). Hence under an OTR that reduces HF participation, trade sizes might
in-crease. Additionally, an OTR may encourage more impatient trading and liquidity
consumption rather than supply and one might expect HF traders to conduct the
same activity using fewer, larger trades. On the other hand, a decrease in depth
(increase in price impact) may force traders controlling their execution costs to trade
in smaller lots.
In terms of total trading activity, the effect of the OTR will depend on whether it
causes HFTs to withdraw from trading and whether slower traders might participate
more in less HFT-dominated venues. In fragmented markets, activity may simply
move to other venues which do not impose an OTR, leaving total turnover unchanged.
Cross-sectional effects The effect of the OTR in the cross-section of stocks
re-mains to be identified empirically. Anecdotal evidence from the financial press
sug-gests that HFT interest is focussed on the largest names in terms of sheer quoting
frequencies, but this neither indicates that their OTRs in those stocks are higher
nor that HF market-making leads to smaller improvements in the liquidity of smaller
stocks. A small amount of HF activity in midcaps may significantly reduce spreads,
trading interests, adding HF market makers to the mix may not improve liquidity
much. Alternatively, if HF market making was very limited in midcaps already, then
imposing an OTR could have little real effect on them but a detrimental effect on large
caps (through the constraints placed on market-making). Also, if order submission
becomes more expensive, liquidity suppliers may lose incentives to quote aggressively
in stocks where execution probabilities are smallest and focus on larger issues only.
This might lead to substitution of HF activity towards larger issues to the detriment
of mid-caps.
Fragmentation, competition between order books and consolidated market
quality The impact of an OTR on consolidated measures of liquidity and activity
will depend on two effects. First, does independent price and liquidity discovery
occur on the rival electronic order books? If venues are substitutable in terms of
their ability to contribute to price discovery, then the result of an OTR on one venue
should be a wholesale migration of HF quoting to an alternative market and little
effect on consolidated, market-level liquidity. Second, how keen is competition in
liquidity supply across venues? If only a limited number of liquidity suppliers operate
on both, they may be able to adopt rent-seeking (collusive) behaviour to maintain
liquidity at uncompetitively low levels on the smaller venues. A finding with exactly
this flavour was reported by Biais, Bisi`ere, and Spatt (2010) for Nasdaq and Island
in the US. Further, if those demanding liquidity are constrained by technology, by
history or by mandate to seek execution on the historical main exchange then the
ability for liquidity supply to migrate to alternative venues is limited.
3
Market structure and data
The Italian stock exchange (Borsa Italiana), located in Milan and part of the London
Stock Exchange Group, operates a standard electronic order-driven system. The
followed by the main continuous auction phase between 9 a.m. and 5.25 p.m. During
the continuous periods, order execution is determined by the usual price and time
priorities. The market is closed by a batch auction at 5.30 p.m.
Over the sample period, the market share of electronic trading in Italian stocks held
by the Milan exchange stood at over 80% by value. The next largest competitor was
the newly merged BATS/Chi-X Europe with market share of roughly 15%, followed
by Turquoise (about 2%). Other markets are too small to mention. As such, at the
time, the Milan exchange had retained a much larger market share of total order flow
in its domestic equities than the historical exchanges of the UK, Germany or France
but a smaller share than the Spanish exchange.9
3.1
Features of the OTR scheme and preliminary evidence
The order-to-trade ratio is computed for each exchange member firm over all orders
they enter and the trades that result. The numerator includes all order entries,
irrespective of order type or price placement, of the proprietary or agency nature of
the order or of the phase of trading (opening and closing batch auctions or continuous
auction). For each firm, the ratio is calculated across its orders and trades in the
stocks belonging to the Milan exchange’s main segment called MTA. These 250 or
so stocks represent very close to 100% of total exchange market capitalization and
turnover by value.
From the ratio, the Italian exchange determines fees on a daily basis, thus reducing
the flexibility for a firm to engage in bursts of quoting activity on some days and
make up for those bursts on quieter days. There are three threshold ratios of 100:1,
500:1 and 1000:1 corresponding to a schedule of increasing fees (C0.01, C0.02 and
C0.025 per order respectively). That is, a firm having an OTR between 100:1 and
500:1 on a given day will pay 1 Euro cent (1.4 U.S. ¢) extra for each order entered
over 100:1. The fee increases to 2 cents per order for realised OTRs between 500:1
and 1000:1, and then to 2.5 cents per order entry above 1000:1. An added condition
is that fees are capped at C1,000 per firm-day.
Whilst an OTR of 100 to 1 by firm-day may may represent a strict constraint for
some firms, a maximum fee of C1,000 does not, on the face of it, look large.10 In spite of this, evidence generated by the Italian regulators (CONSOB) themselves, shows
that the OTR fee caused a sharp decline in realised OTRs (Caivano et al., 2012). In
the study, the authors compute order-to-trade ratios for all exchange member firms
over four months of data before imposition of the OTR fee. They find that seven
exchange members firms had average daily ratios that exceed the 100:1 threshold.
Out of perhaps 90 firms, four of them are clear outliers, the largest having an average
OTR of 1947 during the sample period. The authors then focus on 10 “pure-play”
HF firms that operate on the Milan exchange and report that four of them clearly
dominate activity, representing 90% of the trades conducted by the HF firms in their
sample. It is likely that the four firms that dominate trades are the same that are
outliers in OTR terms. Taken together, this suggests that the OTR fee applied to a
very small number of HF firms, to the exclusion of other agents.
The authors of the CONSOB study then show that the mean realised OTR on the
electronic system collapsed after introduction of the fee. The daily average OTR
shifted down from pre-OTR levels ranging between 30 and 200:1 to a level of 10:1 or
less under the fee. Caivano et al. (2012) also compare the notional fees that would
have been charged under the OTR scheme before its imposition, showing that only
3 firms would have contributed most of the fees and, further, that after the OTR
is introduced, fee revenue drops to more or less zero. Therefore the constraint had
much sharper teeth than financial considerations alone would suggest.
As noted above, the OTR was decided upon by CONSOB. The threat that they
would have asked for the penalties to be stepped up if they were not seen to make a
difference to the behaviour of member firms might have been very real. The exchange
10We are unable to proxy the actual fees levied by the exchange as a result of the ratio as it would
is perfectly able to communicate this to the few members concerned via unofficial
channels. We can only surmise that those few HF firms exceeding the OTR threshold
before the fee have thought it wise not to provoke the regulator into further action.
(They were not completely successful in that respect, though, as Italy introduced a
specific tax on low latency trading in October 2013. We suspect that at the time of
the OTR, the regulators had already sent clear signals to HF participants that they
meant business.)
3.2
Data and sample construction
We build our treated and control samples from the components of the Stoxx Europe
600 index, which comprises large, medium and smaller firms from across the Eurozone.
We select all Italian companies that were constituents of this index as of the beginning
of 2012 and with market caps above Euro 1bn at the beginning of 2012 as our treated
sample. After deleting a small number of stocks that experienced major corporate
actions or have data limitations during our sample period we are left with 51 treated
stocks. Our sample stocks include 38 of the 40 components of the blue chip FTSE
MIB index and taken together, they represent 93.6% of Euro turnover in all 296
listed Italian companies in 2012.11 Hence we can be confident that any economically
significant changes brought about by the OTR will be captured in our sample.
Our control sample serves to separate any effects occurring in Italian stocks from
changes that might impact Eurozone stocks. We select our control stocks from all
French, German, Spanish, Dutch and Belgian constituents of the Stoxx 600 Europe.
Following Davies and Kim (2009), for each treated stock we identify a match that
minimises distance based on mean market cap and turnover in the pre-event period.
We use the Mahalanobis distance metric to match one-for-one and without
replace-ment. Hence our control sample comprises as many stocks as the treated one, i.e.
51. Our samples are very diversified across industries. Panel (a) in Table 1 presents
descriptive statistics for the stocks in the treated and control samples respectively.
Besides the 38 MIB40 components alluded to above, 12 more of our sample stocks
are members of the FTSE Italia Midcap index, and 1 is not in any index. None of
them are small enough to qualify for the FTSE Italia Small Cap, let alone for the
FTSE Italia Micro Cap. Due to the size and composition of the Stoxx Europe 600
index, treated and control stocks are very closely matched, not only on the variables
of market capitalization and turnover that were used for that purpose, but also on
number of trades and, to a slightly smaller extent, on spreads.
The OTR fee was introduced on April 2nd 2012. The event window we focus on covers two calendar months before and after the event, thus comprising over 8,500
stock-days in total (with roughly half of the data points either side of the event).
We do not use an exclusion period based on the results in the CONSOB study that
market Order-to-Trade ratios declined abruptly at the time of the event.12
Over our event window the FTSE MIB index, which includes most of our treated
sample stocks, and the Stoxx Europe 600 index, to which all of our sample securities
belong, showed a moderate downward movement and, more importantly for us, they
were very highly correlated (their daily return correlation was 0.918).
4
Empirical specification
We estimate a difference-in-differences specification, a widely used methodology in
the economic analysis of market reforms and regulatory events. Diff-in-diff estimation
combines a control group with the treated sample to “difference out” confounding
factors and isolate the effect of an event.
We first construct a set of market quality and activity metrics to be used as dependent
variables. For each stock, we use high frequency data to construct daily figures, based
on equally-weighted averages or cumulative sums.13 We build three liquidity and three
12Trading behaviour may have adapted ahead of the event, but removing two weeks of data before
it makes no difference to our results below.
13Examples of recent work that uses similar daily panel modelling of events include Boehmer,
activity measures: the best bid-ask spread (in basis points); the daily average depth
available at the best bid and offer prices, in thousands of Euros; the daily average
cumulative depth up to the 5th price level of the limit order book, again in Euros; the
number of trades (in thousands); the number of quote updates, defined as a change
in either price or size at any of the best five bid or ask levels, again in thousands; the
turnover in millions of Euros. All measures expressed in cash (both depth and the
turnover variables) are scaled by a pre-OTR average turnover figure so as to roughly
equalise the scale of these variables across stocks.14
We regress these dependent variables on a set of treatment indicators that includes a
dummy variable picking out the treated group of Italian stocks (Dtreated), a dummy picking out the period after the OTR fee introduction (DOT R) and the interaction
of those two dummies. If there is any difference in the behaviour of the variable
for main and control sample stocks in the OTR penalty period, it will appear as a
significant coefficient on the (treated × OTR) interaction variable. Thus, denoting
the dependent variable of interest with yi,t, the coefficient (γ3) in the equation below
is the focus of our attention.
yi,t = α+β1RV oli,t+β2T radesi,t+β3M ktCapi,t +β4RelT icki,t
+γ1Ditreated+γ2DtOT R+γ3Dtreatedi,t ×OT R+i,t (1)
We also include a set of control variables. For the liquidity measures, these are
stock-day level return volatility (the sum of intra-day absolute returns expressed in
basis points), trading activity by value and market capitalisation both in millions of
currency units, as well as the relative tick size, equal to the ratio of the tick size on to
the stock’s volume-weighted average price. This latter variable is intended to capture
the constraints that the tick size exerts on liquidity. A large literature shows that
the ratio of the tick size to the stock price affects the spread and quoted depth in
14This is just for ease of interpretation. Our results hold whether depth is rescaled by turnover
opposite directions. When we use an activity measure as dependent variable in (1) the
control variables are volatility and market cap only. Note that, for panel econometric
purposes, all of our control variables vary across both stocks and time. Both volatility
and turnover are rescaled by their pre-event stock-specific means. Market value and
tick size are re-computed on a monthly frequency.
We estimate all panel models using robust covariance matrix estimators that allow for
clustering within stock and within time period (Cameron, Gelbach, and Miller, 2011;
Petersen, 2009; Thompson, 2011). We see no a priori reason to allow for clustering
along other dimensions. The potential cost of using clustered estimation is a loss of
efficiency that will generate excessively lowt-statistics when clustering is not needed.
5
Results
5.1
Liquidity (main market)
Estimation results for the three dependent variables measuring liquidity appear in
Table 2. For ease of interpretation, we have demeaned the control variables prior to
inclusion in the regression. Thus the intercept coefficient combined with the
appro-priate dummy variable coefficients show any shifts that may have occurred in average
values of the dependent variable for the main sample pre and post event and also
for the control sample. The units are common to the sample securities so economic
interpretation of the magnitudes is straightforward.15
Starting with inside spreads as a measure of liquidity, the dummy coefficients show
no statistical difference between treated and control stock spreads prior to the
intro-duction of the OTR. After the OTR event, both control and treated stock spreads
rise, but there is no significant increase in treated stock spread relative to control
stock spreads – the estimated coefficient on the key interaction variable is positive
15As using stock-level fixed effects seemed to make very little difference to our estimates, we
but close to zero. The coefficients on the control variables are all of the expected sign,
where significant. Greater turnover is associated with smaller spreads and stocks with
greater market cap have smaller spreads.
Conversely, analysis of depth shows economically and statistically large effects of the
OTR on treated stock liquidity: the coefficients on the interaction dummies for both
total and inside depth are negative, large and significant. To understand the size of
these coefficients, recall that depth is expressed relative to pre-OTR turnover. Thus,
after the introduction of the OTR penalty, depth at the best drops by around 10%
of average turnover while depth across the first five levels of the order book drops by
approximately a whole day’s turnover. These reductions equate to 20% and 30% of
mean pre-OTR depth respectively.
Thus, as expected, depth outside the best quotes is more strongly affected than depth
at the best, consistent with liquidity suppliers reducing their submission of orders
with low execution probabilities more than they reduce submission of orders at the
front of the book. For both depth regressions, most of the control variables have the
expected sign and are statistically significant. The negative coefficient on market cap
in these regressions is due to the fact that for larger stocks, depth on display in the
order book tends to be smaller as a proportion of turnover than for smaller stocks. If
we run these regressions with raw cash depth as dependent variable, the market cap
coefficients are, as expected, positive (and significant). Finally, unlike spreads, depth
does not change in the control sample in the OTR fee period.
This strong effect on depth is perhaps surprising given that HF liquidity suppliers
are often suspected of not supplying liquidity in size compared to more traditional
liquidity suppliers – partly because their business model involves taking small
inven-tory positions that can be quickly turned around. Our findings, economically the
strongest in our study, suggest instead that HF liquidity suppliers do contribute
sig-nificant displayed depth. The counter-argument could be that much of this depth
may be fickle or even a result of manipulative strategies conducted away from the
because we find that depth declines significantly at the best quotes too, if not by as
much as depth away from them.
5.2
Order book activity (main market)
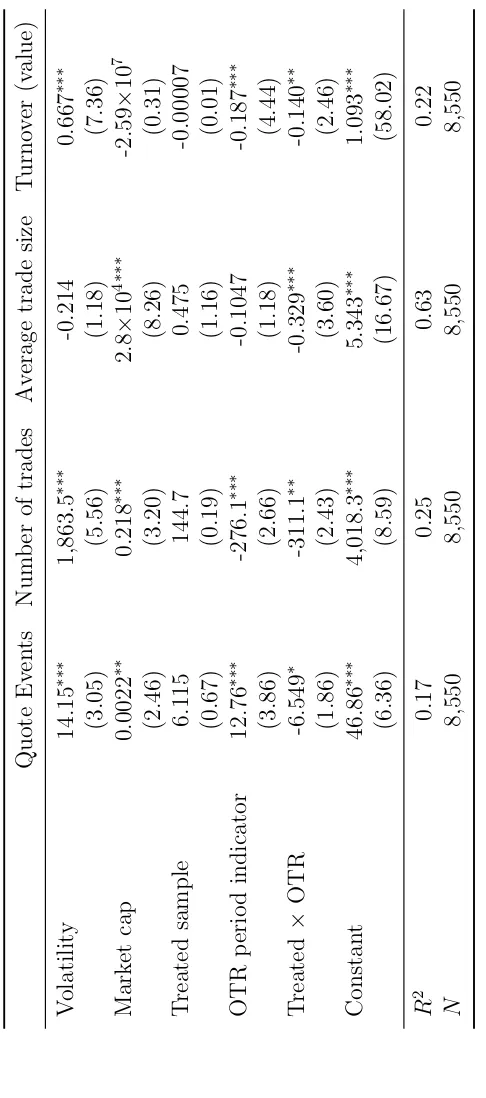
The estimates from the regressions that use measures of quoting and trading activity
on the left-hand side also tend to be consistent with our priors. Results appear
in Table 3, where the units are: thousands of quote events, raw number of trades,
thousands of Euros for trade size and millions of Euros for turnover. Turnover is
rescaled by its stock-level pre-event mean.
Common to the four sets of estimates is the result that prior to the OTR there is
no significant difference between treated and control sample stocks in any of the
dependent variables. After the introduction of the OTR, however, activity patterns
diverge for treated and control stocks. Our treated stocks show significantly smaller
quoting activity, smaller trade size, fewer trades and, thus, lower turnover. The
reductions in trading activity and turnover are both statistically and economically
significant, at around 10% of pre-OTR levels, while those for trade size and quoting
activity are more muted (either economically or statistically). It is likely that these
drops in activity are related to the decreased depth that Italian stock markets display
after the introduction of the OTR fee.
5.3
Liquidity in the cross-section
Is there evidence that the OTR constraint affected our sample stocks differently in
the cross-section? To test this, we split both treated and control samples into two
equally-sized groups, with the separation based on market capitalization. Panel (b)
of Table 1 shows descriptive statistics for these subsamples, for market values and
turnover (the variables used to match the treated and control securities). The match
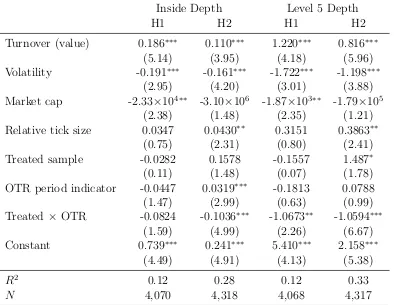
The results for depth at the best quotes for these subsamples, presented in Table 4,
show very large effects for the subsample comprising larger stocks.16 For these stocks, depth at the inside drops by around 40%. There is no significant change in inside
depth for the smaller stock subsample. The same table presents results for the depth
measures across the first five levels of the order book. Here the reduction in depth is
significant for both subsamples, including a fall of around 20% for smaller stocks.
Hence, from Table 4, we knew that the negative effect of the OTR fee operated on
depth and from Table 2 we find that it has a cross-sectional flavour with large caps
more severely affected. This is consistent with the view that HF traders focus on
large, liquid stocks, where frequent information releases allow them to exploit their
latency advantage and active trading renders quick inventory management easier.
In liquid securities, restrictions on order placement activity do not prevent spreads
from reaching competitive levels, but the constraints discourage order placement at
and behind the best quotes, due to those orders’ increased cost and lower execution
probability.
5.4
Price impacts
As Bessembinder and Venkataraman (2010) note, some authors have argued that
the price impacts of trades are the best estimators of realised trading costs. Price
impacts are particularly relevant to institutional traders who have to work large
or-ders gradually on electronic systems. A persistent controversy concerns whether HF
traders conduct “predatory” or “order anticipation” strategies that increased the
ex-ecution costs of worked orders. If the OTR fee limits the ability of fast traders to
re-price or withdraw liquidity as it is demanded, then it may result in less
preda-tion/anticipation, a more stable order book (its avowed goal) and lower price impact.
If, on the other hand, genuine liquidity is only refreshed more slowly under the fee,
then impacts will increase.
16We also tried the subsample analysis for bid-ask spreads but, just as in the full sample, there
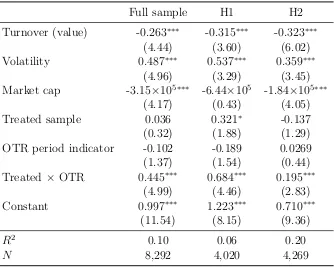
We estimate the 10-trade price impacts and then construct their stock-day averages.
Impact is measured simply as the basis point change in price from one trade before
the current observation to ten trades after. The sign of the impact of sell trades is
reversed so that we would expect mean impact across all trades to be positive.
Table 5 presents diff-in-diff estimation results similar to those previously conducted,
controlling for volatility, turnover and stock size. These impact results provide further
evidence that the OTR penalty reduced liquidity. Price impacts rise significantly for
the aggregate sample and each of the two size-based subsamples. For the aggregate
sample, the rise is around 45%. It is interesting to note here that the change in price
impact post-OTR is greater for smaller stocks. Thus while the effect on depth for
these stocks is more muted, they become much less resilient.
These impact results confirm and complement our earlier results on quoted depth.
First, the large increase in price post-OTR indicates that the depth that was supplied
before the fee was genuine and not purely transient. Second, they show that the
cross-sectional effect of the OTR may depend on the measure of liquidity used. Using
impacts, it’s the smaller stocks in our sample that were most affected by the fee.
5.5
Consolidated order book liquidity and activity
The OTR constraint was enforced on Borsa Italiana only and not on rival electronic
venues, chief of which is Bats/Chi-X. That seems to supply a simple way around the
constraint to high-frequency firms, who could just redirect order flow (both
liquid-ity supply and consumption) towards rival order books devoid of an OTR penalty.
This prompts us to ask whether consolidated market liquidity and activity may have
deteriorated. In Table 6, we present the results of estimation of some of the same
models as in Section 5.1, but with dependent variables constructed from different
data. Now the dependent variables (inside spreads and depth, the number of events
at the inside quotes and total turnover) are constructed from data aggregated across
points between the lowest offer price on any venue and the highest bid and turnover
takes in trading activity across all venues. The number of quote events now looks
at changes in liquidity supply at the best quotes, where the best is defined from all
trading venues. (Thus, these data are in the spirit of those that would be seen by a
smart order-router as in Foucault and Menkveld (2008).)
The first regression shows that spreads for Italian stocks exhibit no significant
in-crease after the implementation of the OTR, similar to the result observed in Table
2 for the main market only. However, consolidated depth in Italian stocks is
signifi-cantly reduced by the OTR just like its main market counterpart. The coefficient is,
in magnitude, only a little smaller than for the main market. This effect is
statisti-cally significant and provides evidence that liquidity supply has not just migrated to
alternative venues with the introduction of the OTR on the main market. Finally,
consolidated turnover also falls significantly post-OTR, by just less than 10%. Thus
while there may have been a small migration of turnover to alternative venues, this
in no way makes up for the decline on the historical exchange.
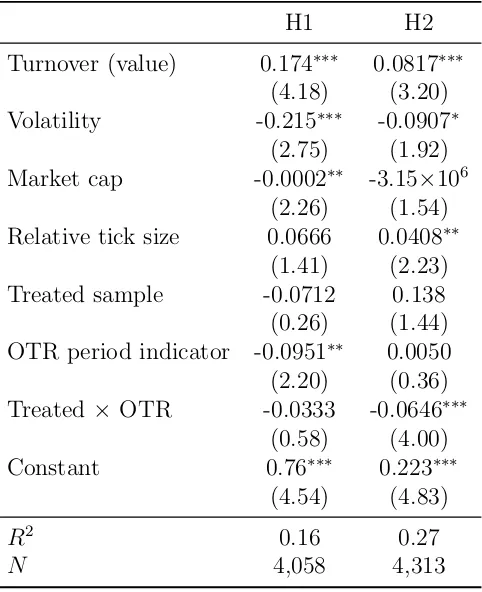
Table 7 shows that the cross-sectional depth results observed in Table 4 also hold
in the consolidated data. The OTR fee significantly reduces the depth available for
trade for the large subsample of Italian stocks. That consolidated depth in large
caps should be reduced to almost the same degree as it was on the main exchange is
striking, given that the market share of the Milan Borsa was smallest in those stocks
(with an unconditional average of 77%) and we might expect liquidity supply and
consumption to move more freely between venues than in smaller caps.
Thus, in sum, there is clear evidence that the OTR has damaged overall liquidity
supply, rather than just supply on the main market. Two interpretations for this
result are possible and they are not mutually exclusive. First, the historical exchange
may entirely dominate price and liquidity discovery and other venues simply cannot
fulfil these roles. Also, there may be institutional impediments to some brokers
executing away from the main exchange that help cement its dominant role.
supply across venues. Our findings are reminiscent of Biais, Bisi`ere, and Spatt (2010),
who study liquidity in US stocks traded on both the Nasdaq and the Island order
book. They find evidence consistent with rent-seeking by a limited number of liquidity
suppliers who effectively make markets on Island as an oligopoly. While they couch
their results in terms of spreads because the event they study is a change in tick
sizes, the same intuition extends to our event and setup which seems to affect depth
throughout the order book. Overall, our findings might be interpreted as suggesting
that impediments to full competition between venues exist, even if we are unable to
say more about their nature.
5.6
Market share of the historical exchange
XXX This section shifted after the previous one.
We finally examine whether imposition of the OTR constraint on the main exchange
has caused some redirection of order flow to the alternative order books by measuring
the market share (in total traded volumes) of the historical exchange in total order
flow by value before and after the event. The deterioration of liquidity observed in
consolidated quotes suggests that the incentives to redirect order flow to alternative
order books may be limited. The pre-event and post event mean market shares,
equally-weighted across stocks for the treated stocks stand at 81.7% and 78.7%
re-spectively. The hypothesis that no change occurred in the Milan pre and post mean
market share is rejected but not strongly, with t-stat of 1.73 (51 observations pre
and post). The same test for our control sample stocks (comparing their respective
main markets with electronic competitors pre and post the introduction of the
Ital-ian OTR) shows no economically and statistically detectable change in the average
market share across the European exchanges involved. The pre-event and post event
means are virtually identical at 66.25 and 66.17% respectively with t=0.039.
The figures suggest that the OTR has caused some redirection of order flow away
weeks is far from trivial, even if it is limited in statistical significance. A caveat is that
for many of the midcaps in our sample, the Milan market retained a near-monopoly
on the trading of Italian shares, with a market share of total turnover by value of
90-100%. The equity market may not have been mature enough in that respect for more
sizeable shifts in order flow to occur. (For comparison, during the same period, the
London Stock Exchange retained marginally more than a 50% share in U.K. equity
turnover).
5.7
Possible effects of an OTR not considered here
Our focus is on measurable, but relatively immediate effects of the OTR on
liquid-ity and activliquid-ity. It may be that longer-term effects also materialise, including some
related to liquidity. The argument has been made that under a slower-moving order
book, the “market ecology” may change in a positive way. O’Hara (2010) or Brogaard
(2011) emphasise that some investors are disturbed by quotes with durations so short
that they are very hard to trade upon. A more stable order book may encourage more
participation on the part of those who are currently deterred by quote “flickering”.
Similarly, it might convince slower liquidity suppliers previously evicted by high
fre-quency players to come back to market and perhaps contribute more depth than HF
agents. Brogaard (2010) finds that HF traders contribute less depth than do slower
liquidity suppliers, consistently with one leg of this argument. Their participation in
liquidity supply may also be more stable than that of HF agents, who are sometimes
accused of “fair-weather” market-making.
Regulators may also have other social benefits in mind when adopting an OTR. One
of them could be the “arms race” argument, analysed for example in the model of
Biais, Foucault, and Moinas (2014), where HF traders increase adverse selection for
slower participants because they process public information faster. By making it
more costly for fast traders to exploit their speed advantages, regulators might be
Either because they are not to do with liquidity or because they seem by their nature
likely to remain very hard to identify empirically, these long-term hypotheses are
outside the scope of our analysis. Note, though, that doubling the duration of our
post-event window to cover four months of the OTR regime makes no difference to
our results.
6
Conclusion
We assess the effect that a measure designed to constrain the order submission
fre-quency of low latency traders has had on liquidity. We find a clear picture of reduced
liquidity supply, with quoted depth affected across the board and dramatically so for
large stocks, whether at the best quotes or beyond. HF firms may be more significant
contributors to depth than previously thought.
We also report that the same changes observed for liquidity and activity on the Milan
exchange extend, albeit with slightly less strength, to a consolidated order book
that includes quotes from rival electronic venues. Depth does not simply migrate to
other order books where the OTR does not apply. We speculate that this negative
externality could have two, not mutually exclusive, explanations – first, the historical
exchange may have retained a completely dominant role in price formation and other
venues feed off prices set on it. Second, there may be rent-seeking on the part of
a limited number of liquidity suppliers who operate across rival electronic systems.
Those market-makers may be able to keep liquidity supply below competitive levels,
as Biais, Bisi`ere, and Spatt (2010) have found in the context of much more liquid US
stocks.
Our study also highlights the extent to which market liquidity may be affected by a
very small number of extremely active participants. A study by the Italian regulators
shows that only three firms out of the roughly 90 member firms that participate in
trading and quoting had OTRs consistently above the fee threshold before it was
effects on liquidity and activity that we detect in our paper. This is consistent with
other evidence such as that in Menkveld (2013), who finds for Dutch stocks that the
entry of one single HF market-maker caused detectable changes to liquidity.
OTR experiments are under way on several exchanges. We are aware of at least one
market that scrapped its OTR only three months after voluntarily introducing it.
On June 1st 2012, the American electronic trading venue DirectEdge put in place a scheme that financially penalised individual firms if they exceeded a monthly average
message-to-trade ratio greater than 100 to 1 under the name of “Message Efficiency
Incentive Program” (MEIP). At the end of August 2012, DirectEdge justified the
removal of its scheme with the SEC in the following terms: “(...) the Exchange
believes that, by not adequately isolating purely inefficient message flow, the MEIP
may have unintentionally captured, and therefore disincentivized, order behavior that
benefits market liquidity. For example, the MEIP potentially discourages market
participants from posting multiple levels of liquidity in less actively traded securities.
Thus, while the Exchange’s intention was to encourage efficiency and consequently
attract more liquidity, the MEIP appears to have resulted in the opposite effect.”17 In an interview, DirectEdge COO Bryan Harkins further commented: “When we
looked at MEIP over a few months, we decided it wasn’t having the effect that we
wanted. (...) people want to make liquidity away from the inside and they want
to create deeper markets. Well, obviously if you’re sending liquidity away from the
inside, that’s additional message traffic but that would be discounting the value of a
deeper order book away from the inside price. Another example is, our market needs
to be able to trade illiquid securities, exchange-traded funds, a lot of these stocks
that don’t trade actively. Oftentimes the market-maker has to update a quote very
frequently.”18 These specific references to a reduction in order book depth beyond
the inside quotes and to a more negative impact on the liquidity of less active assets
appear remarkably consistent with the effects we document.
17Proposed Rule Change by EDGX Exchange, Inc., pursuant to Rule 19b-4 under the Securities
Exchange Act of 1934, 31 August 2012.
References
Bessembinder, H., and K. Venkataraman, 2010, “Bid-Ask Spreads: Measuring Trade Execution Costs in Financial Markets,” in Encyclopedia of Quantitative Finance, ed. by R. Cont. John Wiley & Sons.
Biais, B., C. Bisi`ere, and C. Spatt, 2010, “Imperfect Competition in Financial Mar-kets: An Empirical Study of Island and Nasdaq,”Management Science, 56(12), 2237–2250.
Biais, B., T. Foucault, and S. Moinas, 2014, “Equilibrium Fast Trading,” Working paper.
Boehmer, E., G. Saar, and L. Yu, 2005, “Lifting the veil: An analysis of pre-trade transparency at the NYSE,”Journal of Finance, 60(2), 783–815.
Boulatov, A., B. C. Hatch, S. A. Johnson, and A. Y. Lei, 2009, “Dealer attention, the speed of quote adjustment to information, and net dealer revenue,”Journal of Banking and Finance, 33(8), 1531.
Brogaard, J., 2010, “High Frequency Trading and its Impact on Market Quality,” Working paper.
, 2011, “Minimum quote life and maximum order message-to-trade ratio,” Economic Impact Assessment EIA1,The Future of Computer Trading in Financial Markets, UK Government Office for Science - Foresight.
Brogaard, J., T. Hendershott, and R. Riordan, 2013, “High Frequency Trading and Price Discovery,” Working Paper, http://ssrn.com/abstract=2341037.
Caivano, V., S. Ciccarelli, G. D. Stefano, M. Fratini, G. Gasparri, M. Giliberti, N. Linciano, and I. Tarola, 2012, “High Frequency Trading: Definition, Effects, Policy Issues,” CONSOB (Commissione Nazionale per le Societ`a e la Borsa) Dis-cussion Paper No. 5, December 2012.
Cameron, A. C., J. B. Gelbach, and D. L. Miller, 2011, “Robust Inference with Multi-way Clustering,”Journal of Business and Economic Statistics, 29(2), 238–249.
Chordia, T., R. Roll, and A. Subrahmanyam, 2011, “Recent trends in trading activity and market quality,”Journal of Financial Economics, 101(2), 243–263.
Clark-Joseph, A., 2013, “Exploratory Trading,” Working paper, January.
Colliard, J.-E., and P. Hoffmann, 2013, “Sand in the Chips: Evi-dence on Taxing Transactions in an Electronic Market,” Working Paper, http://ssrn.com/abstract=2215788.
Davies, R. J., and S. S. Kim, 2009, “Using matched samples to test for differences in trade execution costs,”Journal of Financial Markets, 12, 173 ˝U202.
Egginton, J., B. Van Ness, and R. Van Ness, 2013, “Quote Stuffing,” Working Paper, http://ssrn.com/abstract=1958281.
Foucault, T., and A. J. Menkveld, 2008, “Competition for Order Flow and Smart Order Routing Systems,”Journal of Finance, 63(1), 119–158.
Gai, J., C. Yao, and M. Ye, 2012, “The Externalities of High Frequency Trading,” Working paper available at http://ssrn.com/abstract=2066839.
Hagstr¨omer, B., and L. Nord´en, 2013, “The diversity of high-frequency traders,” Journal of Financial Markets, 16(4), 741 – 770.
Hasbrouck, J., and G. Saar, 2013, “Low-latency trading,”Journal of Financial Mar-kets, 16(4), 646 – 679, High-Frequency Trading.
Hendershott, T., C. M. Jones, and A. J. Menkveld, 2011, “Does Algorithmic Trading Improve Market Liquidity?,”Journal of Finance, 66(1), 1–33.
Hendershott, T., and A. J. Menkveld, 2014, “Price pressures,”Journal of Financial Economics, Forthcoming.
Hendershott, T., and P. C. Moulton, 2011, “Automation, Speed, and Stock Market Quality: The NYSE’s Hybrid,”Journal of Financial Markets, 14, 568–604.
Hirschey, N., 2013, “Do High-Frequency Traders Anticipate Buying and Selling Pres-sure?,” Working paper, April, http://ssrn.com/abstract=2238516.
Jorgensen, K., J. Skjeltorp, and B. Odegaard, 2014, “Throttling hyperactive robots -Message to trade ratios at the Oslo Stock Exchange,” Working Paper.
Menkveld, A. J., 2013, “High-Frequency Trading and The New-Market Makers,” Jour-nal of Financial Markets, 16, 712–740.
Menkveld, A. J., and M. A. Zoican, 2014, “Need for Speed? Exchange Latency and Market Quality,” Working paper.
Meyer, S., and M. Wagener, 2013, “Politically Motivated Taxes in Financial Mar-kets: The Case of the French Financial Transaction Tax,” Working paper, http://ssrn.com/abstract=2211748.
O’Hara, M., 2010, “What Is a Quote?,”Journal of Trading, 5(2), 10–16.
Petersen, M. A., 2009, “Estimating Standard Errors in Finance Panel Data Sets: Comparing Approaches,”Review of Financial Studies, 22(1), 435–480.
Table 1: Summary statistics for treated and control sample stocks
Mean Median Std Dev Maximum
(a) Full sample
Treated stocks
Market Cap (C mn) 7085.4 2699.7 11236.3 69058.6
Turnover (C mn) 30.7 10.2 53.6 253.4
Number of trades 3877.8 2327.6 4041.0 19001.7
Spread (b.p.) 13.21 11.64 8.53 42.68
Control stocks
Market Cap (C mn) 6819.1 2639.0 11272.3 70498.8
Turnover (C mn) 36.0 10.3 69.1 409.9
Number of trades 3958.5 2175.7 5201.7 30383.2
Spread (b.p.) 17.20 15.55 8.11 43.89
(b) By sample halves above and below the median
Treated stocks
Market Cap (C mn) H1 1685.3 1386.4 587.1 2699.7
H2 12277.8 7795.9 13963.5 69058.6
Turnover (C mn) H1 4.8 4.1 4.3 16.4
H2 55.9 29.7 66.3 253.4
Control stocks
Market Cap (C mn) H1 1653.9 1352.7 599.7 2809.5
H2 11785.6 6568.8 14193.4 70498.8
Turnover (C mn) H1 8.5 4.8 11.8 46.8
H2 62.0 26.3 89.5 409.9
Table 2: Difference-in-differences regression analysis of the effect of the OTR con-straint on main exchange liquidity
Spreads Inside Depth Level 5 depth
Turnover (value) -3.247∗∗∗ 0.149∗∗∗ 0.987∗∗∗
(5.22) (6.19) (5.65)
Volatility 3.158∗∗∗ -0.156∗∗∗ -1.324∗∗∗
(2.93) (3.67) (3.38)
Market cap -0.0004∗∗∗ -1.07×10⁵∗∗∗ -6.45×10⁵∗∗
(3.98) (2.74) (2.53)
Relative tick size 0.606 0.0318 0.305
(1.32) (1.36) (1.61)
Treated sample 1.140 0.105 0.968
(0.42) (0.87) (1.06)
OTR period indicator 2.105∗∗∗ 0.0066 0.0310
(4.50) (0.53) (0.26)
Treated × OTR -0.720 -0.0895∗∗∗ -0.996∗∗∗
(1.24) (5.01) (6.09)
Constant 15.36∗∗∗ 0.454∗∗∗ 3.52∗∗∗
(9.30) (6.21) (6.39)
R2 0.27 0.16 0.16
N 8,550 8,382 8,382
[image:30.595.120.465.245.540.2]Table 4: Difference-in-differences regression of depth at the best quotes and at the 5th price level, splitting main and control samples into market cap halves
Inside Depth Level 5 Depth
H1 H2 H1 H2
Turnover (value) 0.186∗∗∗ 0.110∗∗∗ 1.220∗∗∗ 0.816∗∗∗
(5.14) (3.95) (4.18) (5.96)
Volatility -0.191∗∗∗ -0.161∗∗∗ -1.722∗∗∗ -1.198∗∗∗
(2.95) (4.20) (3.01) (3.88)
Market cap -2.33×10⁴∗∗ -3.10×10⁶ -1.87×10³∗∗ -1.79×10⁵
(2.38) (1.48) (2.35) (1.21)
Relative tick size 0.0347 0.0430∗∗ 0.3151 0.3863∗∗
(0.75) (2.31) (0.80) (2.41)
Treated sample -0.0282 0.1578 -0.1557 1.487∗
(0.11) (1.48) (0.07) (1.78)
OTR period indicator -0.0447 0.0319∗∗∗ -0.1813 0.0788
(1.47) (2.99) (0.63) (0.99)
Treated × OTR -0.0824 -0.1036∗∗∗ -1.0673∗∗ -1.0594∗∗∗
(1.59) (4.99) (2.26) (6.67)
Constant 0.739∗∗∗ 0.241∗∗∗ 5.410∗∗∗ 2.158∗∗∗
(4.49) (4.91) (4.13) (5.38)
R2 0.12 0.28 0.12 0.33
N 4,070 4,318 4,068 4,317
[image:32.595.97.491.246.551.2]Table 5: Difference-in-differences price impact regression (10 trades), splitting main and control samples into market cap halves
Full sample H1 H2
Turnover (value) -0.263∗∗∗ -0.315∗∗∗ -0.323∗∗∗
(4.44) (3.60) (6.02)
Volatility 0.487∗∗∗ 0.537∗∗∗ 0.359∗∗∗
(4.96) (3.29) (3.45)
Market cap -3.15×10⁵∗∗∗ -6.44×10⁵ -1.84×10⁵∗∗∗
(4.17) (0.43) (4.05)
Treated sample 0.036 0.321∗ -0.137
(0.32) (1.88) (1.29)
OTR period indicator -0.102 -0.189 0.0269
(1.37) (1.54) (0.44)
Treated ×OTR 0.445∗∗∗ 0.684∗∗∗ 0.195∗∗∗
(4.99) (4.46) (2.83)
Constant 0.997∗∗∗ 1.223∗∗∗ 0.710∗∗∗
(11.54) (8.15) (9.36)
R2 0.10 0.06 0.20
N 8,292 4,020 4,269
[image:33.595.126.460.250.517.2]Table 6: Liquidity and activity regressions, consolidated order book
Spreads Inside Depth Turnover (value)
Turnover (value) -0.0285∗∗∗ 0.126∗∗∗
(3.13) (4.62)
Volatility 2.308∗∗∗ -0.120∗∗∗ 0.6068∗∗∗
(2.70) (2.62) (6.29)
Market cap -2.18×10⁴∗∗ -1.10×10⁵∗∗∗ -4.58×10⁷
(2.34) (2.86) (0.61)
Relative tick size 0.364 0.0454∗
(1.13) (1.86)
Treated sample 2.822 0.0852 -0.00017
(1.32) (0.69) (0.02)
OTR period indicator 1.699∗∗∗ -0.0346 -0.165∗∗∗
(3.94) (1.58) (3.94)
Treated × OTR -0.279 -0.0530∗∗ -0.109∗
(0.53) (2.57) (1.92)
Constant 13.30∗∗∗ 0.456∗∗∗ 1.087∗∗∗
(9.98) (5.95) (59.01)
R2 0.26 0.18 0.53
N 8,461 8,378 8,461
Table 7: Inside depth estimation, splitting main and control samples by market cap, consolidated order book
H1 H2
Turnover (value) 0.174∗∗∗ 0.0817∗∗∗ (4.18) (3.20) Volatility -0.215∗∗∗ -0.0907∗
(2.75) (1.92) Market cap -0.0002∗∗ -3.15×10⁶
(2.26) (1.54) Relative tick size 0.0666 0.0408∗∗
(1.41) (2.23)
Treated sample -0.0712 0.138
(0.26) (1.44) OTR period indicator -0.0951∗∗ 0.0050 (2.20) (0.36) Treated × OTR -0.0333 -0.0646∗∗∗
(0.58) (4.00)
Constant 0.76∗∗∗ 0.223∗∗∗
(4.54) (4.83)
R2 0.16 0.27
N 4,058 4,313