1
Kinetics of reduction of a Resazurin-based photocatalytic activity ink
Andrew Millsa*, Nathan Wellsa, John MacKenzieb and Grant MacDonaldb
a: School of Chemistry and Chemical Engineering, Queens University, Stranmillis Road, Belfast, BT95AG
b: Department of Mathematics and Statistics, 16 Richmond Street, Glasgow, G1 1XQ
Abstract
The kinetics of reduction of a Resazurin, Rz, -based photocatalyst activity indicator ink, paii, on a commercial sample of self-cleaning glass, Activ™ is examined; the latter has ca. a 15 nm compact coating of anatase TiO2 which serves as the active photocatalyst layer. The rate of dye reduction is reduced significantly by the presence of ambient O2. In the absence of O2, the measured change in film absorbance due to Rz, dΔAbs/dt, was found to be independent of both [Rz] and film thickness, b. It is shown that this translates to the rate of dye reduction, d[Rz]/dt, being independent of the concentration of the Rz in the ink film, [Rz], and inversely proportional to film thickness, b. The observed kinetics are rationalised in terms of a kinetic model in which the rate determining step is the reduction of photocatalyst surface-adsorbed Rz by photo-generated surface electrons, with all photocatalyst surface sites occupied by Rz. Further work suggests that, if the kinetics of the photocatalysed reduction of the Rz paii were diffusion-controlled, then the decay in [Rz] would be first order and dependent upon b-2.
Key words: Resazurin, Resorufin, photocatalysis, kinetics, inks
*: corresponding author:
Telephone number: +44 (0)289097 4339
2
Introduction
The basic process of most commercial examples of photocatalysis involves the semiconductor (SC)-sensitised oxidation of an undesirable pollutant, P, by ambient oxygen [1], i.e.
SC
P + O2 ⎯⎯⎯⎯⎯⎯⎯⎯→ oxidation products, (1) hν≥ Ebg
where hν is an absorbed photon of energy ≥ the bandgap of the semiconductor, Ebg. Research shows that reaction (1) can be effected for a wide range of species, P, which may be gaseous (e.g. VOCs and NOx), solid (such as: stearic acid and soot) or dissolved in aqueous solution (e.g. 4-chlorophenol or methylene blue) [2]. P can also be a biological species, such as bacteria, viruses, algae or moulds [1,3]. In many cases the pollutant is eventually mineralised; which, in the case of an organic species, involves the production of CO2, H2O and, if hetero atoms are present in the structure, mineral acids [2].
Almost all commercial photocatalytic products use anatase TiO2 as the semiconductor photocatalyst, for which Ebg = 3.2 eV (≡ 388 nm) and so are exclusively UV-absorbing [1,4,5]. Most of these products fall under one, or more, of the following different categories of function: (1) self-cleaning, usually architectural materials, such as paint, coated glass, coated tiles, coated or embedded concrete and coated or embedded fabrics (usually awnings), (2) antimicrobial coatings (usually paints and spray coatings), (3) air purification materials (such as: coated and embedded concrete, coated tiles and porous ceramics), (4) antifogging glass (usually coated mirrors) and (5) water purification systems (usually aqueous dispersions of TiO2 powders) [1,4,5].
3
(MB) test, ISO 10678:2010, [7]) or gas analysers (ISO tests for: NOx (ISO 22197-1:2011 [8]), acetaldehyde (ISO 22197-2: 2011 [9]) and toluene (ISO 22197-3:2011 [10])). As a result, these tests are largely constrained for use in the laboratory only and are not inexpensive to set up and run, both of which provide a barrier to their widespread use.
As part of various efforts to identify faster, simpler, less expensive tests, we have reported previously on a simple, inexpensive method for providing a measure of the
overall photocatalyst activity of photocatalytic films, such as found in commercial self-cleaning glass, paints and tiles [11,12]. In this work, a photocatalyst activity indicator ink, i.e. paii, is used, which comprises: a redox-sensitive dye, Resazurin (Rz), a sacrificial electron donor (i.e. SED, e.g. glycerol) and a polymer, hydroxyl ethyl cellulose (HEC), encapsulating agent [11-13]. This water-based Rz ink is used to coat the photocatalytic film under test so that, upon the subsequent ultra-bandgap irradiation of the photocatalytic sample/dried ink film combination, the photogenerated holes on the photocatalytic film react quickly and irreversibly with the glycerol SED (to form glyceraldehyde/glyceric acid), leaving the photogenerated electrons to reduce the blue-coloured Rz dye to pink-coloured resorufin, Rf. The overall process can be summarised as follows [11-14]:
TiO2
glycerol + Rz ⎯⎯⎯⎯⎯⎯→ glyceraldehyde + Rf (2)
hυ≥ 3.2 eV
Since Rz (blue) and Rf (pink) are differently coloured, it follows that if the material under test is photocatalytically active, then UV irradiation will produce a blue to pink colour change in the ink at a rate that is related to the activity of the photocatalytic film under test. The Rz ink test thus provides both a simple qualitative and quantitative test of overall photocatalytic activity.
4
used for measuring the photocatalytic activities of indoor and outdoor self-cleaning glass, using just a mobile camera and app [16].
To date, much of the focus of paii research has been with regard to finding the best ones for probing the different activities exhibited by the various diverse, popular commercial photocatalytic products, such as glass, tiles, paint, fabric and concrete [13,15]. Interestingly, in most cases, it has been noted that, under normal operating conditions, the kinetics of dye reduction is zero-order with respect to the concentration of the dye in the film [13]. However, the fundamental kinetics of reaction (2) have not been probed in much depth, until recently, with the report of Wang et al. on a transient absorption spectroscopy, TAS, study of thick (ca. 4.4 µm for the anatase film) mesoporous anatase and rutile films coated with the Rz ink [17]. Interestingly, this work revealed that the reaction of the photogenerated holes with the glycerol was much faster (t1/2 < 10µs) than the reduction of Rz (t1/2 ca. 3 ms), which has been, of course, a basic assumption of the paii technology.
5
the photoreduction process due to changes in the concentrations of Dox, Dred and O2 in the ink film. Note that in the case of the Rz paii, it follows that Dox = Rz and Dred = Rf.
In this paper, the steady-state illumination kinetics are reported for reaction (2) on a commercial sample of self-cleaning glass in which the above possible pitfalls are avoided by irradiating the sample through the back of photocatalytic glass, under anaerobic conditions. The kinetic model used to provide a rationale for the observed kinetics is then probed further, through a study of the kinetics as a function of ink film dye concentration and thickness.
Experimental
Materials
All chemicals were purchased from Aldrich Chemicals and used as received. All gases were purchased from BOC. In all the work reported here the commercial, self-cleaning photocatalyst-coated glass used as the photocatalyst test substrate was Activ™, manufactured by Pilkington Glass, which comprises a 15 nm CVD coating of anatase titania on 4 mm window glass coated with a thin barrier layer of silicon carbide [19]. The test pieces, always 25x25 mm square, were cleaned by wiping with a methanol-soaked lens-tissue, before being coated with the Rz-based paii.
Rz Ink preparation and coating
6
practice, this method, which is commonly used in the printing ink industry [20], produces an even coating of the ink over most of the sample, particularly in the central 1 cm2 on the sample, which was then the focus of all spectroscopic measurements. In all cases the ink film was allowed to dry in the dark under otherwise ambient conditions for 60 min before use. The final film thickness for this 'typical' Rz ink film (K-bar 3) was calculated to be ca. 2.1 µm from measurements made on its interference pattern, vide infra. The dye concentration in the film was estimated as: 0.033 M, based on the ink's formulation and a TGA analysis of the dry film, which revealed an remaining %water content = ca. 16 wt%.
Rz ink film irradiation and spectrophotometric monitoring
Before irradiation, the sample under test was placed in a two, diametrically opposed, windowed irradiation cell which was flushed with either air, or – more usually - Ar, both humidified, so that the relative humidity, RH, was 45%, at 21oC. A schematic illustration of the ink-coated sample and cell are given in figure 1.
Figure 1: Schematic illustrations of: (a) Commercial self-cleaning glass sample under test, comprising: (i) 3 mm float glass with (ii) a 15 nm coating of TiO2, on which is deposited (iii) an Rz
ink-coat – typically 2.1 µm thick; (b) the sample irradiation cell, comprising: (i) an in-facing, Rz-ink-coated
glass sample under test, opposite (ii) a plain-glass window, which allows the monitoring light from a spectrophotometer to be transmitted so that absorbance measurements , absorbance = log(Io/IT), can
[image:6.595.79.517.400.660.2]7
The absorbance of the cell was monitored spectrophotometrically through the cell's windows, and all UV/Vis spectra and absorbance values recorded using a Cary 60 UV/Vis spectrophotometer. In all runs, the ink-coated, glass sample under test was used as one of the windows of the cell, with the paii ink film always facing inwards, i.e. towards the ambient gas phase (usually Ar) in the cell. UV irradiation of the photocatalyst sample was always carried out through the back (i.e. ambient air-facing) face of the sample under test. All UV irradiations were performed using two, 4 W black light blue (BLB) lamps, with an emission peak at 368 nm. Each sample under test was irradiated with an incident UV irradiance of 1 mW cm-2.
Results and Discussion
The kinetics of photocatalysed reduction of the Rz dye in a typical Rz ink film
A typical sample of Rz ink film (K-bar 3) on Activ™ self-cleaning glass was irradiated under anaerobic conditions, i.e. under Ar, and the spectral changes recorded as a function of irradiation time are illustrated in figure 2.
Figure 2: Spectral profiles for the photocatalysed reduction of Rz in a typical (K-bar 3) paii, by the underlying TiO2 coating of Activ™ self-cleaning glass, recorded every 60 s, upon irradiation with UVA
[image:7.595.100.480.464.705.2]8
These results demonstrate the smooth photocatalysed conversion of Rz (λmax = 608
nm) to Rf (λmax = 582 nm), via reaction (2), by the self-cleaning glass, Activ™. A brief inspection of the spectral changes illustrated in figure 2 reveals a much smaller second absorption maximum for Rz at 380 nm – which, upon the complete conversion of Rz to Rf, effects an overall change in the absorbance of this typical Rz film at 368 nm (the emission peak of the BLB lamps used) of 0.017, i.e. from 0.239 to 0.212. This change in absorbance equates to an increase in the fraction of UV light transmitted to the underlying photocatalytic film from 57% to 61%, which should have only a small effect on the rate of photocatalysis, if irradiated from above, and none at all if, as here, irradiated from below (and through the back of the glass). Thus, in reaction (2), for a typical Rz ink film (K-bar 3), the change in the concentrations of Rz and Rf during the course of reaction (2), and the overall effect it has on the UV light transmitted to the semiconductor photocatalyst coating, if irradiated through the ink side, are unlikely to produce a significant distortion in the observed kinetics for reaction (2).
9
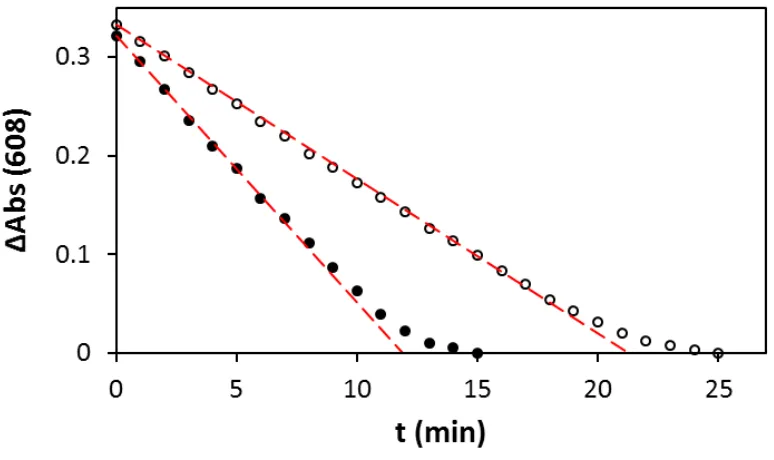
Figure 3 – Decay in absorbance at 608 nm of a typical Rz paii on Activ™ due to Rz reduction via reaction (2), in absence (in Ar, closed circles) and presence of air (open circles). The former data was taken from the spectral data used to construct figure 1. Irradiance = 1 mW cm-2. [Rz]o = 0.033
M; thickness = 2.1 µm.
From the results illustrated in figure 3, it is clear that the rate of reaction (2) is markedly (by ca. 42%) reduced when O2 is present, due to either direct or indirect competition by the O2, with the Rz, for the photogenerated electrons at the TiO2 film. This competition may occur either directly, i.e. via the reaction of dissolved O2 with the photogenerated electrons, i.e.
O2 + TiO2(e-) ⎯⎯⎯⎯⎯⎯→ O2- + TiO2 (3)
or indirectly, given the reduction of Rz to Rf is a two electron process, via the reaction of dissolved O2 with the partially reduced form of Rz, i.e. Rz-:
O2 + Rz- ⎯⎯⎯⎯⎯⎯→ O2- + Rz (4)
[image:9.595.90.477.83.313.2]10
Quantum yield for the photocatalysed reduction of the Rz dye in a typical Rz ink film
The reciprocal length of TiO2 at 368 nm, i.e. α, is ca. 4.3x104 cm-1 [21], and the TiO2 film thickness for Activ™, self-cleaning glass is ca. 15 nm [19]. Thus, the absorbance of the TiO2film at 368 nm will be = 0.434αx15x10-7 = 0.028, and so only ca. 6.2% of the incident 368 nm UV light will be absorbed by the TiO2 film. Since the incident UV irradiance, ρ, was 1 mW cm-2, equivalent to 3.07x10⁻⁹ moles of photons cm-2 s-1, it follows the estimated rate of absorption of the incident UV light will be 1.9x10⁻¹⁰ moles of photons cm-2 s-1. As noted earlier the typical Rz ink film reported
in the previous section had a 'dry' [Rz] = 0.033 M and thickness, b, of 2.1 µm and from the data illustrated in figure 3 for the irradiation under Ar, the rate of Rz destruction was ca. 0.033 M/12.1 min, i.e. 4.4x10⁻⁵ M s-1, which is equivalent to 9.6x10⁻¹² moles cm-2 s-1. It follows that for a typical Rz ink film on Activ™ glass, reaction (2) under Ar has an approximate %quantum yield = 5%. Given that the reduction of Rz to Rf is a two electron process, see reaction (2), it follows that the quantum yield for trapping of photo-generated electrons by the Rz in the ink film is ca. 10%, which is ca. 10 times that measured for the same photocatalytic film when sensitising the mineralisation of stearic acid by O2 [19]. A quantum yield of 10% is quite high for a photocatalytic process, presumably because of the presence of the highly efficient photo-generated hole trap, glycerol. Reflection losses or bulk electron-hole recombination – rather than surface recombination – maybe the main cause for the still low value of 10%, and some support for this comes from the work of Wang et al, on the photocatalytic properties of mesoporous films of TiO2, which will have a much higher surface area/volume ratio than compact films, who report a quantum yield value for reaction (2) of ca. 62% [17].
Effect of [Rz] on the kinetics of photocatalysed reduction of an Rz ink film
The decay profile illustrated in figure 3, for reaction (2) carried out under anaerobic conditions, demonstrates that the kinetics is zero-order with respect to [Rz] in a single kinetic run. However, it is possible that this type of kinetics is the result of some distortion of the initial, actual kinetics due, say, to the accumulation of reaction products, such as Rf and oxidised glycerol.
11
the same K-bar, i.e. K-bar 3, onto Activ™ glass, which contained different levels of Rz, ranging from 1.33 mg (≡ 0.033 M, see above) to 0.25 mg (0.006 M), but with all other components used to make up a typical Rz ink remaining unchanged. The results of this work are illustrated in figure 4 and demonstrate that, as expected, the rate of reaction (2), i.e. the gradient of each of the lines, is approximately the same and independent of [Rz]o, thereby confirming the zero-order nature of the kinetics of reaction (2) with respect to [Rz].
[image:11.595.87.474.377.605.2]Such kinetics are not unprecedented and, for example, have been observed for the photocatalysed mineralisation of films of stearic acid coated onto the surface of mesoporous titania photocatalytic films [22]. Zero order kinetics in photocatalysis are usually associated with systems in which all the photocatalytic sites are occupied, as would seem reasonable in the photomineralisation of a film of stearic acid, or when a very high concentration of oxidisable pollutant is present in solution [23].
Figure 4: Photocatalysed decay in absorbance at 608 nm of a series of Rz paiis with different [Rz]o
values on Activ™ due to Rz reduction via reaction (2). All other conditions were as for a typical Rz paii, including anaerobic conditions and an irradiance = 1 mW cm-2. Film thickness = 2.14 µm and [Rz]o (from top to bottom): 0.033, 0.025, 0.019, 0.012 and 0.006 M, respectively.
It is generally accepted that most examples of semiconductor photocatalysis fit a Langmuir-Hinshelwood type kinetics expression [23], i.e.
12
where P is the surface pollutant (Rz in this case), kobs is the observed rate constant,
and Kobs is the apparent Langmuir adsorption constant. It is also generally accepted
nowadays that for many photocatalytic reactions the values of kobs and Kobs are likely
to be dependent upon the incident irradiance flux (ρ; units: mW cm-2), with k
obs ∝ ρθ
and Kobs ∝ ρ-θ, where 0.5 ≤ θ ≤ 1 [23]. In general, θ values near or equal to 0.5 are found for photocatalytic systems in which the absorbed irradiance flux is large (usually >> 1 mW cm-2), so that electron-hole recombination dominates the photocatalytic process. Similarly, θ values near or equal to unity are found for
photocatalytic systems in which the absorbed irradiance flux is low (usually << 1 mW cm-2), and/or when a very efficient electron or hole trap species is present, so that electron-hole recombination is a minor process.
In the work described here, ρ is fixed (= 1 mW cm-2) and [Rz] is large and so it is
perhaps not too surprising, given the general empirical rate expression eqn (5), that the observed kinetics of reaction (2) is zero-order with respect [Rz], as suggested by the results illustrated in figure 4, since this would follow if Kobs [Rz]>> 1, so that:
Rate (units: M s-1) = -d[Rz]/dt = kobs, (6)
where, kobs is independent of [Rz]. Previous work [12] has established that for
reaction (2), kobs is also proportional to ρ, but directly dependent upon ρ, as might be
expected given the glycerol present, in vast excess in the paii film, is highly effective as an initial surface hole trap, thereby ensuring that direct surface electron-surface hole recombination is a minor process [17].
The parameter, kobs (units: M s-1), is actually a composite of: (i) the ρ dependent
maximum surface photocatalytic rate constant, ks (units: moles cm-2s-1), (ii) the
photocatalyst surface area, A, (units: cm2) and (iii) the ink film volume, V (units: cm3), i.e.:
kobs = ksA/V = ks/b, (7)
where b is the ink film thickness. The above equation predicts the rate (units: M s-1) is independent of [Rz] and inversely dependent upon b.
13
over most of the decay with an average gradient, dΔAbs/dt (units: s-1). From eqns (6) and (7) it follows that:
dΔAbs/dt = -kobs.ε(Rz).b = -1000.ks.ε(Rz),………(8)
where ε(Rz) is the molar absorptivity of Rz at 608 nm (units: M-1cm-1). Thus, according to the above kinetic model, in which rate, d[Rz]/dt, is independent of [Rz] and inversely dependent upon b (see eqns (6) and (7)), it follows that the
measureable kinetic parameter, dΔAbs/dt, will necessarily be independent of [Rz] (as noted earlier), and b (as investigated below), i.e. zero-order with respect to both parameters.
The observation of a zero-order dependence of d[Rz]/dt, or dΔAbs/dt, upon [Rz], as predicted by eqns (6) and (8), respectively, suggests that the reaction is activation-controlled and so NOT dependent upon the rate of diffusion of Rz from the bulk of the ink film to the surface of the photocatalyst. To test this further, a simple diffusion-controlled model was constructed, based on one-dimensional diffusion of a species in a medium (the ink film) bounded by two parallel planes namely: (i) the TiO2 coating/ink boundary, at x = b, and the air/ink film boundary, at x = 0. In this work a normalised time parameter, τ, was defined, where:
τ = t.D/b2, (9)
where, t is the real time and D is the diffusion coefficient of Rz in the ink film. This model is identical in form to that for the desorption of a gas from a medium, for which it can be shown that the average concentration, in this case of Rz, at time, τ, i.e. [Rz]τ
is given by the following expression:
[Rz]τ = [Rz]0 !
!!! 8(πθ)-2exp(-(πθ)2τ/4), (10)
where, [Rz]0 is the concentration of Rz at τ (or t) = 0 and θ = n + 2 [24,25]. Using this
expression, it is possible to construct the plot of the predicted fractional change in concentration of Rz, i.e. [Rz]τ/[Rz]0 as a function of τ, which is illustrated in figure 5,
14
However, if it is assumed that the diffusion constant, D, for Rz in the glycerol-laden
paii, is the same as that of Rhodamine B in glycerol, i.e. ca.10-13 m2s-1 [26] and b =
2.1 µm, then it follows that when τ = 1 and 93% of the Rz should have been converted to Rf, then the actual time should be ca. 44 s (= ca. b2/D), whereas in practice it is found to be nearer 720 s, as illustrated by the results in figure 3. These findings and simple calculations, along with the observed zero-order kinetics help support the suggestion that the observed kinetics for reaction (2) are activation-, and not diffusion-, controlled.
Figure 5: Predicted photocatalysed decay in the fractional change in Rz concentration, i.e. [Rz]τ/[Rz]0, as a function of the unitless time parameter, τ, for a Rz paii on a photoactive film, such as
Activ™, assuming reaction (2) is diffusion-controlled. The data illustrated were calculated using eqn (10). The insert diagram is a first-order plot of the data in the main diagram, which reveals a reasonable fit to first order kinetics.
Effect of Rz ink film thickness, b, on the kinetics of reduction of an Rz ink film
If the kinetics were diffusion-controlled, it might be expected, from eqn (9), that the rate, d[Rz]/dt, will depend directly upon the reciprocal of b2. If, on the other hand, the kinetics were purely activation-controlled and described by eqn (6) then the rate will depend upon b-1, or, more practically, the measured kinetic parameter, d
[image:14.595.89.483.260.488.2]15
[image:15.595.167.434.195.353.2]whilst the latter were obtained from an analysis of the interference patterns exhibited by each of the final, photocatalytically reduced Rz films; the spectra of the reduced forms of the inks were used because the interference bands exhibited by the ink films were more discernible when all the Rz had been converted to Rf.
Table 1: Wet and dry Rz ink film thicknesses deposited using different K-bars
wet film deposit (μm) dry film (μm)
4 0.55
6 0.86
12 1.2
24 2.1
32 3.4
36 3.6
40 4.0
[image:15.595.84.455.468.686.2]The interference method for measuring the thickness of non-tapered, uniform thin films was proposed by Swanepoel [27], who predicted that, such a film would exhibit a spectrum that had a series of interference maxima and minima, as illustrated in figure 6 for a typical (K-bar 3) reduced Rz film on Activ™, with integer, α, values 0, 1, 2, etc, starting from the longest wavelength peak, or trough.
16
Swanepoel showed that, in such a system, α is related to the thickness of the film, b, via the expression [27]:
α/2 = 2b(nf/λ) (11)
Where nf is the refractive index of the film and λ is the wavelength of the peak or
trough associated with the value of α. For example, from the data in figure 6, four α
and λ pairs, were gleaned and then used to generate the subsequent straight-line
plot, illustrated in figure 7, of α/2 vs nf/λ, where nf was taken to be that of glycerol,
i.e. 1.4746 [28]. From the gradient of this plot a value of 2.1 µm was obtained for b
[image:16.595.88.485.329.563.2]for a typical (K-bar 3) film. In this work, the above interference method was used to determine all the 'dry' thicknesses of the Rz films listed in table 1.
Figure 7: Plot of interference data from figure 6 in the form of α/2 vs nf/λ. The gradient (= 2b) of the
line of best fit is 4.2 µm, thus, b = 2.1 µm for a typical (K-bar 3) Rz paii on Activ™. [Rz]o = 0.033 M.
17
[image:17.595.90.478.260.490.2]Each of the Rz films of different thickness, coated onto Activ™ self-cleaning glass, were irradiated and the decrease in the absorbance (at 608 nm) due to the Rz in the ink film was monitored as a function of irradiation time. The results of this work are illustrated in figure 8, and the collection of approximately parallel lines show the measured parameter, dΔAbs/dt, is largely invariant with film thickness, as expected given the rate expression in eqn (8), derived for a system where the rate of dye reduction depends up the surface concentration of Rz, with all adsorption sites occupied.
Figure 8: Photocatalysed decays in absorbance at 608 nm for a series of identical Rz paiis but of different thickness,on Activ™ due to the reduction Rz via reaction (2). All other conditions were as for a typical Rz paii, including anaerobic conditions and an irradiance = 1 mW cm-2. Film's [Rz]o =
0.033 M and thicknesses (from top to bottom): 4.0, 3.6, 3.4, 2.1, 1.2, 0.86 and 0.55, respectively.
Conclusions
18
step is the reduction of surface-adsorbed Rz by photo-generated surface electrons, with all surface sites occupied by Rz. A simple model suggests that, if the kinetics of the photocatalysed reduction of the Rz paii were diffusion-controlled, then the rate of decay in [Rz] would be first order with respect to [Rz] and inversely dependent upon
19
References
[1] A. Mills, S. Lee, J. Photochem. Photobiol. A. 152 (2002) 233-247.
[2] O. Carp, C. L. Huisman, A. Reller, Prog. Solid State Chem. 32 (2004) 33-177.
[3] R. Fagan, D. E. McCormack, D. D. Dionysiou, S. C. Pillai, Materials Science in Semiconductor Processing, 42 (2016) 2-14.
[4] Y. Ohama, D. Van Gemert, Application of Titanium Dioxide Photocatalysis to Construction Materials, RILEM State-of-the-Art Reports 5, 2011.
[5] V. Augugliaro, V. Loddo, M. Pagliaro, G. Palmisano, L. Palmisano, Clean by Light Irradiation: Practical Applications of Supported TiO2, RSC Publishing, Cambridge, 2010.
[6] A. Mills, C. Hill, P. K. J. Robertson, J. Photochem. Photobiol. A. 237 (2012) 7-23.
[7] http://www.iso.org/iso/home/store/catalogue_tc/catalogue_detail.htm?csnum ber=46019 (accessed December 2015).
[8] http://www.iso.org/iso/iso_catalogue/catalogue_tc/catalogue_detail.htm?csn umber=40761 (accessed December 2015).
[9] http://www.iso.org/iso/home/store/catalogue_tc/catalogue_detail.htm?csnum ber=45742 (accessed December 2015).
[10] http://www.iso.org/iso/home/store/catalogue_tc/catalogue_detail.htm?csnum ber=46016 (accessed December 2015).
[11] A. Mills, J. Wang, S. K. Lee, M. Simonsen, Chem. Commun. (2005) 2721-2723.
[12] A. Mills, J. Wang, M. McGrady, J. Phys. Chem. B. 110 (2006) 18324-18331. [13] A. Mills, N. Wells, Chem. Soc. Rev. 44 (2015).
[14] A. Mills, J. Hepburn, D. Hazafy, C. O’Rourke, J. Krysa, M Baudys, M. Zlamal, H. Bartkova, C. E. Hill, K. R. Winn, M. E. Simonsen, E. G. Søgaard, S. C. Pillai, N. S. Leyland, R. Fagan, F. Neumann, C. Lampe, T. Graumann, J. Photochem. Photobiol. A. 272 (2013) 18-20.
[15] A. Mills, J. Hepburn, D. Hazafy, C. O’Rourke, N. Wells, J. Krysa, M. Baudys, M. Zlamal, H. Bartkova, C. E. Hill, K. R. Winn, M. E. Simonsen, E. G.
Søgaard, S. Banerjee, R. Fagan, S. C. Pillai, J. Photochem. Photobiol. A. 290 (2014) 63-71.
[16] A. Mills, N. Wells, J. Photochem. Photobiol. A. 298 (2015) 64-67.
[17] X. Wang, A. Kafizas, X. Li, S. J. A. Moniz, P. J. T. Reardon, J. Tang, I. P. Parkin, J. R. Durrant, J. Phys. Chem. C. 119 (2015) 10439-10447.
[18] D. Ollis, A. Mills, K. Lawrie, Appld. Catal. B. 184 (2016) 201-207. [19] A. Mills, A. Lepre, N. Elliot, S. Bhopal, I. P. Parkin, S. A. O’Niell, J.
Photochem. Photobiol. A. 160 (2003) 213-224.
[20] http://www.rkprint.co.uk/?page_id=10 (accessed December 2015). [21] A. Mills, S. K. Lee, A. Lepre, I. P. Parkin, S. A. O’Niell, Photochem.
Photobiol. Sci. 1 (2002) 865-868.
20
[23] A. Mills, C. O’Rourke, K. Moore, J. Photochem. Photobiol. A. 310 (2015) 66-105.
[24] A. Mills, Q. Chang, Analyst, 117 (1992) 1461-1466.
[25] J. Crank, Mathematics of Diffusion, Clarendon Press, Oxford, 1956. Ch. IV. [26] E. Van Keuren, W. Schrof, Macromolecules, 36 (2003) 5002-5007.
[27] R. Swanepoel, J. Phys. E. 16 (1983) 1214-1222.
[28] https://en.wikipedia.org/wiki/Glycerol (accessed December 2015).
[29] A. Mills, A. Cusick, J. Hepburn, J. Advanced Oxidation Technologies, 12, 2009, 152-157.
[30] A. Kafizas, C. Crick, I. P. Parkin, J. Photochem. Photobiol. A. 216 (2010) 156-166.
[31] A. Kafizas, I. P. Parkin, J. Mat. Chem. 20 (2010) 2157-2169. [32] S. In, P. C. K. Vesborg, B. L. Abrams, Y. Hou, I. Chorkendorff, J.
Photochem. Photobiol. A. 222 (2011) 258-262.
[33] J. Zita, J. Krysa, U. Cernigoj, U. Lavrencic-Stangar, J. Jirkovsky, J. Rathousky, Catalysis Today, 161 (2011) 29-34.
[34] N. Farahani, P. J. Kelly, G. West, M. Ratova, C. Hill, V. Vishnyakov, Thin Solid Films, 520 (2011) 1464-1469.


![Figure 4: Photocatalysed decay in absorbance at 608 nm of a series of Rz paiis with different [Rz]o values on Activ™ due to Rz reduction via reaction (2)](https://thumb-us.123doks.com/thumbv2/123dok_us/1539503.106509/11.595.87.474.377.605/figure-photocatalysed-absorbance-series-different-values-reduction-reaction.webp)