THE EFFECTS OF BODY SIZE AND ORIENTATION
ON ULTRAVIOLET RADIATION EXPOSURE
A.V. Parisi*, M.G. Kimlin*, J.C.F. Wong† and R.A. Fleming†
†
School of Physics, Queensland University of Technology, GPO Box 2434, BRISBANE 4001 AUSTRALIA
*
Abstract
A method has been developed for determining the UV and erythemal exposures to the entire body. The difference between the ambient erythemal exposure and that to the body compared to the ambient exposure may be as high as 76%. The height, orientation, and overall height had a minimal effect on the exposure to the body with size, time of day and time of year having a significant effect. The diffuse component of UV to a side of the body ranged from 20% to 41% between different times of the year with different levels of cloud cover. The ratio of the body to the ambient erythemal exposures varied from 0.24 to 0.61 with the time of day and time of year with the smaller value for periods of high solar altitude.
Introduction
Decreased levels of stratospheric ozone (1) and increased levels of terrestrial UVB (2,3) have been measured. These increased levels of UVB have generated concerns about the resultant deleterious effects on human health. Reviews in the literature list the UV induced immediate reactions as erythema, photodermatoses, keratitis and conjunctivitis with the longer term effects of skin cancer, photo-aging of the skin and cataracts along with the damaging effects to the immune system and DNA (4).
Research into the UV induced effects on humans requires measurement of personal UV exposure. A number of studies have employed UV dosimeters to investigate the UV radiation exposures to selected sites on rotating headform models and on human subjects undertaking a variety of activities (5-8). Alternatively, a UV sensor worn on the lapel or waistband and connected to a portable data logger has been employed to monitor UV exposure rate during a number of outdoor activities (9). The effect of the inclination of the receiving plane on the biologically effective UV has also been investigated (10). These studies have provided the UV exposures to specific sites. However, no information has been provided on the exposure to the entire body. Additionally, the exposures with the headform models make the important assumption that there is no effect due to different body size and orientation. This paper presents a method developed to determine the UV exposure to the entire body and to investigate the effects of the body size and orientation on the UV exposure.
will be employed to study the effects of size and orientation. Polysulphone dosimeters will be deployed at a number of sites on rectangular prisms of various sizes and orientations and which represent models of human bodies. The UV and erythemal exposures to each site will be interpolated between sites and summed over the shape to provide the total exposure to the body.
Materials and Methods
Calibrations
Polysulphone in thin film form of the order of 40 μm thick was employed for the UV dosimeters (11-13). The polysulphone dosimeters (supplied by A Davis, 3 Cumley Rd., Toothill, Ongar, Essex, CM5 9SJ, UK) consisted of the film mounted in cardboard holders 30 x 30 mm with an active area of 16 x 12 mm. As a result of UV exposure, the polysulphone photodegrades and this is quantified by measurement of the change in optical absorbance (ΔA) at 330 nm. In this research, to standardise the read out times, the optical absorbance was measured with the spectrophotometer (Shimadzu Co., Kyoto, Japan) immediately pre and post exposure in order to eliminate errors due to a continued increase of absorbance in the dark post exposure (12). For consistency, all of the exposures were performed with the polysulphone on a white backing.
measure UV exposures with acceptable accuracy provided they are calibrated. In this paper, the polysulphone dosimeters will be employed to measure autumn solar exposures and the dosimeters have been calibrated against a spectroradiometer to autumn sunshine.The spectroradiometer is based on a double UV holographic grating monochromator (Jobin-Yvon, model DH10, 16-18 rue du canal 91163 France) with calibration traceable to the primary Australian standard lamp housed at the National Measurement Laboratory, CSIRO, Lindfield (14). A number of polysulphone dosimeters were exposed on a horizontal plane within 30 cm of the input aperture of the spectroradiometer from 08:48 to 12:36 Eastern Standard Time (EST). The UV spectrum was measured with the spectroradiometer at 12 minute intervals and a polysulphone dosimeter was removed at each 12 minute interval. As a result, polysulphone dosimeters were exposed for various periods ranging from 12 minutes to 3.8 hours from early morning to noon. The spectral irradiance, S(λ,t) was converted to a UV exposure over a time interval, T, by:
(1)
UV T S( ) d dt
uv
=
∫ ∫
0 λ,t λ
where the integration is the summation between the wavelengths 280 to 340 nm. These limits were employed as the solar irradiance is zero at 280 nm and the response of polysulphone is zero at 340 nm (13). The erythemal biologically effective UV (UVBE) was also calculated from the spectral irradiance by:
(2)
UVBE T S( )A( d dt
uv
=
∫ ∫
0 λ,t λ λ)
In order to compare the exposures of the models of the bodies with the ambient exposures, the output of an IL1400 (International Light, Newburyport, MA) radiometer with a SEL400 photodetector and filter was calibrated against the irradiance measured with the spectroradiometer. The two measurements were made on the same plane and within 30 cm of one another.
Preliminary Exposure
Exposures
Models of the human body with the sizes and orientations in Table 2 were exposed in an open area. To prevent shading, the shapes were spaced several metres apart as shown in Figure 2. The sizes and orientations were selected to investigate the effects of: the height of the body off the ground; the overall height of the body; the shape of the body and the orientation of the body relative to north. The exposures were performed on a cloud free autumn day on 18 April in Toowoomba. The times of the exposures were 09:00 to 10:00, 12:00 to 13:00 and 15:00 to 16:00 EST for the morning, noon and afternoon exposures with average solar zenith angles for each period of 52o, 40o and 65o respectively.
The exposures at each dosimeter site were employed to calculate the exposure to the entire body (16). The computer software developed divides each side into elements and the exposures at each dosimeter site are interpolated, firstly, vertically and secondly, horizontally to provide the exposure at each element followed by summation to calculate the total exposure to each side. The number of elements in the vertical and horizontal directions was taken as thirty. From previous research (16), this was considered as adequate with a higher number of elements not producing a significant change in the result. For the top side, the exposure at the single site multiplied by the surface area provided the exposure to that side. Summation of the exposures to each side and the top and divided by the total surface area provided the exposure (total exposure/surface area) to the body.
determine the UV reflectivity of the ground by measuring the downward and upward fluxes.
Results
Calibrations
The calibration curve of polysulphone for erythemal exposure is provided in Figure 3. A similar curve was obtained for calibration for UV exposures between 280 and 340 nm. The slope of these dose response curves decreases for ΔA values above 0.3. For values of ΔA less than 0.3, previous research in the literature (17) has determined an error of about 10% in the UV exposures obtained.
Preliminary Exposure
The UV and erythemal exposures to the body calculated employing the individual exposures at each site are shown Table 3. These exposures are divided by the surface area. The errors in these exposures and in the next Section are taken as 10%. The ambient exposures have been taken as those measured with the dosimeters at the top site of the body. The ratios of the UV and erythemal exposures to the body compared to the respective ambient exposures are also shown in Table 3. From these results, the difference between the ambient erythemal exposure and the exposure to the body compared to the ambient exposure is 76%.
Exposures
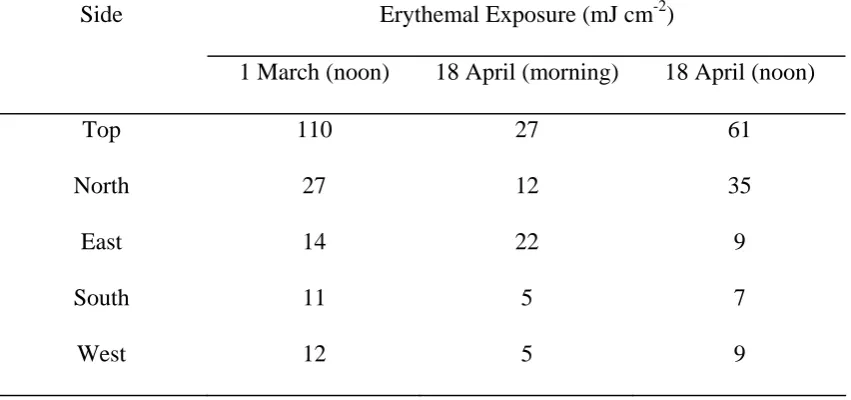
exposures to each side calculated from the exposures to the individual sites and divided by the surface area of the respective side. For the 1 March and noon on 18 April, the north side of the body is exposed to sun and the south side is in full shadow. Nevertheless, the south side receives an appreciable amount of erythemal exposure as a result of the high component of diffuse or scattered UVB. On the 1 March, the south side receives 41% compared to the north side and for noon on 18 April, the south side receives 20% compared to the north side. For the morning on 18 April, the east side is in direct sun and the west side is shadowed. The west side receives 23% of the erythemal exposure compared to the east side. The higher diffuse component on 1 March may be attributed to the additional scattering by the three octas cloud cover compared to zero cloud cover on 18 April.
The UV and erythemal exposures to the body for each of the shapes are presented in Table 5 with the erythemal exposures plotted in Figure 4. Shape 3 (square shape) receives a higher exposure in the morning and noon exposures with no significant difference in the afternoon. The larger exposure for the first two periods are most likely due to the square shape providing a larger proportion of its surface area to the direct solar UV. The difference in exposure to this shape is not significant in the afternoon. This is likely to be due to the low solar zenith angle and corresponding low solar irradiances at this time.
ground reflectance (10). The orientation of the shapes had negligible effect on the exposure to the body with only a minimal difference in the exposures to shapes 1, 5 and 6 with the large side facing north, east or north-east.
The ambient UV and UVBE exposures at each period were taken as the average measured with the polysulphone dosimeters at the top side of each body and are provided in Table 6. This Table also provides the ambient UV exposure measured with the IL1400 radiometer and these agree with the dosimeter values within the 10% error margin. For the noon period, the standard error in the ambient UV exposures measured with the dosimeters is 6%. This verifies that the ambient exposure is uniform over the exposure area.
atmosphere along with any possible changes in UV reflective structures and ground cover.
This variation in the difference between the ambient and the body exposures occurs not only with different times of the day, but also with different times of the year. For example, from Table 3 and Table 5, the erythemal exposure to the body for shape 5 with the small side facing north varies from 26.9 to 19.2 mJ cm-2 for 1 March and 18 April respectively. In contrast, from Table 4, the ambient erythemal UV varies from 110 to 61 mJ cm-2. The ambient UVBE exposure for the one hour period decreased by 45% compared to the 1 March from early to late autumn whereas the UVBE exposure to the body decreased by only 29%.
Conclusions
This paper has presented a method developed to determine the UV and erythemal exposures to the entire body. The UV and erythemal exposures were measured with polysulphone dosimeters at a total of 17 sites over a human body model and from these the total exposures to the body have been calculated. The accuracy of these exposures to the body is 10% or better. The difference between the ambient erythemal exposure and the exposure to the body compared to the ambient exposure may be as high as 76%.
The effects of body size and orientation on the UV exposures have been investigated by undertaking a series of exposures of model shapes and determining the UV exposures to the entire body. Measurement of the exposures to the individual sides with different azimuth angles relative to north found a variation of 20% to 41% between different days in the diffuse component of UV. This highlights the complexity and randomness of the incoming UV radiation.
The ratio of the body to the ambient exposures varied with the time of day and time of year. For the exposures in this research, this ratio varied from 0.24 to 0.61 with the smaller value for periods of high solar altitude, for example, noon. This variation is due to the multifactorial influence of changes in solar zenith and azimuth angles, clouds, transmission properties of the atmosphere and reflective structures and ground cover. This research highlights the differences that exist between the ambient exposures and the exposures to the body and that it is impossible to undertake one measurement with a radiometer or dosimeter at one site and relate this to the exposure to the body.
Acknowledgements
References
1. Stolarski R, Bojkov R, Bishop L, Zerefos C, Staehelin J, Zawodny J. Measured trends in stratospheric ozone. Science 1992: 256: 342-349.
2. Blumthaler M, Ambach W. Indication of increasing solar ultraviolet-B radiation flux in alpine regions. Science 1990: 248: 206-208.
3. Kerr J B, McElroy C T. Evidence for large upward trends of ultraviolet-B radiation linked to ozone depletion. Science 1993: 262: 1032-1034.
4. Ambach W, Blumthaler M. Biological effectiveness of solar UV radiation in humans. Experientia 1993: 49: 747-753.
5. Airey D K, Wong J C F, Fleming R A. A comparison of human- and headform- based measurements of solar ultraviolet B dose. Photodermatol Photoimmunol Photomed 1995: 11: 155-158.
6. Herlihy E, Gies P H, Roy C R, Jones M. Personal dosimetry of solar UV radiation for different outdoor activities. Photochem Photobiol 1994: 60: 288-294.
7. Wong C F, Fleming R A, Carter S J, Ring I T, Vishvakarman D. Measurement of human exposure to ultraviolet-B solar radiation using a CR-39 dosimeter. Health Phys 1992: 63: 457-461.
9. Diffey B L. Behaviour outdoors and its effects on personal ultraviolet exposure rate measured using an ambulatory datalogging dosimeter. Photochem Photobiol 1995: 61: 615-618.
10. Schauberger G. Model for the global irradiance of the solar biologically-effective ultraviolet-radiation on inclined surfaces. Photochem Photobiol 1990: 52: 1029-1032.
11. Davis A, Deane G H W, Diffey B L. Possible dosimeter for ultraviolet radiation. Nature 1976: 261: 169-170.
12. Diffey B L. Ultraviolet radiation dosimetry with polysulphone film. In: Diffey B L, ed. Radiation measurement in photobiology. New York: Academic Press, 1989: 136-159.
13. CIE (International Commission on Illumination) Technical Report: Personal dosimetry of UV radiation, 1992: Publication No. CIE 98.
14. Wong C F, Toomey S, Fleming R A, Thomas B W. UV-B radiometry and dosimetry for solar measurements. Health Phys 1995: 68: 175-184.
15. CIE (International Commission on Illumination) Research Note: A reference action spectrum for ultraviolet induced erythema in human skin, 1987: CIE J 6: 17-22.
16. Parisi A V, Wong C F. A dosimetric technique for the measurement of ultraviolet radiation exposure to plants. Photochem Photobiol 1994: 60: 470-474.
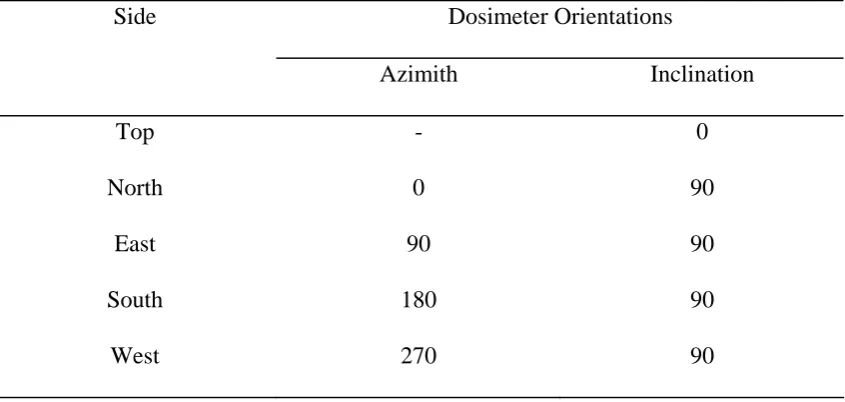
Table 1 - The dosimeter orientations on each side of the body with the azimuth angles relative to north, and the inclination angles relative to the horizontal.
Side Dosimeter Orientations
Azimith Inclination
Top - 0 North 0 90
East 90 90 South 180 90
Table 2 - The lengths, widths, heights, overall heights and orientations of the six shapes.
Shape Number
Length x width x height (m)
Overall Height (m)
Orientation
1 0.2 x 0.4 x 0.45 1.35 Large side facing North 2 0.2 x 0.4 x 0.45 0.685 Small side facing North 3 0.4 x 0.4 x 0.45 1.35 Side facing North 4 0.2 x 0.4 x 1.20 1.35 Small side facing North 5 0.2 x 0.4 x 0.45 1.35 Small side facing North 6 0.2 x 0.4 x 0.45 1.35 Large side facing NE & SW,
Table 3 - The UV and erythemal exposures to the entire body along with the ratio of the body to ambient exposures for the 11:00 to 12:00 EST exposure on 1 March.
UV UVBE Body/Ambient
(J cm-2) (mJ cm-2) UV UVBE
Table 4 - Erythemal exposures to each of the sides of the body with the small side facing north for the 1 March and the morning and noon exposures on 18 April.
Side Erythemal Exposure (mJ cm-2)
1 March (noon) 18 April (morning) 18 April (noon)
Top 110 27 61
North 27 12 35
East 14 22 9
South 11 5 7
Table 5 - The UV and erythemal (UVBE) exposures to the entire body for each shape for the morning, noon and afternoon exposures on 18 April.
Shape Morning Noon Afternoon
UV (J cm-2)
UVBE (mJ cm-2)
UV (J cm-2)
UVBE (mJ cm-2)
UV (J cm-2)
UVBE (mJ cm-2) 1 1.17 12.4 1.99 22.2 0.49 4.8 2 1.25 13.2 1.78 19.7 0.57 5.7 3 1.62 17.6 2.08 23.3 0.50 4.9 4 1.36 14.4 1.53 16.7 0.48 4.7 5 1.30 13.8 1.74 19.2 0.40 3.8
Table 6 -The erythemal and ambient UV exposures measured with the polysulphone dosimeters at the top side of the bodies and with the calibrated IL1400 radiometer for each of the periods.
Morning Noon Afternoon Polysulphone IL1400 Polysulphone IL1400 Polysulphone IL1400
UVBE (J cm-2)
UV (J cm-2)
UV (J cm-2)
UVBE (J cm-2)
UV (J cm-2)
UV (J cm-2)
UVBE (J cm-2)
UV (J cm-2)
UV (J cm-2)
Table 7 - Ratios of the erythemal exposures to the body compared to the ambient erythemal exposure for the 18 April.
Shape Body/Ambient
Morning Noon Afternoon
1 0.43 0.35 0.52
2 0.46 0.31 0.61
3 0.61 0.37 0.53
4 0.50 0.27 0.51
5 0.48 0.30 0.41
Figure 1 - Diagram of the model of a body with the dosimeters attached at the selected sites.
Figure 2 - Photograph of the models with the dosimeters.
Figure 3 - Calibration of the polysulphone dosimeters relating the change in absorbance, ΔA to the erythemal exposure.