Computer Confidence, and Attitudes to the Use of Technology for
Learning Mathematics
Gerard J. Fogarty, Patrica Cretchley, Chris Harman, Nerida Ellerton, and
Nissim Konki
University of Southern Queensland
fogarty@usq.edu.au; cretchle@usq.edu.au ; harman@usq.edu.au ;
ellerton@usq.edu.au; konki@usq.edu.au
This study reports on the validation of a questionnaire designed to measure general mathematics confidence, general confidence with using technology, and attitudes to the use of technology for mathematics learning. A
questionnaire was administered to 289 students commencing a tertiary level course on linear algebra and calculus. Scales formed on the basis of factor analysis demonstrated high internal consistency reliability and divergent validity. A repeat administration confirmed the earlier psychometric findings as well as establishing good test-retest reliability. The resulting instrument can be used to measure attitudinal factors that mediate the effective use of technology in mathematics learning.
Background
One of the promising avenues for improving the learning experience of
mathematics students has to do with the use of increasingly sophisticated mathematics software packages now widely available. Cretchley, Harman, Ellerton, and Fogarty (1999) investigated the use of MATLAB as an aid to learning algebra and calculus at first year university level. Through a series of interviews and focus group discussions they established that a clear majority of students valued the use of MATLAB.
Frequent references were made to greater clarity of understanding, the benefits of added visualisation, and to the speed with which graphing and computation is accomplished. On the negative side, not all students felt that they were sufficiently computer literate when they commenced the course and some felt the technology experience was too big an extra load. Despite attempts to encourage students engaged in this trial to learn some concepts at the computer, many expressed strong preference for mastering the basics away from the computer, some verbalising feelings of
value of technology in the learning of mathematics. To capitalise on the opportunities provided by these packages, it is necessary to first understand the attitudes of students not only to mathematics, but also to technology and, in particular, the use of
technology in learning mathematics (Galbraith, Haines, & Pemberton, 1999). The present study reports on the development and validation of an instrument that can be used to measure these key psychological constructs. The instrument is called the Attitudes to Technology in Mathematics Learning Questionnaire (ATMLQ).Unlike existing scales that contain separate measures of attitudes to computers and attitude to mathematics learning, the ATMLQ targets the tertiary population and includes a scale that is designed to capture attitudes to situations wherein students are expected to use computers to learn mathematics (Cretchley et al., 2000).
Research Design and Methodology
Participants
The participants were students at the University of Southern Queensland enrolled in the course Algebra and Calculus 1 in the first semester of 1999. A total of 289 students (249 males) completed the survey before the commencement of the course. Of these, 166 came from Engineering, 63 from Science, and 60 from other faculties. All but 23 came from English-speaking backgrounds. Of this initial sample of 289 students, 184 (158 males) completed a follow-up survey at the end of the semester: 110 from Engineering, 40 from Science, and 34 from other faculties.
At both the commencement and the end of the semester, survey forms were handed to on-campus students and mailed to all external students enrolled in the course. Participation was not compulsory.
Materials
A total of 37 items were developed to assess students’ mathematics
confidence, their computer confidence, and their attitudes to the use of technology in learning mathematics. All items employed a Likert-style response format, with options ranging from 1 (Strongly agree), 2 (Agree), 3 (Neutral), 4 (Disagree), to 5 (Strongly disagree). All three scales used a mixture of positively and negatively worded items, with the majority of items having a negative orientation, thus reflecting the primary concern of most educators, which is the possible handicapping effect of negative attitudes towards computers and mathematics.
The 11 items chosen to measure mathematics confidence came from an experimental scale developed by Fogarty and Taylor (1997) as part of their research on the impact of learning styles on achievement in mathematics. Items for the computer confidence scale used the same stems as the items included in the mathematics confidence scale, with the word “computers” substituted for
“mathematics”. Thus, “It takes me longer to understand mathematics than the average person” (Mathematics Confidence) became “It takes me longer to understand
computers than the average person” (Computer Confidence). To address the need for a scale that focussed specifically on attitudes to mathematics/technology interaction, the authors constructed 15 items that concentrated on the students’ feelings about situations wherein technology is used as a tool to learn mathematics. Note that the term “technology” was used in most items to convey that calculators were included along with computers.
In addition to the three attitudinal variables already described, when
biographical information and to serve as markers for further scales that were related to the aims of the broader research (Cretchley, Harman, Ellerton, & Fogarty, 2000). When these sections were combined, the questionnaire comprised 68 items. The main aim of the present paper was to assess the construct validity of the attitudinal scales and to determine their reliability.
General Findings
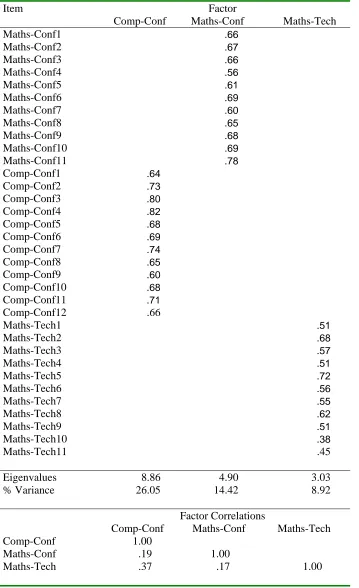
Following data screening, principal axis factoring with oblique rotation was used to establish the factorial validity of the scales. Root one criterion yielded 7 factors accounting for 61% of the variance. Inspection of the scree plot, however, suggested that a three-factor solution provided an acceptable solution, accounting for 48% of the variance. Because a three-factor solution corresponded with the expected number of factors, a second analysis was conducted requesting extraction to stop at this point. The resulting factor pattern identified dimensions relating to Computer Confidence, Mathematics Confidence, and attitude towards use of technology in learning mathematics (Maths-Tech).
Table 1
Factor Pattern Matrix for Attitude to Technology in Mathematics Learning
Questionnaire (Pre-test)
Item Factor
Comp-Conf Maths-Conf Maths-Tech
Maths-Conf1 .66
Maths-Conf2 .67
Maths-Conf3 .66
Maths-Conf4 .56
Maths-Conf5 .61
Maths-Conf6 .69
Maths-Conf7 .60
Maths-Conf8 .65
Maths-Conf9 .68
Maths-Conf10 .69
Maths-Conf11 .78
Comp-Conf1 .64
Comp-Conf2 .73
Comp-Conf3 .80
Comp-Conf4 .82
Comp-Conf5 .68
Comp-Conf6 .69
Comp-Conf7 .74
Comp-Conf8 .65
Comp-Conf9 .60
Comp-Conf10 .68
Comp-Conf11 .71
Comp-Conf12 .66
Maths-Tech1 .51
Maths-Tech2 .68
Maths-Tech3 .57
Maths-Tech4 .51
Maths-Tech5 .72
Maths-Tech6 .56
Maths-Tech7 .55
Maths-Tech8 .62
Maths-Tech9 .51
Maths-Tech10 .38
Maths-Tech11 .45
Eigenvalues 8.86 4.90 3.03
% Variance 26.05 14.42 8.92
Factor Correlations
Comp-Conf Maths-Conf Maths-Tech
Comp-Conf 1.00
Maths-Conf .19 1.00
Maths-Tech .37 .17 1.00
Correlations among these factors suggested that Maths Confidence was weakly related to Computer Confidence (r = .19, p < .01) and Maths-Tech (r = .17, p < .01) and that the last two factors were moderately related (r = .37, p < .01).
In the next stage of analysis, items from Table 1 were used to form separate scales preparatory to investigating means, standard deviations, and reliabilities of the scales. Distributional properties of the three scales were satisfactory with means around the midpoints and scores normally distributed. Cronbach alpha internal consistency reliability estimates for all scales were satisfactory, ranging from .84 for Maths-Tech, .89 for Maths Confidence, to .92 for Computer Confidence.
Post-Course Survey
The next stage of the validation process involved the analysis of the data collected from the 184 students who returned survey forms for the second
administration at the end of the course. The correlation matrix obtained from the 34 items was again subjected to principal axis factoring using oblique (oblimin) rotation with a three-factor solution requested. The resulting pattern matrix is not reported but was almost identical to that shown in Table 1. A solution approximating simple structure was achieved with all items loading on the same factors as in the pre-test. Factor intercorrelations were almost identical to those obtained for the pre-test. Scale scores were again computed and internal consistency reliability checks conducted. Cronbach alpha values were 0.90, 0.92, and 0.90 for the Maths Confidence, Computer Confidence, and Maths-Tech scales respectively. These values were all well above frequently cited benchmark values for internal consistency reliability (e.g., Nunnally & Bernstein, 1994).
The final analyses were directed at determining the test-retest correlations. In many situations these correlations serve as useful indicators of the stability of scores over time. The highest test-retest correlation was for the general Computer
Confidence scale (r = .78, p < .01), closely followed by the Mathematics Confidence scale (r = .73, p < .01). The correlation was lower for the Maths-Tech scale (r = .54, p < .01). This last scale was the one most targeted by the intervention used in the present study (see Cretchley et al., 2000) and it is not surprising that the test-retest correlations were weakest here.
Summary and Conclusions
Acknowledgements
The research reported in the paper was supported by a University of Southern Queensland Project Team research grant.
A full report on the validation of this questionnaire is available from the first author.
References
Cretchley, P., Harman, C., Ellerton, N., & Fogarty, G. (1999). Computation,
exploration, visualisation: Reaction to MATLAB in First Year Mathematics. 2nd Australian Symposium on Modern Undergraduate Mathematics,
Proserpine, Qld, Australia.
Cretchley, P., Harman, C., Ellerton, N., & Fogarty, G. (2000). MATLAB in Early Undergraduate Mathematics: An Investigation into the Effects of Scientific Software on Learning. Mathematics Education Research Journal, 12 (3), 219-233.
Fogarty, G., & Taylor, J. (1997). Learning styles among mature-age students: Some comments on the Approaches to Studying Inventory (ASI-S). Higher
Education Research and Development, 16 (3), 321-330.
Galbraith, P., Haines, C., & Pemberton, M. (1999). A tale of two cities: When mathematics, computers, and students meet. In J. M. Truran & K. M. Truran (Eds.), Making the difference (pp. 215-222). Sydney: Mathematics Education Research Group of Australasia, Inc.
Appendix A
Attitudes to Technology in Mathematics Learning Questionnaire
The following statements refer to your confidence when learning mathematics. 1. I have less trouble learning mathematics than other subjects.
2. When I have difficulties with mathematics, I know I can handle them. 3. I do not have a mathematical mind.
4. It takes me longer to understand mathematics than the average person. 5. I have never felt myself able to learn mathematics.
6. I enjoy trying to solve new mathematics problems. 7. I find mathematics frightening.
8. I find many mathematics problems interesting and challenging.
9. I don’t understand how some people seem to enjoy spending so much time on mathematics problems.
10. I have never been very excited about mathematics. 11. I find mathematics confusing.
The following statements refer to your confidence when using computers.
1. I have less trouble learning how to use a computer than I do learning other things. 2. When I have difficulties using a computer I know I can handle them.
3. I am not what I would call a computer person.
4. It takes me much longer to understand how to use computers than the average person. 5. I have never felt myself able to learn how to use computers.
6. I enjoy trying new things on a computer. 7. I find having to use computers frightening.
8. I find many aspects of using computers interesting and challenging.
9. I don’t understand how some people can seem to enjoy spending so much time using computers.
10. I have never been very excited about using computers. 11. I find using computers confusing.
12. I’m nervous that I’m not good enough with computers to be able to use them to learn mathematics.
The following questions refer to the way you feel about computers and graphics calculators in the learning of mathematics. [The word technology is used here to mean computers and graphics calculators].
1. Computing power makes it easier to explore mathematical ideas.
2. I know computers are important but I don’t feel I need to use them to learn mathematics. 3. Computers and graphics calculators are good tools for calculation, but not for my learning of
mathematics.
4. I think using technology is too new and strange to make it worthwhile for learning mathematics.
5. I think using technology wastes too much time in the learning of mathematics.
6. I prefer to do all the calculations and graphing myself , without using a computer or graphics calculator.
7. Using technology for the calculations makes it easier for me to do more realistic applications. 8. I like the idea of exploring mathematical methods and ideas using technology.
9. I want to get better at using computers to help me with mathematics.
10. The symbols and language of mathematics are bad enough already without the addition of technology.
11. Having technology to do routine work makes me more likely to try different methods and approaches.