Response Bias in Computerised Tests
Gerard J. Fogarty
Unniversity of Southern Queensland Toowoomba, Australia, 4350
This research was supported by a USQ internal grant.
Full reference: Fogarty,G. (1999). Response bias in computerized tests.
Abstract
Choosing a response format is a problem when designing computerised tests. Programmers often solve this problem by highlighting a response option and allowing the user to select this option or choose another by using the cursor keys. It is possible that such well-meaning attempts to make computers more user-friendly may heighten response style tendencies. The two experiments to be reported in this study were designed to test the effect of cursor positioning in personality and ability tests. In the first experiment, sixty two Participants were randomly assigned to two groups and asked to complete computerised versions of Forms A and B of the Eysenck Personality Inventory. The position of the
highlight was manipulated to produce a two-by-two factorial design with repeated measures on one factor. Results showed that there was evidence of a cursor effect but that it was confined to one of the conditions in the design. Experiment two employed the same sort of manipulation in a computerised version of the ACER Word Knowledge Test with another sample of 36 participants. Here, no evidence was found for any effect of cursor positioning. Overall, it was concluded that the highlighting technique itself is unlikely to have any effect on measures of
Response Bias in Computerised Tests
Testing was one of the earliest areas within psychology to benefit from computer applications with standardised, objective-type personality tests being particularly well-suited to automation (Bartram & Bayliss, 1984; Butcher, 1985; Butcher, Keller & Bacon, 1985). Initially, interest focussed on automated scoring but later expanded to include the computerised administration of existing pencil-and-paper tests (Bartram & Bayliss, 1984; Booth-Kewley, S., Edwards, J.E., & Rosenfeld, P., Butcher, 1985). Currently, almost every facet of personality testing has been computerised, from test design and development, through item
generation and analysis, to test interpretation and report generation (Roid, 1986). In a typical computerised test presentation, individual questions or stimuli are presented on a video display unit (VDU) attached to the computer, a set of limited responses is offered, and test-takers record their selected response via a keyboard or some other interface (Butcher, Keller & Bacon, 1985). The advantages of this form of administration over conventional administration are well-documented in several reviews (e.g., Bartram & Bayliss, 1984; Erdman, Klein & Greist, 1985; Butcher, Keller & Bacon, 1985).
The move from paper-and-pencil tests to computer-based formats, however, represents a major shift in the way tests are administered and it is important that research is conducted to check the equivalence of the two methods. Work has already started in this area, especially on the equivalence of paper-and-pencil versus computerised presentation. Reviews of these studies report
conflicting findings, with many uncontrolled variables influencing the outcomes (e.g., Burke & Normand, 1987; Webster & Compeau, 1996). Within the
computerised testing domain itself, there is also scope for research. One area which is currently under-researched is the possible effects of computerisation on response sets. Despite claims that there is no bias that is unique to computer administration (Moreland, 1986) and that the effects of response sets may even be minimised or better assessed using computer presentation (Ben-Porath & Butcher, 1986; Davis & Cowles, 1989; Huba, 1986), it may be the case that in our attempts to make computers user friendly, we have introduced techniques which favour response biases not present in paper-and-pencil versions of that same test.
Among the studies that have looked at aspects of this topic, there is some evidence indicating the existence of unique computer response sets. It has been noted, for example, that different computer versions of the same test can produce significant differences in scores, apparently related to the stimulus or procedural differences in the two versions (Hedlund, 1988). It has also been found that subtle differences between test versions may produce large differences in scores
including, for example, an option which must be actively accepted or rejected on the computer, but which may be scored by the absence of action in conventional administrations (Moreland, 1986). Most (1987) also proposed that subtle
differences in presentation, such as flashing a confirmation of the selected response, can have specific, anxiety-arousing effects. Referring to psychological tests, several authors (Duthie, 1984; Johnson and Johnson, 1981) have suggested that the human-computer interface is a likely source of increases in error patterns or response sets. More specifically, Wood (1984 cited in Wilson, Genco & Yager, 1985) has proposed that test scores may be influenced by the format of
Highlighting is one very popular, apparently inert technique that is often employed on the VDU interface to aid in the selection of response alternatives (Galitz, 1987). For example, with a simple Yes/No response choice, both "Yes" and "No" may be shown in text on the screen. However, it is common for one response to be highlighted initially. For example, "Yes" may be surrounded by a different colour or inverse-video, indicating to the test-taker that the "Yes" response is currently selected, and that some further action is necessary to select "No". It is possible that the initial position of the highlight over one response alternative might influence Participants to respond in that direction. Liefeld
(1988) dubbed this the "initial cursor placement effect". A technique introduced to improve the human-computer interface may inadvertently prove to be a source of response bias. The most important ramification of such a response set would be the generation of a test score which was inaccurate and which precipitated unwarranted action on the part of the psychologist.
An example of a computerised test that uses such a response format is the Self-Directed Search: Computer Version 3.0 (1989). In the Self-Estimates section of this computerised version of a popular career selection inventory, there are actually 7 possible responses, all of which are listed in column format on the screen. The cursor rests over the number "4", which is the middle of the response range and if the subject is not happy with this reponse, he/she must use the cursor keys to move the highlight to the desired response before pressing the return key. The question is: does the use of the highlight in this fashion predispose the subject to accept the default response, "4"?
The present study set out to test the effect of highlighting on the frequency with which a highlighted response was selected in comparison with
non-highlighted response options. Two separate experiments were conducted, each involving a different type of psychological test. In the first experiment, a well-known personality test was adapted for computer presentation. The second experiment used a test of cognitive ability.
Experiment 1
Method
Participants
Sixty-two final year psychology students from the University of Southern Queensland participated in this experiment for course credit. The students were randomly assigned to two groups with equal numbers in each group.
Materials
The test chosen was the Eysenck Personality Inventory (EPI) developed by Eysenck and Eysenck (1964). It has parallel forms, A and B, and uses a two-response forced-choice format. Both forms comprise 57 items: 24 of these measuring Extroversion, 24 Introversion, the remaining 9 items making up a Lie scale. These inventories were programmed in BASIC for computerised
familiarised with the crucial parts of the keyboard and the method of selecting responses was also included.
Experimental Design
Students were randomly assigned to one of the two experimental conditions. These conditions varied only in the position of the highlight over a response alternative. For the first group, the highlight was positioned over "Yes" for the Form A questions, then over "No" for Form B. This order was
counterbalanced for the second group who had "No" highlighted on Form A, and "Yes" on Form B. Tests were presented in the same order with Form A followed by Form B. Each statement was presented individually, in lower case letters, in the top half of the screen. Simultaneously, the response alternatives were visually presented in upper case in the bottom half of the screen with the highlight
positioned over one alternative. Figure 1 shows how the display appeared to the participants. Participants were required to select and record their choice by positioning the highlight over their desired response (moving the highlight if necessary), and then pressing the return key. Once the return key had been pressed, the next question was presented. Participants were able to revise already completed questions.
Figure 1. Illustration of screen layout for Experiment 1.
11. Do you like going to parties?
YES
Use the ← → keys to make your selection and then press ↵
Dependent Variables
The Extroversion (E) score contains a mixture of "Yes" (15) and "No" (9) responses with a score of 9 if all items were answered "No", and 15 if all were answered "Yes". The most attractive feature from the point of view of this study lies in the manner in which the Neuroticism (N) scale is scored. All of the 24 responses that contribute to the N score require a "Yes" response. If there is a bias towards "Yes", then the N scores will be artificially inflated. In the extreme
situation, if a testee were to respond "yes" to every question, he/she would receive the maximum N score. If there is a bias towards "No", on the other hand, the N scores will be lower than they would otherwise be. This is true for both Forms A and B. Thus, the expectation was that Participants would make more "yes" responses when the highlight was positioned over this alternative and that this greater acquiescence tendency would lead, in turn, to a greater N score.
Results
Table 1 shows the means and standard deviations for the Neuroticism scores in each of the experimental conditions before standardisation.
Table 1
Means and Standard Deviations of Neuroticism Scores as a Function of Experimental Condition and Version of the EPI
Group Form A Form B
M SD M SD
1 14.00 4.24 14.65 4.21
2 10.55 4.24 13.16 4.34
It can be seen that both groups show an increase in scores from Form A to Form B. This is to be expected because there is a difference of about two points between the norms for the two forms of the EPI with Neuroticism tending to be about two points higher on Form B. To overcome this, all scores were
standardised using the population parameters given in the manual before conducting analyses of differences between means. It can also be seen that the mean score for Group 2, which had the highlight resting on “N” in Form A, was lower than the mean score obtained by Group 1, which completed this form with the highlight resting on “Y”. The Mean scores were much closer on Form B.
To test whether these differences were significant, the MANOVA
procedures from SPSSx were used to conduct a 2 x 2 factorial analysis of variance with repeated measures on one factor. There was an interaction, F(1, 60 = 5.61, p < .05, that was explained by the significant difference between groups on Form A, F (1, 60) = 10.26, p<.01, and their equivalence on Form B, F (1, 60) = 1.87, p >.05. Group 1 achieved a higher score than group 2 on Form A, as anticipated, but did not show any decline in N scores in Form B when the highlight was positioned over the "No" response. Group 2 showed the anticipated increase in N scores on Form B when the highlight was placed over the "Yes" response. Scores on the E and L scales were also analysed, however they showed no evidence of any cursor effect and are not reported here.
Discussion
not occur, mostly because the first group did not show a decline in use of the “Y” key, even though it was no longer highlighted.
A possible explanation is that, having induced a response tendency on Form A, the reversal of the highlight had no effect thereafter. The most probable explanation for the findings reported here is that the positioning of the highlight over "Yes" had an effect when it was the first condition the Participants
encountered. Shifting the highlight to cover the "No" response at the mid-point of the test, however, did not alter this particular response pattern. In other words, it becomes difficult to reverse this acquiescence tendency immediately by trying to induce a tendency to say "no" in the same testing session. Petty and Caccioppo (1981) suggest that this is likely to happen: having responded "yes" to one set of questions, they report that Participants are likely to do the same for a second set. Initially encountering a highlight on the "No" key, however, does not seem to have any effect at all on response pattern. The score obtained by Group 2 on Form A is about what is reported in the Test Manual for a group of College students. Nor did this group show any tendency to drastically increase the proportion of “Y” responses when this key became highlighted in the second session of the testing: the increase in N scores from Form A to Form B is about what one would expect given the generally higher norm scores on Form B.
Experiment 2
The use of a personality measure to assess response bias can be justified on the grounds that personality tests are often selected for computer presentation. When addressing the issue of response bias, however, it could be argued that people are likely to be more influenced by format when responding to personality questionnaires than to other types of tests, such as measures of cognitive ability, where there is likely to be more ego involvement and where the responses are more factual. Other researchers have reported that factual measures are less affected by modes of administration (Rosenfeld et al., 1991; Webster & Compeau, 1996). The second experiment in this series was therefore designed to check for evidence of cursor-induced response bias in a standard measure of cognitive ability.
Method
Participants
A total of 36 participants (24 females), most of whom were first year Psychology students seeking course credit, agreed to attend a testing session at the University of Southern Queensland. Ages ranged from 18 to 45 years.
Materials
Experimental Design
The test was divided into two equal-length forms on the basis of odd- and even-numbered questions. Thus, Form A consisted of all the odd-numbered and Form B of the even-numbered questions. Two versions of each form were developed for computerised presentation. For the first form, the stimulus word appeared in the middle of the computer screen, with the response words set out below, each with a number (1-5) beside it. Participants were required to type the number beside the correct option, much as they would do in the paper-and-pencil version. This version of each form is hearafter referred to as the "Keypress" version. The second version of each form used a similar format except that no numbers appeared beside the options. Instead, the cursor rested over the first of the options and the participant was required to move the cursor key to select some other response and then press the return key to make an answer. This is called the "Cursor" version.
To overcome possible differences in test forms, participants were randomly allocated to one of two groups. For the first group (N = 23), the Keypress version of Form A was presented, followed by the Cursor version of Form B. For the second group (N = 13), the Cursor version of Form A was presented, followed by the Keypress version of Form B. This counterbalancing resulted in a 2 x 2 design involving both a repeated measures and a between-groups factor.
Two dependent variables were derived. The first was the mean number correct, with a maximum possible score of 50 for each cell. This constituted an indirect measure of response bias because in the Cursor version of each form, the cursor always rested on the first of the five response options, but in each form this option is correct less than 20% of the time. In other words, someone choosing this option too often is going to get a lot of items wrong. Other summary statistics examined included the variance and the reliability of the forms under the different conditions. The reliability should be lower if the positioning of the cursor affects responses. The second dependent variable was the actual frequency with which response option one was chosen. If the positioning of the cursor has any effect, option one should have been chosen more often in the Cursor than in the Keypress versions of the forms.
Results
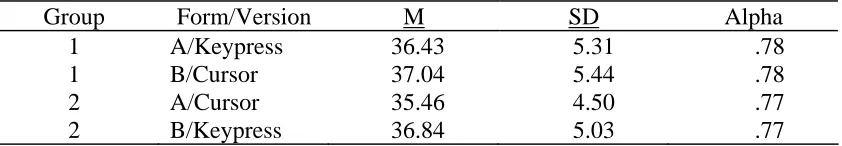
Although they are not direct measures of response bias, the first data presented describe the means, standard deviations, and Cronbach alpha
[image:8.595.108.529.687.760.2]reliabilities of Forms A and B under each of the Keypress and Cursor conditions. As mentioned above, if the means, variances, and reliabilities are the same across the cells, it is unlikely that the use of a cursor has had any effect. These statistics are shown in Table 2.
Table 2
Descriptive Statistics for Conditions of Experiment 2
Group Form/Version M SD Alpha
1 A/Keypress 36.43 5.31 .78
1 B/Cursor 37.04 5.44 .78
2 A/Cursor 35.46 4.50 .77
Table 2 shows that the statistics are remarkably similar within each group for different versions and different forms of the test. If the cursor position had any influence on performance, the means, standard deviations, and reliabilities of the middle two rows in Table 3 (cells 2 and 3 in Table 2) would have been affected. A visual inspection of the table shows that this was not the case. A repeated
measures MANOVA was conducted using SPSS for Windows to test for an interaction between the factors shown in Table 2. Evidence of a cursor effect would show as a significant interaction term. The test for an interaction was not significant, F (1, 34) = .499, p = .485. A more direct test of the effect of using a cursor and positioning it over one of the response options is to count the number of times that option was selected in each of the conditions. If positioning of cursor had an effect, option one would have been chosen more often in the Cursor
condition. Again, this would show as an interaction between the factors shown in Table 2. There was no evidence of this occurring, F (1, 34) = .054, p = .817.
The test used in this experiment also allowed investigation of one other possible condition under which cursor positioning might cause response bias. As mentioned previously, the items in this test become increasing difficult towards the end. This characteristic allowed a check of whether or not participants showed a tendency to accept the cursor positioning when they were forced to guess. To explore this possibility, two regression analyses were conducted using SPSS. The first regression tested whether or not item numbers could predict the frequency with which option one was selected in the Cursor condition. Because the higher item numbers were more difficult, a tendency to select option one more often when attempting the higher-numbered items would yield a negative slope
coefficient. The second regression analysis involved the calculation of individual mean item difficulty estimates (proportion correct) and using these as predictors of the frequency with which option one was chosen. Again, if people tend to accept the cursor positioning when items are very difficult, a negative slope coefficient would be obtained.
Before attempting the regression analyses, item difficulties were checked to ascertain whether the later items were indeed more difficult. Line plots of item difficulty indices (proportion correct) showed that the line had a strong negative slope (p < .05) with the later items proving to be much more difficult than the earlier ones. However, neither of the regression analyses showed any evidence of a tendency to rely on cursor positioning when answering the more difficult items.
General Discussion
test, where responses are made largely on a subjective basis, and a cognitive ability test, where responses are made on objective grounds.
The findings of the first experiment suggest that cursor positioning can have some effect. Making the strongest possible case for the non-equivalence point of view, one could argue that this experiment has shown that the simple positioning of a highlight on one member of a response set has led to significant differences between groups on one of the forms of a well-known personality test. The difference, in raw score terms, is of the magnitude of one standard deviation and even if one allows that the effect might be half this size, on a trait such as Neuroticism, the difference might lead to different diagnoses and
recommendations. Against this, one could argue that the conditions of this experiment were somewhat contrived and it was only with the N scores that the effect was noted. It could also be pointed out that a deliberate attempt was made to maximise the experimental effect by choosing a test with an unusual balance of "yes" and "no" responses in the scoring key. It is not common to find tests where all items tapping a particular trait (N) are associated with a "yes" response. Such a combination of circumstances is unlikely to occur very often in practice and the effect noted in the first experiment should lend confidence to the view that, on personality inventories at least, people will respond in a "true" fashion regardless of the software design.
Experiment 2 was based on a smaller number of observations (N = 36) but using a repeated measures design the experiment was still powerful enough to detect a weak to moderate effect. The findings suggest very strongly that cursor manipulation has not had the slightest effect in a test that measures cognitive ability. Means were almost identical in all conditions. The choice of cognitive test used in Experiment 2 also allowed for the possibility of the effect emerging only under conditions where the participant might be forced to guess, but even here there was no evidence of bias. The robustness of cognitive measures to
manipulations of response formats extends the findings of previous researchers who have noted the resistance of other types of factual information to this kind of manipulation (Liefeld, 1988; Rosenfeld et al., 1991).
Overall, the findings of this study tend to favour the view that there is little risk of introducing response bias by using the cursor positioning technique, either in personality testing or in ability testing. The "cursor problem" (Webster & Compeau, 1996, p. 568) is therefore not a problem. Interestingly, Liefeld (1988), who is credited by Webster and Compeau (1996) with coining the term "initial cursor placement effect", also failed to find any evidence of the effect in his survey of shopping consumers.
effect is virtually non-existent, except in one condition of the experiment involving a personality measure.
The use of a personality and a cognitive ability test, however, does not rule out the possibility that cursor position may induce bias in other forms of testing. The individual had something at stake in both of the tests used in the present study, a favourable personality profile on the one hand and a favourable ability profile on the other. The individuals also knew the experimenter and may have felt disposed to comply with the standard request to consider all responses
carefully. Had the respondents been answering an anonymous survey that was not a personal assessment of some kind, they may have accepted the default position of the cursor much more readily. More research is needed on the nature of the tests and the relation of the test data to the respondent.
The other major factor that was not taken into consideration in this study was the role of individual differences. All respondents were university students who had some familiarity with computers. They were also familiar with the aims and purposes of the types of tests used. In most senses, they constituted a
sophisticated sample. The findings of the present study do not rule out the possibility that certain groups in the population, highly anxious people for example, may be much more influenced by cursor position. Thus, the search in future may not be for evidence that people in general are unaffected by
manipulations such as cursor positioning but rather a search for groups of people who are influenced and a search for the limits to which we can manipulate formats before effects reliably emerge.
References
Bartram, D., & Bayliss, R. (1984). Automated testing: Past, present and future. Journal of Occupational Psychology, 57, 221-237.
Ben-Porath, Y. S., & Butcher, J. N. (1986). Computers in personality assessment: A brief past, an ebullient present, and an expanding future. Computers in Human Behaviour, 2, 167-182.
Booth-Kewley, S. Edwards, J.E., & Rosenfeld, P. (1992). Impression
management, social desirability, and computer administration of attitude questionnaires: Does the computer make a difference? Journal of Applied Psychology, 77, 562-566.
Burke, M.J., & Normand, J. (1987). Computerised psychological testing:
Overview and critique. Professional Psychology: Research & Practice, 18, 42-51.
Butcher, J. N. (1985). Introduction to the special series. Journal of Consulting and Clinical Psychology, 53, 746-747.
Cronbach, L. J. (1949). Essentials of Psychological Testing. New York: Harper & Bros.
Davis, C., & Cowles, M. (1989). Automated psychological testing: Method of administration, need for approval, and measures of anxiety. Educational and Psychological Measurement, 49, 311-321.
Duthie, B. (1984). A critical examination of computer-administered psychological tests. In M. D. Schwartz (Ed.), Using Computers in Clinical Practice (pp. 135-139). New York: The Haworth Press.
Erdman, H. P., Klein, M. H., & Greist, J. H. (1985). Direct patient computer interviewing. Journal of Consulting and Clinical Psychology, 53, 760-773. Eysenck, H. J., & Eysenck, S. B. (1964). Eysenck Personality Inventory.
Hawthorn, Victoria: Australian Council For Educational Research. Galitz, W. O. (1987). Screen Design. Melbourne: Management Technology
Education Pty. Ltd.
Hedlund, J. L. (1988). Mental health computing in Great Britain. Computers in Human Services, 3, 5-27.
Huba, G. J. (1986). The use of the runs test for assessing response validity in computer scored inventories. Educational and Psychological
Measurement, 46, 929-932.
Johnson, J, H. & Johnson, J. N. (1981). Psychological considerations related to the development of computerized testing stations. Behaviour Research
Methods and Instrumentation, 13, 421-424.
Liefeld, J.P. (1988). Response effects in computer-administered questioning. Journal of Marketing Research, 25, 405-409.
Moreland, K. L. (1986). Computer-assisted psychological assessment in 1986: A practical guide. Computers in Human Behaviour, 1, 221-233.
Most, R. (1987). Levels of error in computerised psychological inventories. Applied Psychology: An International Review, 36, 375-383.
Petty, R. E., Caccioppo, J.T. (1981). Attitudes and persuasion: Classic and contemporary approaches. Dubuque, Iowa: W.C. Brown.
Roid, G. H. (1986). Computer technology in testing. In B. S. Plake & J. C. Witt (Eds.), The Future of Testing. New Jersey: Lawrence Erlbaum Associates. Rosenfeld, P., Giacalone, R.A., Knousf, S.B., Doherty, L.M., Vicino, S.M.,
Webster, J., & Compeau, D. (1996). Computer-assisted versus paper-and-pencil administration of questionnaires. Behavior Research Methods,
Instruments, & Computers, 28 (4), 567-576.