Fracture Toughness of Phenol Formaldehyde Composites Reinforced with E-spheres
H. Ku*#, F Cardona*, N Pattarachaiyakoop# and M Trada#
#
Faculty of Engineering and Surveying, University of Southern Queensland, Australia; *
Centre of Excellence in Engineered Fibre Composites, University of Southern Queensland, Australia.
Ku, H, Cardona, F, Pattarachaiyakoop, N, Trada, M and Rogers, D, Fracture Toughness of Phenol Formaldehyde Composites Reinforced with E-spheres, Journal of Composite Materials, April 2009, Vol. 43, No. 7, pp.741 – 754.
Corresponding Author:
Title : Dr.
Name : Harry Siu-lung Ku
Affiliation : Faculty of Engineering and Surveying, University of Southern Queensland. Tel. No. : (07) 46 31-2919
Fax. No. : (07) 4631-2526
E-mail : ku@usq.edu.au
Abstract: A commercial phenol formaldehyde based resole thermosetting resin supplied by Borden Chemical Australia Pty. was reinforced with ceramic-based fillers (SLG) to increase
its fracture toughness. This is the second study of the same series. By testing fracture
toughness and viscosity at a range of filler addition levels, the optimal addition of SLG was
determined in terms of workability, cost and performance. The composites obtained were
post-cured in conventional oven as in the previous study. The original contributions of this
paper include lowering the cost of the composite (35% w/t of SLG) by 50 % but at the same
time its the fracture toughness was reduced only by 20 % (compared to the neat resin), and
increasing the fire resistance of the resins tremendously. It was also found that the values of
fracture toughness of the samples in this study were higher than those obtained in the
previous study when the percentage by weight of SLG varies from 0 to 35%. The shapes of
the plots of fracture toughness against percentage by weight of SLG were also different. The
possible reasons for the differences were explained.
Keywords: Phenol formaldehyde, phenolic resin, microwaves, envirospheres, SLG, short bar test and viscosity.
1. Introduction
Phenolic thermosetting materials were amongst the first major polymeric material used by
industry. They are still among the most widely used thermosetting resins due to their
excellent high temperature and fire performance. Phenolics are formed from the
condensation of polymerization reaction between phenol and formaldehyde. The
condensation reaction for phenolics can be carried out under two different conditions,
and the other novolacs [1, 2]. The single-stage resole resins do not liberate ammonia during
or after moulding, and are preferred for applications in which metal corrosion or odour may
be a concern. In addition, they show good resistance to stress cracking in parts that are wet
on one side and dry on the other. Two-stage novolac resins are the most widely used and
offer wider moulding latitude, better dimensional stability, and longer shelf life than resole
materials. In this study, resole resin was used.
The various fillers used can vary from 50 to 80 % by weight. The fillers reduce shrinkage
during molding, lower cost and improve strength. They are also used to improve electrical
and thermal insulating properties and chemical resistance [1-4]. The high cross-linking of the
aromatic structure (Figure 1) produced high hardness, rigidity and strength combined with
good heat and electrical insulating properties. Because of high impact strength required in
the applications of this composite, it was decided to use SLG to fill the phenolic resin. Some
of the various types of phenolic moulding compounds are [3]:
General purpose compounds. These materials are usually wood flour-filled to
increase impact strength.
High-impact strength compounds. They are usually filled with cellulose (cotton,
flock and chopped fabric), mineral and glass fibres to provide impact strength of up to
961 J/m.
High electrical insulating compounds. These materials are mineral- (e.g., mica) filled
to increase electrical resistance.
Heat-resistant compounds. They are mineral- (e.g., asbestos) filled and are able to
withstand long-term exposure to temperatures of 150 to 180 oooC.
This research project is aimed at investigating the fracture toughness of a commercial resole
percentage by weight is varied from 0 to 35%. Short bar testing has been used to determine
the fracture toughness of the specimens in this work [5-7]. The advantages and methods of
using short bar tests were provided by the literature. On account of its simplicity and
advantages, they were used in this project.
2. Materials
The commercial resole resin used in this study was J2027and manufactured by Borden
Chemical Pty. Its official name is now Hexion Cellobond J2027L because the company had
been taken by Hexion [8]. The acid catalyst used to crosslink the resin was Hexion Phencat
15 [9]. The molecular weight of the commercial resin used is approximately 600 and its
functionality 2, one on each end of the molecule. The ratio by weight of the resin to hardener
for all samples in this work was chosen to be 50: 1. In the previous study the ratio was 20:1
as the resin used in the previous study was much more viscous.
The polymer based on phenolic resin is Phenol-formaldehyde (PF). The PF resins are formed
by the reaction of phenol with formaldehyde. By varying the reaction time, reaction
temperature, catalyst type, and the ratio of formaldehyde to phenol, a number of adhesive
systems with different characteristics can be produced.
A disadvantage of phenolic resins is that they are characterized by a complex process of
polymerization (cure) with generation of water and formaldehyde, with consequent formation
of voids. Therefore, the processing of phenolic materials requires careful temperature control
defects in final components. Normally the time required for these operations is incompatible
with common industrial process schedules.
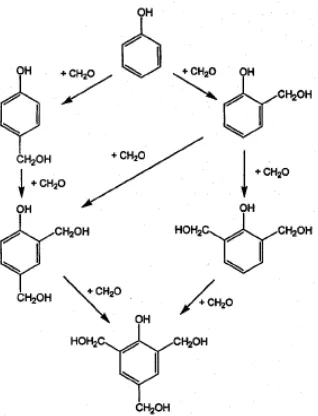
Initially formaldehyde reacts with phenol to form hydroxymethyl derivatives preferentially at
the aromatic ring carbon para to the phenolic hydroxyl as depicted in Figure 1. As the
reaction proceeds, substitutions also take place between the hydroxymethyl groups and the
aromatic ring carbons of phenol or another hydroxymethyl group to form methylene linkages.
In this manner, the polymeric structure of the resin shown in Figure 2 is produced.
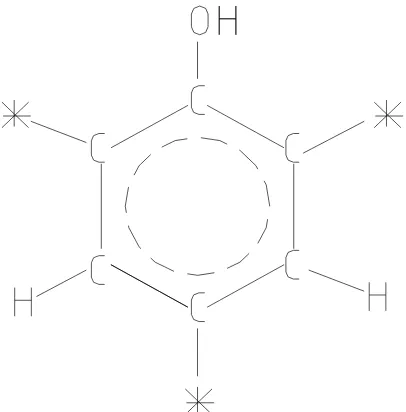
With reference to phenolic molecule of Figure 3, there are five 5 hydrogen atoms in the
benzene ring but because of limited space, there are only three possible sites for reaction and
the phenolic molecule is said to have a functionality of three and this is shown in Figure 4 [3,
10]. As the functionality of the phenolic molecules is greater than two, the molecules can
react with formaldehyde molecules to form 3-D network polymer [1].
The Enviroshperes (E-spheres) SLG is a mineral additive that can improve product by
reducing product's weight, improving its performance and lowering its cost. E-spheres are
white microscopic hollow ceramic spheres that are ideal for a wide range of uses. The
particle size of this general purpose E-spheres ranges from 20 – 300 µm with approximate
mean of 130 µm. The relative density of E-spheres is 0.7. E-spheres are a combination of
Silica, SiO2 (55-60%), Alumina, Al2O3 (36-44%), Iron Oxide, Fe2O3 (0.4-0.5%) and
Titanium Dioxide, TiO2 (1.4-1.6%). E-sphere is an inert material similar to talc, etc
(E-spheres, undated). The material may be prone to dusting in use. Grinding, milling or
goggles and a National Institute of Occupational Health and Safety (NIOSH) approved dust
respirator is recommended.
They are used in a variety of manufacturing applications because of their unique properties
and they are (E-spheres, undated):
extreme heat resistance;
high compressive strength;
pure, clean and white.
In addition to these unique features, E-spheres provide all the benefits you would expect from
a microsphere. The typical applications in composites include casting, spray-up, hand
lay-up, cold/hot press molding, resin transfer molding and syntactic foam.
3. Fracture toughness
Unlike the result of an impact test, it is a property that can be quantitatively measured. A
typical fracture toughness test may be performed by applying a tensile stress to a specimen
prepared with a flaw of known geometry and size and is shown in Figure 5. The stress
applied to the material is intensified at the flaw [10]. For a simple test the stress intensity
factor,
K = fσ a (1)
where f is a geometry factor for the specimen and flaw.
σ is the applied stress; a is the flaw size. If the specimen is assumed to have ‘infinite’
The critical stress intensity factor is defined as fracture toughness, Kc is the K required for a
crack to propagate and Kc = fσc a (2)
Kc is a property that measures a material’s resistance to brittle fracture when a crack is
present and its unit is MPa m. The value Kc for this thick-specimen situation is known as
the plane strain fracture toughness KIc; furthermore, it is also defines by [13]:
KIc = fσ a (3)
4. Short Bar Test and the Composite Samples
Baker described the background, selection criteria and specimen geometry options for short
rod and short bar methods [5]. The background, selection criteria and specimen geometry
options for the samples were clearly explained, which made the manufacture of the samples
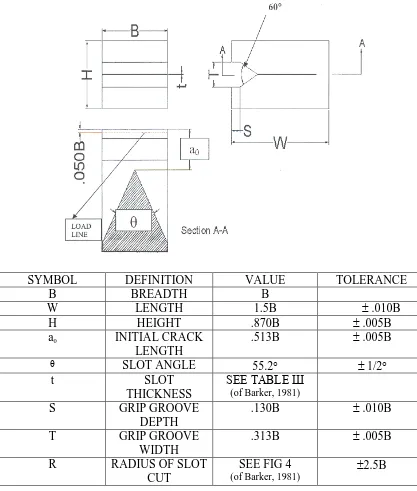
easier. Figure 6 shows the short rod and short bar specimens with straight chevron slots. The
load line is the line along which the opening load is applied in the mouth of the specimen.
The specimen parameter, B, is the specimen diameter (for short rod) or breath (for short bar).
The other parameter, W, is the length of the specimen. The relationship between the peak
load (to fracture the sample), the breath and the length of the specimen was given in equation
(4). The equation for fracture toughness in a short bar test can be derived from basic fracture
mechanics using the assumptions of linear elastic fracture mechanics (LEFM). The
requirements for LEFM were explained clearly, which were used in this study. The equation
for the material plane strain critical stress intensity factor, KICSR [13]:
KICSB =
W B
Y
F m )
( max *
(4)
where Fmax = Peak load;
B is the breath of the sample;
Ym* is the compliance calibration according to ASMT E-399-78 and
Ym = 17.1645
1.96
H W
0 0.342
0
W a
1 0.969
1 W
a
All parameters like a0 a1, W and H are shown in Figures 6 and 7. Also, B50 (by design),
and Fmax= 222 N (average peak load of six samples, 222 N was used in the calculation of
KICSB).
Fracture toughness for 20% by weight of SLG is calculated as:
KICSB =
W B
Y
F m )
( max *
= 8.800 MPa m
They also show two slot bottom geometries which result from two useful methods of
machining the chevron slots.
The reinforcer was SLG (ceramic hollow sphere) particulates and they were made 0 % to 35
% by weight in step of 5 % in the cured phenol formaldehyde composite PF/E-SPHERES (X
%), where X is the percentage by weight of the filler; the 40% by weight was tried but it was
found to be too viscous for mixing. As the raw materials of the composites are liquid and
ceramic hollow spheres, the short bar specimens were cast to shape. The resin is mixed with
the catalyst, after which the SLG is added to the mixture and they are then mixed to give the
uncured composite. Table 1 shows the mass in grams of resin, catalyst and slg required
respectively to make 1000 grams of uncured composite of 25 % by weight of SLG. The
mould was made from PVC (poly vinyl chloride) sheets with six pieces of short bar specimen
thickness. Figure 9 shows some of the PF/E-SPHERES (X %) short bar specimens ready for
the tests. After preliminary curing, the samples were taken out of the mould and post-cured
in an oven at 50 oC for 4 hours followed by 80 oC for 4 hours and finally by 100 oC for 2
hours. The degree of curing of the samples was 85% to 90 % as measured by differential
scanning calorimeter (DSC). These specimens were then subjected to short bar test.
5. Sample Size
The number of samples for each percentage by weight of E-spheres is six. An MTS 810
Material Testing Systems was used for the test. The rate of extension was 1 mm per minute.
The short bar tests involve an opening load being applied near the mouth of the specimen,
causing a crack to initiate at the point of the chevron slot. Ideally, the opening load should be
less than the load that will be required to further advance the crack. A continually increasing
load must be supplied until the crack length reaches the critical crack length, ac. Beyond ac,
the load should decrease, as shown in Figure 10.
6. Results and Discussion
Figure 11 shows the of fracture toughness J2027 (Brendon Chemical) specimens filled with
varying weight percentages of E-spheres SLG. Table 2 depicts the fracture toughness of
PF/E-SPHERES with varying percentage by weight of SLG with the standard deviation given
in bracket. It was found that the fracture toughness is highest with the neat resin (0 % by
weight of SLG); its value was 14.74 MPa m. The value dropped to a low of 7.37 MPa m
when the SLG by weight is 10%; after this the values varied from 8.08 to 8.81 MPa m as
two percent markers of 7.37 MPa m (10% SLG). The fracture toughness increases back to
11.88 MPa m when the percentage by weight of SLG is 35%. It appears that when the
percentage by weight of SLG was be further increased, the values of the fracture toughness
would also increase but the fact was that composites with SLG higher than 35 % by weight
would be too viscous; they cannot be mixed properly and be poured into the moulds. As the
standard deviation is small (Table 2), it can be argued that the values of fracture toughness
obtained are reliable.
Figure 12 shows the of fracture toughness of Borden J2027 specimens filled with varying
weight percentages of E-spheres SLG in the previous study. It was found that the values of
fracture toughness in this study were generally higher than those of previous study. The
shape of the curves is also different. These are due to the fact that the two batches of
phenolic resins were different [14]. The ratio of resin to catalyst in the previous study was 20
:1 while that of this study was 50:1 which was a ‘must’ in this study because any ratio of less
than 50 would result in very vigorous reaction and the specimens cast would have a lot of
blow holes. After casting, the samples were allowed to harden in room temperature for 72
hours not the 24 hours in the previous study before they were taken out for post-curing in an
oven [14]. This is due to the fact that the ratio of resin to catalyst used in this study was
50:1 and the hardening of the samples became much slower. The relative density of resin
used in this study is 1.23 while that in the previous study was 1.225. The relative density of
the post-cured composites manufactured for this study ranges from 1.185 (5% of SLG) to
0.972 (35% of SLG); the density decreases with increasing percentage by weight of SLG
because the relative density of SLG is only 0.7. At the same time, their corresponding tensile
strengths range from 16.1 MPa (5% of SLG) to 7.9 MPa (35% of SLG); the light SLG
materials in other study, it can be found that the composites made in this study have lower
densities and therefore lower tensile strengths [2]. It can be argued that other properties of
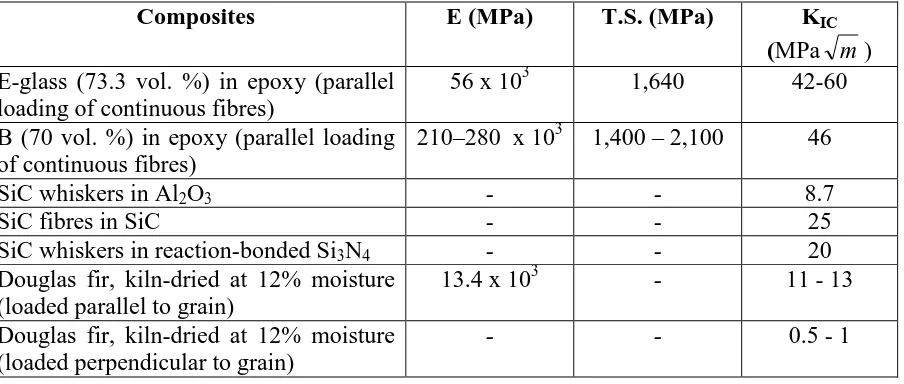
composites made in this study will be inferior to those of materials listed in Table 3 [15].
However, the cost of materials in this study will be cheaper because SLG is the unwanted by
product of fly ash. Provided, the application requirements of the materials are not too
stringent, these composites can be cheaper alternatives. The viscosity of the neat resin used
in this study was 700 cP while that of the previous study was 3240 cP. These differences
lead to the different in values of fracture toughness of the composites manufactured. Aierbe
et al. also found that phenolic resins supplied by different manufacturers were different [16].
They would have different viscosity and density; this indicates that the degree of water
content is different; one company can produce phenolic resins with 8 % water content and the
other will sale one with 12~15 % water content. Also the composition of the 'phenolic
prepolymers' is different when the resin have been prepared with different experimental
conditions like synthesis temperature, time, and different C:P and F:P ratios; all these
differences give rise to different mechanical and thermal properties [17]. The values of
fracture toughness of the composites done in the other study were mentioned, which were
used for comparison [14]. A concurrent study about post-curing the samples in microwaves
shows that the shape of the curve in this study is the same as that in microwave study and has
the same trend. It can be argued that the shape of this study is more reliable than that in the
previous study [18].
7. Conclusion
This study confirms that by adding SLG to phenolic resin by up to 35% by weight, the
but the cost reduced could be more than 50%. Redjel found that the fracture toughness of
pure phenolic resin was 1.51 MPa m [19]; the fracture toughness of neat resin used in this
study was 14.75 MPa m, which is 8.77 times the fracture toughness of pure phenolic resin,
an increase of 877%. Hence, the fracture toughness of resulting composites obtained from
current resin could be used in many applications. The trend of the fracture toughness of
phenolic resin reinforced with varying SLG by weight was also conformed by this study.
References
1. Lampman, S. (2003). Characterization and failure Analysis of: Plastics, ASM
International, 27.
2. Smith, W. F. and Hashemir, J. (2006). Foundations of material science and engineering, 4th
edition, McGraw-Hill, 523-525.
3. Strong, A. B. (2006). Plastics: materials and processing, 3rd edition, Pearson/Prentice-Hall,
182-183, 304-309, 323-333, 620-621.
4. Clarke, J. L. (Editor) (1996). Structural design of polymer composites, E & FN Spon,
U.K., 59-62, 343-5, 357.
5. Barker, L. M. (1979). Fracture mechanics applied to brittle materials, ASTM, STP 678,
6. Baker, L. M. (1980). Development of the short rod method of fracture toughness
measurement, Proceedings, Conference on Wear and Fracture Prevention, ASM, Metals Park,
Ohio, 163-180.
7. Baker, L. M. (1981) Short rod and short bar fracture toughness specimen geometries and
test methods for metallic materials, Proceedings, Fracture Mechanics: Thirteenth Conference,
ASMT STP 743, 456-475.
8. Chemwatch (2005). Material safety data sheet for Hexion Cellobond J2027L, 1-14.
9. Chemwatch (2005).Material safety data sheet for Hexion Phencat 15, 1-14.
10. Askeland, D. R. (1998). The science and engineering of materials, Third Edition, Stanley
Thornes, 163-164.
11. Wang, H. (2007). Engineering Materials –Study Book 1, University of Southern
Queensland, 9.13.
12. Callister, W. D. (2006). Materials science and engineering: an introduction, 7th Ed., John
Wiley and Sons, Inc., 217-219.
13. Munz, D. (1981). Determination of Fracture Toughness of High Strength Aluminum
Alloys with Cheron Notched Short Rod and Short Bar Specimens, Engineering Fracture
14. Ku, H., Trada, M., Cardona, F., Rogers, D. and Jacobson, W. (2007), Tensile Tests of
Phenol Formaldehyde SLG Reinforced Composites Post-cured in Microwaves: Preliminary
Results, Journal of Composite Materials, 2008 (accepted for publication).
15. Shackelford, J F, Introduction to materials science for engineers, 3rd edition, Macmillan,
1992, pp.515.
16. Aierbe, G A, Echeverria, J M, Riccardi, C C and Mondragon, I (2002). Influence of the
Temperature on the Formation of a Phenol Resol Resin Catalyzed with Amine, Polymer No.
43, pp. 2239 – 2243.
17. Ku, H., Rogers, D., Davey, R., Cardona, F. and Trada, M. (2008). Fracture Toughness of
Phenol Formaldehyde Composites: Pilot Study, Journal of Materials Engineering and
Performance, Vol. 17, No. 1, pp.85-90.
18. Cardona, F., Rogers, D., Ku, H., Pattarachaiyakoop, N. and Trada, M. (2007). Fracture
Toughness of Phenol Formaldehyde Composites Reinforced with E-spheres cured in
Microwaves, Journal of Electromagnetic Waves and Applications, 21(14): 2137-2146.
19. Redjel, B., 1995, Mechanical Properties and Fracture Toughness of Phenolic Resin,
Figure 1: Formation of the hydroxymethyl derivatives phenol
[image:15.595.191.413.355.475.2]
Figure 4: Phenol with active sites marked
[image:17.595.188.391.103.309.2]
SYMBOL DEFINITION VALUE TOLERANCE
B BREADTH B
W LENGTH 1.5B .010B
H HEIGHT .870B .005B
a0 INITIAL CRACK
LENGTH
.513B .005B
θ SLOT ANGLE 55.2 1/2
t SLOT
THICKNESS
SEE TABLE Ш (of Barker, 1981)
S GRIP GROOVE
DEPTH
.130B .010B
T GRIP GROOVE
WIDTH
.313B .005B
R RADIUS OF SLOT
CUT
SEE FIG 4 (of Barker, 1981)
[image:18.595.67.484.79.570.2]2.5B
Figure 7: Cross-section dimensions of short bar specimen showing a1
Figure 10: Variation of load versus crack length
Fracture toughness of PF/E-SPHERES post-cured conventionally in this study
0 5 10 15 20
0 10 20 30 40
Percentage by weight of SLG
F ra c tu re to u g h n e s s (M Pa m 0 .5 )
Fracture to ughness
Figure 11:Fracture toughness of PF/E-SPHERES with varying percentage by weight of SLG in this study
Fracture toughness of PF/E-SPHERES post-cured conventioanlly in previous study
7 9 11 13
0 10 20 30 40
Percentage by w eight of SLG
F ra c tu re t o u g h n e s s (M P a m 0 .5) Fracture toughness
Figure 12:Fracture toughness of PF-E-SPHERES with varying percentage by weight of SLG previous study
Table 1: Weight of materials required to make 1000 g of PF/SLG (25%)
Table 2: Fracture toughness of different percentage by weight of SLG reinforced phenolic resin
Percentage by weight of SLG
0 5 10 15 20 25 30 35
Fracture toughness MPa m 14.75 (0.0603) # 13.8 (1.007) 7.37 (0.424) 8.07 (0.516) 8.81 (0.333) 8.21 (0.277) 11.06 (0.708) 11.88 (0.524)
# standard deviation
Table 3: Mechanical properties data for some common composites
Composites E (MPa) T.S. (MPa) KIC
(MPa m) E-glass (73.3 vol. %) in epoxy (parallel
loading of continuous fibres)
56 x 103 1,640 42-60
B (70 vol. %) in epoxy (parallel loading of continuous fibres)
210–280 x 103 1,400 – 2,100 46
SiC whiskers in Al2O3 - - 8.7
SiC fibres in SiC - - 25
SiC whiskers in reaction-bonded Si3N4 - - 20
Douglas fir, kiln-dried at 12% moisture (loaded parallel to grain)
13.4 x 10³ - 11 - 13
Douglas fir, kiln-dried at 12% moisture (loaded perpendicular to grain)
- - 0.5 - 1
Materials Resin (R) Catalyst (C) R + C Slg Composite
Parameters
Percentage by weight 50 1 --- --- ---
Percentage by weight --- --- 3 1 ---
Weight of materials in 300 g of PF/SLG (10%)
[image:22.595.61.513.371.563.2]


