1
About the authors
Jon Andrews, Director for Education Data and Statistics. Jon recently authored the report ‘School
Performance in multi-academy trusts and local authorities’ and co-authored ‘Grammar schools and social mobility’. Prior to joining the Education Policy Institute, Jon worked in the Department for Education from 2003 to 2016; most recently leading analysis for the National Funding Formula for schools, the 2015 Spending Review and the education White Paper, ‘Educational Excellence Everywhere’.
Rebecca Johnes, Research Officer. Rebecca has worked in schools in both Japan and the UK and has
also worked for The Challenge, the largest provider of National Citizen Service. Rebecca is co-author of ‘Widening the gap? The impact of the 30-hour entitlement on early years education and childcare’ and ‘Grammar schools and social mobility’.
Acknowledgements
Jo Hutchinson is Associate Director for Education Data and Statistics. Jo recently authored ‘School
inspection in England: Is there room to improve?’ and co-authored the reports ‘Divergent pathways: the disadvantage gap, accountability and the pupil premium’ and ‘Grammar schools and social mobility’. Prior to this, Jo spent ten years as a statistician at the Department for Education, leading on evidence for the London Education Inquiry, the National Curriculum Review, behaviour and attendance, floor standards reform, and character education. Jo led the development of the Disadvantage Attainment Gap Index.
Natalie Perera, Executive Director and Head of Research. Natalie is principal author of our
‘Education in England: Annual Report 2016’ and has overseen recent publications including ‘Grammar Schools and Social Mobility’; ‘School Performance in Multi-Academy Trusts and Local Authorities’; and ‘Divergent Pathways’. Natalie worked in the Department for Education from 2002 to 2014 where she led on a number of reforms, including the design of a new national funding formula.
About the Education Policy Institute
The Education Policy Institute is an independent, impartial and evidence-based research institute that aims to promote high quality education outcomes, regardless of social background.
Education can have a transformational effect on the lives of young people. Through our research, we provide insights, commentary and critiques about education policy in England - shedding light on what is working and where further progress needs to be made. Our research and analysis will span a young person's journey from the early years through to higher education and entry to the labour market. Because good mental health is vital to learning, we also have a dedicated mental health team which will consider the challenges, interventions and opportunities for supporting young people's wellbeing.
2 Disadvantaged, SEND, and Vulnerable Children Early Years Development
School Funding
School Performance and Leadership Teacher Supply and Quality
Children and Young People's Mental Health Education for Offenders
Our experienced and dedicated team works closely with academics, think tanks, and other research foundations and charities to shape the policy agenda.
This publication includes analysis of the National Pupil Database (NPD): https://www.gov.uk/government/collections/national-pupil-database
The Department for Education is responsible for the collation and management of the NPD and is the Data Controller of NPD data. Any inferences or conclusions derived from the NPD in this publication are the responsibility of the Education Policy Institute and not the Department for Education.
3
Contents
Foreword ... 4
Executive summary ... 5
Part 1: Policy background ... 8
Faith schools ... 8
Brief history of faith schools ... 8
Regulations for faith schools ... 9
Green paper proposals relating to faith schools ... 9
Responses to green paper proposals relating to faith schools ... 10
Structure of this report ... 11
Part 2: The current landscape ... 12
Number of faith schools ... 12
Religious character of faith schools ... 14
The reach of faith schools ... 14
Governance of faith schools ... 18
Part 3: The characteristics of pupils who attend faith schools and social selection ... 21
Profile of faith school pupils compared to national rates ... 21
Social selection ... 24
Social segregation within local authorities ... 27
Characteristics of the most socially selective schools ... 31
Part 4: Attainment and progress in faith schools ... 34
Attainment and progress in faith and non-faith schools at Key Stage 2 ... 34
Attainment and progress in faith and non-faith schools at Key Stage 4 ... 35
Attainment by pupil characteristics in faith schools ... 37
Attainment of pupils in faith schools in context ... 39
Part 5: Conclusions and policy questions ... 42
Annex 1: Data sources ... 43
4
Foreword
The Education Policy Institute is an independent, impartial, and evidence-based research institute which aims to promote high quality education outcomes for all, through analysis that both informs and influences the policy debate in England and internationally.
In its recent green paper, Schools that work for everyone, the Department for Education announced that it plans to expand the number of ‘good school places’, in particular by allowing successful education institutions such as independent schools, universities, selective schools, and faith schools to expand their role.
This paper looks particularly at one of the above categories – faith schools. It asks whether the government is right to claim that ‘The vast majority of these are high-performing schools whose performance compares well with mainstream schools’, and that ‘pupils from poorer backgrounds perform better at faith schools than at other schools’.
We look not only at the raw attainment scores of those pupils who attend faith schools, but at their performance after taking into account pupil characteristics.
It is known that some faith schools admit smaller numbers of children from disadvantaged
backgrounds than found in their own local areas. Does this mean that if faith schools secure better results than other schools, it is only because they are more socially selective?
We seek both to answer this question, and to look at how socially selective faith schools are – including by comparing them with other groups of schools, such as academically selective schools, and high performing non-selective schools.
The government proposes to make it easier for new faith free schools to open, by removing the 50 per cent cap on faith based admissions, which was introduced by the 2010 Coalition Government. What effect might this have on both attainment and faith based admissions?
As ever, we welcome comment on the analysis and conclusions of this report.
Rt. Hon. David Laws
5
Executive summary
The government’s green paper, Schools that work for everyone, proposes a series of reforms that are intended to increase the number of good school places, by enabling successful schools and other education providers to expand. The green paper cites several models to achieve this: removing the ban on new grammar schools; removing the restriction on faith schools which presently limits faith based admissions to 50 per cent; and setting expectations on both independent schools and universities to play a greater role in supporting state-funded schools.
The green paper proposals to encourage more faith schools to open are based on the premise that the majority of these are high-performing, have good Ofsted ratings and support increased social mobility.
When we look at the raw attainment data, and indeed at basic value added data, these claims appear to be accurate. Pupils, including disadvantaged pupils, tend to do better in faith schools, both in terms of overall attainment and in the progress they make. This is the case in both primary and secondary schools.
At Key Stage 2, we find that:
83 per cent of pupils in Church of England schools, and 85 per cent of pupils in Roman Catholic schools achieved level 4+ in reading writing and mathematics, compared to 81 per cent in non-faith schools. The mean value added scores achieved by pupils from Key Stage 1 to Key Stage 2 are higher in Roman Catholic schools, on average, but are no higher on average in Church of England schools, in comparison with non-faith schools.
At Key Stage 4, we find that:
60.6 per cent of pupils in Church of England schools, and 63.2 per cent of pupils in Roman Catholic schools, achieved five good GCSEs, including English and mathematics, compared to 57.4 per cent of pupils in non-faith secondary schools. And at Key Stage 4, value added is higher in most faith groups, in comparison to non-faith schools. In Church of England schools, pupils achieve one-twentieth of a grade higher in each of 8 GCSEs; in Catholic schools they achieve one-sixth of a grade higher in each of 8 GCSEs; and in ‘other non-Christian’ faith schools, pupils achieve around two-thirds of a grade higher in each of 8 GCSEs (this is based on a small number of schools and may be disproportionately affected by the performance of individual schools).
However, this does not take into account the characteristics of pupils in faith schools, including levels of deprivation, ethnicity and special educational needs. All of these factors need to be taken into account in order to make a fair assessment of the impact and effectiveness of faith schools. We need to understand if higher performance in many faith schools is due to greater school
effectiveness or whether it is a function of pupil characteristics. Our analysis in this report finds that, compared to non-faith schools:
6
Faith schools also educate a lower proportion of pupils with special educational needs (SEN) (16.8 per cent at Key Stage 2 versus 19.7 per cent; 14.4 per cent at Key Stage 4 versus 16.6 per cent); and
Faith schools enrol a larger proportion of high attaining pupils (28.4 per cent at Key Stage 2 versus 23.7 per cent; 27.4 per cent at Key Stage 4 versus 24.5 per cent).
As well as looking at how representative faith schools are compared to non-faith schools, we also look at how representative they are of their local communities. We have developed a ‘social selection’ score which identifies how representative schools are of pupils who are within a
reasonable travel distance. A score of 1.0 means that a school draws in from its catchment exactly the same proportion of pupils from disadvantaged backgrounds who are represented in the catchment area. We have applied this to all schools, and groups of schools.
We find that:
Grammar schools are the most socially selective schools, with an average score of 0.2. This means that on average the odds of a pupil in a grammar school being eligible for free school meals are one fifth of those for all children in their local area. Unsurprisingly, all grammar schools are socially exclusive. Indeed, of the 100 most socially selective schools in England, 65 of these are grammar schools (including some faith grammars).
Secondary faith schools have, on average, a socially-selective (median) score of 0.7. This means that the odds of a pupil in a secondary faith school being eligible for free school meals are around two thirds of those for all children in their local area. In the top 100 socially selective secondary schools, 30 of these are faith schools and 17 of these are non-academically selective faith schools – which raises real concerns about their admission arrangements.
In contrast to grammar schools, the distribution of social selection across faith schools is much wider. At secondary level, there are 49 non-selective faith schools with a social selection score of 2.0 or more – meaning the odds of admitting a poor child are twice those of the local area. However, 51 of the 553 non-selective faith secondary schools are at least as socially selective as the median grammar school – almost 1 in 10 of such schools. The non-selective schools with the highest value-added progress scores have an average
social selection score of 0.8 – making them more inclusive than both grammar schools and faith schools on average. And there are only nine such schools which are faith and academically selective in the top 100 secondary schools by social selection. Only 1 in 30 non-faith, non-selective schools are as selective as the median grammar school.
Primary faith schools have similarly socially selective intakes.
As we see above, the demographics of pupils in faith schools are very different from those in non-faith schools. In order to make a more meaningful assessment of the performance of non-faith schools, we compare pupils in faith schools with similar pupils in non-faith schools. To do this, we control for deprivation, prior attainment and ethnicity.
7 We find that:
The difference in attainment between faith and non-faith schools at Key Stage 2 is largely eliminated after controlling for prior attainment and pupil characteristics – and is so small as to be educationally insignificant.
At Key Stage 4, also adjusting for pupil characteristics, pupils in faith schools achieved the equivalent of around one-seventh of a grade higher in each of 8 GCSE subjects. This is a relatively small attainment gain.
Conclusion and Policy Implications
The government plans to increase the supply of good school places by increasing the number of faith school places. While the raw attainment and progress figures for faith schools appear to suggest that these schools do better for their pupils, these ‘gains’ largely disappear after adjusting for pupil characteristics. After adjusting for disadvantage, prior attainment and ethnicity, pupils in primary faith schools seem to do little or no better than in non-faith schools, and pupils in secondary schools record small average gains of just one-seventh of a grade higher in each of 8 GCSE subjects.
However, given that the average faith school admits fewer pupils from poor backgrounds than the average non faith school, there is a risk that such small gains would come at the price of increased social segregation, with a risk of lower social mobility.
If the objective of government policy is to increase social mobility, this policy intervention is unlikely to be effective.
8
Part 1: Policy background
Faith schools
Faith schools are schools with a specified religious character.1 Most faith schools in England are of a particular Christian denomination, but small numbers of schools of minority faiths (including Muslim, Jewish and Sikh schools) also exist.2 Approximately one-third of state-funded schools in England are faith schools; this figure is higher at primary level and considerably lower at secondary level.3 Some faith schools have remained as local authority maintained schools, whilst others have moved to academy status or opened recently as free schools.4
Brief history of faith schools
Religious institutions have played a major role in providing education in England for many centuries. The first known schools in England, founded in the late sixth century, were linked with cathedrals and monasteries in order to provide an education for boys who were to become monks and priests. Religious institutions became particularly prominent in education provision from the sixteenth century until a state system of education emerged in the second half of the nineteenth century. During this period, a number of different Christian denominations began to establish schools and various co-ordinating committees were formed to oversee this work. These include the Royal Lancastrian Society, established in 1808 by a group of Quakers in order to set up schools providing a Christian education for children from poor families. Very shortly after, the National Society for Promoting the Education of the Poor in the Principles of the Established Church in England and Wales was formed in 1811; its leaders hoped to ensure that every parish in England and Wales had its own school. The Catholic Poor School Committee subsequently emerged in the 1840s.5
The 1870 Elementary Education Act legislated for the creation of school boards, which were to monitor sufficiency of school places locally and establish and maintain new schools where more places were required. Thus state schools came to emerge alongside religious schools. Faith schools became part of the state system during the first half of the twentieth century and under the 1944 Education Act were permitted to become maintained schools.6 However, they retained their religious character and new faith schools have also been established. These include schools of non-Christian faiths. The first non-paying Jewish school was in fact opened as early as 1732. Schools of other religions have opened more recently: private Muslim schools were established in the 1950s
1 For the purposes of the analysis presented in this paper, a faith school is one with a designated religious character recorded on Edubase.
2 R. Long and P. Bolton, ‘Faith Schools: FAQs’, House of Commons Library, Briefing Paper 06972, October 2015, p.4.
3 See Part 2 for further details about the number and spread of faith schools.
4 R. Long and P. Bolton, ‘Faith Schools: FAQs’, House of Commons Library, Briefing Paper 06972, October 2015, p.4.
5 S. Scott and D. McNeish, ‘Leadership and faith schools: issues and challenges’, National College for School Leadership, December 2012, p.4. R. Berkeley, ‘Right to Divide? Faith Schools and Community Cohesion’, Report Summary, The Runnymede Trust, December 2008, pp.7-9.
9
and 1960s but it was not until 1998 that two Muslim schools became state funded for the first time. The first state Sikh school was established in 1999 and the first state Hindu school in 2008.7
Regulations for faith schools
Faith schools are subject to slightly different regulations from other schools in terms of pupil
admissions and staffing policies. Whereas non-faith schools are not permitted to use pupil religion in any admissions criteria, faith schools are allowed to prioritise the admission of pupils of a particular religion if the school is oversubscribed.8 In the case of faith free schools only, faith-based
oversubscription criteria can only be used in allocating a maximum of 50 per cent of available places. Free schools were introduced under the 2010 Academies Act and virtually all new schools now opened are free schools; this means that the cap effectively applies to any new faith school which is opened. It does not apply to local authority maintained schools or academies with a predecessor school.9
Schools with a specified religious character are also allowed to apply faith criteria when appointing staff, so that candidates who share the faith of the school can be given preference over others. In addition, depending on governance arrangements in place at a particular faith school, the school’s buildings may be owned by a religious organisation.10
Green paper proposals relating to faith schools
The government’s recent green paper, Schools that work for everyone, includes a number of proposals which relate specifically to faith schools; these form part of a package of policy proposals intended to increase the number of high-quality school places available. The particular attention given to faith schools is based on the claim that these schools exhibit high performance relative to other schools.11
The green paper outlines the government’s intention to remove the 50 per cent cap on faith-based admissions for oversubscribed faith free schools, arguing that this measure has not in practice achieved its intended aim of promoting inclusion and cohesion. At new free schools of minority faiths (such as Islam, Judaism, Sikhism and Hinduism) there has been little diversity in the ethnic backgrounds of pupils. At the same time, more mainstream faiths (particularly Roman Catholicism), which are more likely to receive a greater number of applications from pupils of different faiths, have been reluctant to open new free schools. The Catholic Education Service argues that the 50 per cent cap would prevent it from fulfilling its religious obligations because oversubscribed Catholic
7 S. Scott and D. McNeish, ‘Leadership and faith schools: issues and challenges’, National College for School Leadership, December 2012, p.4; R. Berkeley, ‘Right to Divide? Faith Schools and Community Cohesion’, Report Summary, The Runnymede Trust, December 2008, pp.7-10.
8 If a faith school is not oversubscribed, then it must offer places to all pupils who apply, regardless of religion. 9 R. Long and P. Bolton, ‘Faith Schools: FAQs’, House of Commons Library, Briefing Paper 06972, October 2015, pp.5-6.
10 R. Long and P. Bolton, ‘Faith Schools: FAQs’, House of Commons Library, Briefing Paper 06972, October 2015, pp.4, 6-9.
10
schools would be compelled, once the 50 per cent limit is reached, to reject Catholic applicants; this, they contend, would constitute a breach of Canon Law.12
The green paper further sets out a series of proposals which are designed to promote inclusion at new faith free schools in what is claimed to be a more effective way than the 50 per cent cap. Under these proposals, new faith free schools would be required to:
Prove that there is a demand for school places from parents of other religions, and that these parents would be willing to send their child to a school of the specified faith; Develop ‘twinning’ relationships with other schools that do not share the same religion; Consider establishing mixed-faith multi-academy trusts and, as part of this, potentially
become a sponsor of an under-performing non-faith school;
Consider appointing a director or independent member to the school’s governing body who does not share the school’s religion.13
Under the terms proposed in the consultation document, schools that fail to fulfil these stipulations would not be permitted to become or remain a faith school.14
Responses to green paper proposals relating to faith schools
The proposals, particularly the government’s intention to remove the 50 per cent cap for religious free schools, have been met with a positive response from the Catholic Education Service, which had been a strong advocate of abolishing the cap. The organisation is now reported to be planning to open between 30 and 40 new Catholic schools once the cap has been removed, although its director has also explicitly warned against moving to a system in which schools are made up entirely of pupils who all share the same religion.15
Other commentators, however, have spoken out against the proposals. Former Labour Schools Minister, Jim Knight, has stated that expanding faith schools will promote division and segregation and that the proposed measures intended to foster inclusion at faith schools are completely insufficient.16 Others have likewise pointed to evidence that the intake of faith schools does not reflect the demographic of their local communities and that certain groups struggle to access these schools, arguing that removing the 50 per cent gap will undermine community cohesion.17
12 Department for Education, ‘Schools that work for everyone – Government consultation’, September 2016, pp.30-32.
13 Department for Education, ‘Schools that work for everyone – Government consultation’, September 2016, pp.32-33.
14 Department for Education, ‘Schools that work for everyone – Government consultation’, September 2016, p.34.
15 A. Bloom, ‘Schools having 100% pupils of just one faith is dreadful’, TES, 28 October 2016; R. Gamble, ‘Church welcomes abolition of cap on faith-school admissions’, The Tablet, 15 September 2016; B. Camden, ‘Faith schools welcome 100% faith-based admissions’, Schools Week, 16 September 2016.
16 J. Knight, ‘Relaxing faith schools admissions rules risks the divisive ghettoisation of education’, TES, 12 October 2016. See also: B. Trafford, ‘How on earth can a 100 per cent faith school hope to encompass pupils from a variety of backgrounds?’, TES, 18 September 2016; National Secular Society, ‘Government launches consultation on abolishing faith school admissions cap’, 13 September 2016.
11
Structure of this report
In light of the government’s green paper proposals relating to religious schools, this report assesses the current state of faith schools in England. Part 2 considers the landscape of faith schools,
12
Part 2: The current landscape
This section examines the number, location, geographic reach, and governance arrangements of faith schools in comparison to non-faith schools.
Number of faith schools
National Statistics, published by the Department for Education, show that in January 2016 there were 6,817 state-funded faith schools in England, out of a total of 20,179 state-funded primary and secondary schools.18 Every local authority in England has at least one faith school, although their proportion varies both between regions and between primary and secondary levels of education. There are no state-funded special schools, pupil referral units or alternative provision institutions with a recorded religious designation. Therefore all analysis in this report relates to state-funded mainstream schools.
At primary level, 36.8 per cent of schools nationally are faith schools, accommodating 28.5 per cent of pupils. These figures range from 48.8 per cent of primary schools (42.4 per cent of pupils) in the North West to 28.6 per cent of primary schools (21.3 per cent of pupils) in London.
At secondary level, the national proportion of schools which are faith schools falls to 18.7 per cent; these educate 18.5 per cent of pupils. Again, there is substantial variation between regions, ranging from 31.2 per cent of schools (31.4 per cent of pupils) in the North West, to 12.8 per cent of schools (12.0 per cent of pupils) in the East of England. As shown in Figure 2.1, regions which have relatively high proportions of faith schools at primary level do not necessarily have high proportions at secondary level, and vice versa.
13
Figure 2.1: Percentage of primary and secondary schools which are faith schools, by region, January 201619
There is also variation between local authorities. The maps in Figure 2.2 show the proportion of pupils in state-funded primary and secondary schools who attend faith schools.
At primary level there are 27 local authorities in which more than 40 per cent of pupils attend a faith school; the highest includes Blackburn with Darwen, Knowsley, and Wigan in the North West, and Wiltshire, Dorset, and Bath and North East Somerset in the South West. Only one local authority (Newham) has less than 10 per cent of pupils attending a faith school. There are four authorities in the South West in which less than 20 per cent of pupils attend a faith school (Bristol, Cornwall, Plymouth and Swindon), demonstrating the variation that can exist even in a region with high attendance in faith schools overall.
At secondary level there are just 9 local authorities in which at least 40 per cent of pupils attend a faith school. As set out above, the South West has an above average rate of attendance at faith schools at primary level but below average at secondary level. This is evident at local authority level, where no authorities have more than 40 per cent of pupils attending a faith school. This is a
reflection also of the general trend whereby faith schools are more prevalent at primary than at secondary level.
19 The axes of this chart have been set so as to cross at the national average at primary and secondary level
East Midlands East of England
ENGLAND London
North East
North West
South East
South West West Midlands
Yorkshire and the Humber
0% 5% 10% 15% 20% 25% 30% 35%
0% 10% 20% 30% 40% 50% 60% 70%
Secondary schools
14
Figure 2.2: Proportion of pupils at state-funded schools attending schools with a religious character20
<10%
>=10% & <20% >=20% & <30% >=30% & <40%
>=40%
Religious character of faith schools
The specific religious character of faith schools does of course vary, although the overwhelming majority are a denomination of Christianity. Amongst all primary schools, 26.1 per cent are Church of England and 9.8 per cent are Roman Catholic. At secondary level, the proportion of Church of
[image:15.595.95.520.92.332.2]England schools drops to 6.1 per cent but the percentage of Roman Catholic schools remains roughly the same, at 9.4 per cent.
Figure 2.3: Religious character of faith schools, January 201621
Primary schools Secondary schools
No Religious Character 10,598 63.2% 2,764 81.3%
Church of England 4,381 26.1% 209 6.1%
Roman Catholic 1,649 9.8% 319 9.4%
Other Christian Faith 97 0.6% 77 2.3%
Other Faith 53 0.3% 32 0.9%
The reach of faith schools
Analysing data from the 2015 Key Stage 2 and Key Stage 4 cohorts indicates that pupils who are educated at faith schools are less likely to be attending their nearest school than their peers at non-faith schools. This is true both at primary and secondary level, and the difference is particularly pronounced in areas of urban conurbation, where there are more schools available from which parents and pupils can choose.
20 Contains National Statistics data © Crown copyright and database right 2016. Contains OS data © Crown copyright and database right 2016.
21 Calculated from data published in: Department for Education, ‘Schools, pupils and their characteristics: January 2016’, June 2016, Tables 7f and 7g. Primary schools includes infant, junior and all-through primary schools and middle schools as deemed. Secondary includes all-through schools and middle schools as deemed.
15
16
Figure 2.4: Percentage of primary school pupils attending nearest school, by school religious character and area type, 201522
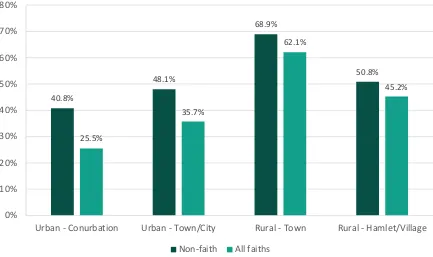
Figure 2.5: Percentage of secondary school pupils attending nearest school, by school religious character and area type, 201523
It is therefore unsurprising that the distances travelled to school by pupils tend to be greater for those attending faith schools; this is particularly so for secondary schools. In areas of urban
conurbation, 90 per cent of secondary pupils in non-faith schools live within 3.0 miles of their school;
22 Derived from 2015 Key Stage 2 data from the National Pupil Database. 23 Derived from 2015 Key Stage 4 data from the National Pupil Database.
40.8%
48.1%
68.9%
50.8%
25.5%
35.7%
62.1%
45.2%
0% 10% 20% 30% 40% 50% 60% 70% 80%
Urban - Conurbation Urban - Town/City Rural - Town Rural - Hamlet/Village
Non-faith All faiths
40.8%
53.3%
57.3%
20.8%
31.4%
44.5%
0% 10% 20% 30% 40% 50% 60% 70% 80%
Urban - Conurbation Urban - Town/City Rural - Hamlet/Village/Town
[image:17.595.82.515.402.663.2]17
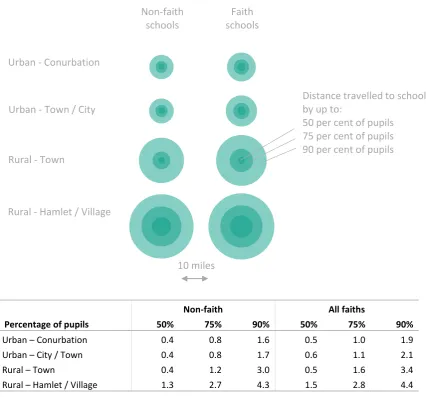
this rises to 4.4 miles for faith schools. Again, the difference is smaller in less densely populated areas, where parents face a more limited choice of schools; indeed, at primary level in particular, the urban-rural divide is more notable than the differences between faith and non-faith schools. The smaller difference between faith and non-faith schools at primary level may be due in part to
[image:18.595.81.508.232.629.2]parents moving into catchment areas of primary schools before applying for a place for their child, in order to maximise their chances of obtaining a place at their chosen school. Whilst this also happens at secondary level, parents may find doing this more challenging if it involves increasing the travel time to primary school for younger children, or moving primary school. The differences may also be down to a greater willingness of older children to travel to reach a particular type of school.
Figure 2.6: Distance travelled by primary school pupils to non-faith and faith schools, by area type, 2015
Non-faith All faiths
Percentage of pupils 50% 75% 90% 50% 75% 90%
Urban – Conurbation 0.4 0.8 1.6 0.5 1.0 1.9
Urban – City / Town 0.4 0.8 1.7 0.6 1.1 2.1
Rural – Town 0.4 1.2 3.0 0.5 1.6 3.4
Rural – Hamlet / Village 1.3 2.7 4.3 1.5 2.8 4.4
10 miles Non-faith
schools
Faith schools
Rural - Hamlet / Village Urban - Town / City Urban - Conurbation
Distance travelled to school by up to:
18
Figure 2.7: Distance travelled by secondary school pupils to non-faith and faith schools, by area type, 2015
Non-faith All faiths
Percentage of pupils 50% 75% 90% 50% 75% 90%
Urban – Conurbation 1.0 1.8 3.0 1.6 2.8 4.4
Urban – City / Town 1.1 2.2 4.7 1.4 2.9 5.9
Rural – Hamlet / Village / Town 2.7 4.9 7.4 2.9 5.3 7.8
Whilst this may indicate that parental demand for faith schools is higher than for non-faith schools, the reasons for this are likely to be complex. The greater distances travelled by pupils at faith schools may also render these schools less representative of their local communities and potentially more socially selective, as they are drawing from a wider pool of candidates and from pupils who are able to travel greater distances. This in turn may contribute to pupil attainment and school reputation, and these factors are then likely also to contribute to parental demand. These issues are examined in greater details in Parts 3 and 4.
Governance of faith schools
There are a variety of governance arrangements for both faith and non-faith schools. The Academies Act 2010 led to a massive increase in the number of secondary academies, the introduction of primary academies and the establishment of free schools. The majority of secondary schools are now academies: by the end of the 2015-16 academic year, 65.8 per cent of secondary schools were academies (including converter and sponsored academies, free schools, studio schools, and
university technical colleges). The transition has been slower at primary level, with the equivalent figure standing at 18.2 per cent of schools, though the overall number of schools is significant.
10 miles Non-faith
schools
Faith schools
Rural - Hamlet / Village Urban - Town / City
Urban - Conurbation Distance travelled to school
by up to:
19
[image:20.595.81.513.218.485.2]Amongst primary schools, almost all types of faith school are less likely to be academies or free schools than are faith schools, although the difference is not large. The exception is non-Christian faith schools: this is the smallest group of schools, but these are more likely to be academies or free schools than are non-faith schools due to the relatively high proportion of free schools of this type which have opened in recent years. For the majority of primary schools which are not academies or free schools, non-faith schools are overwhelmingly community schools, whereas faith schools are largely voluntary aided or voluntary controlled, with a limited number of foundation schools.
Figure 2.8: Governance arrangements at primary schools, by school religious character, 201624
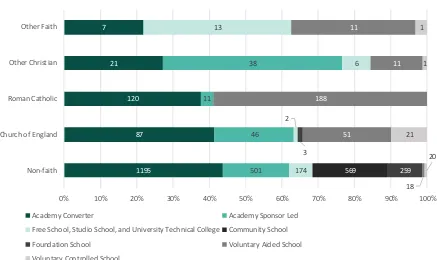
Although a far higher proportion of secondary schools have become academies, a similar pattern is seen: non-faith schools are more likely to be either academies or free schools than any type of faith school, with the exception of Other Christian schools. There is a particularly low proportion of Roman Catholic schools which fall into these categories.
Again, there is a relatively high proportion of non-Christian faith free schools, whereas there are no secondary Catholic free schools. This is because oversubscribed faith free schools are currently permitted to use faith-based admissions criteria to allocate the first half of available places only. As discussed in Part 1, the Catholic Education Service has been unwilling to open new Roman Catholic free schools on this basis, but the rule does not appear to have discouraged to the same extent free schools of other denominations or faiths from being established. Amongst the remaining secondary schools which are not academies or free schools, non-faith schools are very largely community schools (as at primary level), and faith schools tend to be voluntary aided schools with a smaller number of voluntary controlled and foundation schools.
24 Derived from Edubase, August 2016. 1371
494 303 7
7
797 162
27 4
86 9
1 8
14
7617 656
27
33 1668
1316 29
32
35 2019
49
0% 10% 20% 30% 40% 50% 60% 70% 80% 90% 100%
Non-faith Church of England Roman Catholic Other Christian Other Faith
Academy Converter Academy Sponsor Led Free School Community School
20
Figure 2.9: Governance arrangements at secondary schools, by school religious character, 201625
Faith schools that wish to convert to academy status must obtain approval from their religious body before applying to do so.26 In some cases the diocese will then operate as the academy sponsor. It is not possible to identify all instances of this from published data, but there are around 300 primary academies and just under 40 secondary academies in which the sponsor name explicitly denotes a diocesan body.
25 Derived from Edubase, August 2016.
26 Department for Education, ‘Convert to an academy: guide for schools’, 2015, updated September 2016:
https://www.gov.uk/guidance/convert-to-an-academy-information-for-schools/1-before-you-apply
1195 87 120 21 7
501 46 11
38
174 2
6 13
569 259
3
18 51
188
11 11
20 21
1 1
0% 10% 20% 30% 40% 50% 60% 70% 80% 90% 100%
Non-faith Church of England Roman Catholic Other Christian Other Faith
Academy Converter Academy Sponsor Led
Free School, Studio School, and University Technical College Community School
Foundation School Voluntary Aided School
21
Part 3: The characteristics of pupils who attend faith schools
and social selection
This section examines the characteristics of pupils who attend faith and non-faith schools,
comparing them with the demographic profile of pupils nationally. It then goes on to consider how representative faith schools are of the local communities in which they are situated, and how they compare with other types of schools on this measure.
Profile of faith school pupils compared to national rates
Figures 3.1 and 3.2 show the proportion of pupils in non-faith and faith schools who have given characteristics. A breakdown by different types of faith is provided in Annex 2.
In faith schools as a whole, the proportion of pupils eligible for free school meals is lower than that in non-faith schools. This is true for both primary and secondary schools, although the difference is particularly stark at primary level. Similarly, pupils with special educational needs are under-represented at faith schools.
The distribution of pupils whose first language is other than English (EAL pupils) across faith and non-faith schools is more varied. Across all non-faith schools, the proportion of EAL pupils is lower than the figure for non-faith schools at primary level, but higher at secondary level. In addition, EAL pupils are particularly over-represented in non-Christian faith schools (including Jewish, Muslim, Sikh and Hindu schools) at both primary and secondary level.
The proportion of pupils from non-white British backgrounds similarly varies across different school types. The proportion of non-white British pupils at faith schools is lower than at non-faith schools at primary level, but higher at secondary level. ‘Other faith’ and Roman Catholic schools at both
primary and secondary levels have particularly high proportions of pupils from non-white British backgrounds when compared with non-faith schools, and other faith schools.
At both primary and secondary level, the proportion of pupils in the top 25 per cent of prior
22
Figure 3.1: Pupil characteristics at Key Stage 2 by religious character of school27
Non-Faith Schools Characteristic (all schools)
Faith Schools
Pupils eligible for free school
meals (16.3%)
Special educational
needs (18.9%)
First language other than
English (18.3%)
Non-white British (28.7%)
Top quarter of prior attainment
(25.0%)
23
Figure 3.2: Pupil characteristics at Key Stage 4 by religious character of school28 Non-Faith Schools Characteristic
(all schools)
Faith Schools
Pupils eligible for free school
meals (13.8%)
Special educational
needs (16.3%)
First language other than
English (14.1%)
Non-white British (24.4%)
Top quarter of prior attainment
(25.0%)
24
Social selection
We now consider the extent to which different schools, including faith schools, are representative of their local communities – specifically, the extent to which they include pupils from disadvantaged backgrounds.
It is difficult to reliably define a catchment area around a school from national data. Furthermore, high performing schools can draw their pupils from a small geographical area, the characteristics of which may in turn be driven by the presence of the school; that is to say that families may move to be within the catchment area of a school. Therefore, we use the travel distances calculated in Part 2 to identify the neighbourhoods that are within a reasonable travel distance of the school (defined such that 90 per cent of pupils travel less than this to school).
For each school we calculate a score that compares the proportion of pupils eligible for free school meals in the school with that seen in its local neighbourhood. This score is known as an ‘odds-ratio’: the odds of a pupil in the school being eligible for free school meals divided by the odds of a pupil living in the local area being so.29 In this analysis we refer to this ratio as the ‘social selection score’. A score of 1 indicates that the intake of the school matches that of the local area, a score above 1 indicates the characteristic is more prevalent in the school than the local area, and a score below 1 indicates that the characteristic is less prevalent in the school than the local area.
Faith schools have, on average, fewer pupils that are eligible for free school meals than the areas in which they are situated. Figure 3.3 shows that in secondary schools, the median faith school has a
social selection score of 0.7; this means that in the average faith school the odds of a child being eligible for free school meals are 0.7 times those of children living in the local area. Faith schools are also slightly more socially selective than high performing non-selective schools, where the rates of eligibility for free school meals are slightly below the average for their local area. However, faith schools are much less socially selective than academically selective schools, where the odds of a child being eligible for free school meals are one-fifth of those of their local areas.
There is considerable variation within each of these groups. Whilst faith schools are on average much less socially selective than grammar schools, 51 of the 553 non-selective faith secondary schools have a social selection score of 0.2 or lower; these schools are at least as socially selective as the average grammar school. By contrast there are 72 non-selective non-faith schools that have a social selection score of 0.2 or below (out of a total of 2,353 schools.) In other words, around 1 in 10
faith secondary schools are at least as socially selective as the average grammar school, compared with 1 in 30 non-faith non-selective secondary schools. All groups have some schools that are socially selective.
With the exception of selective schools, all secondary school groups have schools in which the number of pupils from disadvantaged backgrounds exceeds the local average. There are 49 faith schools with a social selection score of 2.0 or above, meaning that the odds of a pupil in the school being eligible for free school meals are double that of the local area. In other words, whilst faith
schools are on average more socially selective than non-faith schools around 1 in 10 faith
25
secondary schools have a disproportionately high number of pupils that are eligible for free school meals.
Cohort sizes in primary schools are usually relatively small (averaging at around 40 pupils per year, although for this analysis we have pooled three years of data together) and the pupils are often drawn from a relatively small geographic area. Therefore clustering of pupils with similar
characteristics is more common. This is shown in Figure 3.4, where large numbers of schools (in each category) have releatively few pupils eligible for free school meals in comparison to the surrounding areas.30
On this basis, faith primary schools are more socially selective than average, with a median social selection score of 0.7 compared to a national median of 0.9. Around 7 per cent of faith primary schools and 11 per cent of primary schools in rural areas had a score of zero meaning that they had no, or a negligible number, of pupils from disadvantaged backgrounds in their Key Stage 2 cohort for the last three years. By comparison, across all schools, and in high performing primary schools, just under 5 per cent had a score of zero.
26
Figure 3.3: Extent to which different types of secondary schools are representative of their local area31
Figure 3.4: Extent to which different types of primary schools are representative of their local area31
31 Size of bubble is proportional to the proportion of schools having that score. Median for each group highlighted. Scores capped at 3.0 for secondary schools and 4.0 for primary schools. Therefore these scores should be interpreted as 3.0+ and 4.0+.
All schools
Faith schools
Selective schools
Rural schools
High performing non-selective schools
0.9
0.7
0.2
0.8
0.8
-0.5 0 0.5 1 1.5 2 2.5 3 3.5
Odds ratio (odds of FSM in school / odds of FSM in local area) In schools to the left of this line, the FSM rate is
lower than in surrounding areas
In schools to the right of this line, the FSM rate is higher than in surrounding areas
All schools
Faith schools
Rural schools
High performing schools
0.9
0.7
0.7
0.9
-1 0 1 2 3 4
Social selection score (FSM in school / FSM in area) In schools to the left of this line, the FSM rate is
lower than in surrounding areas
[image:27.595.76.501.400.690.2]27
Social segregation within local authorities
Levels of social segregation vary not only according to specific characteristic or school type, but also in different geographical areas: in some local authorities, the divergence in level of social selection between schools is greater than in others. In order to measure this variance between local
authorities, schools with sufficient data to calculate a valid social selection score were grouped into local authorities and the lower quartile, upper quartile, and inter-quartile range of the social selection scores were calculated for each. The lower and upper quartiles are plotted for each local authority in the charts below, with each bar representing the inter-quartile range. Local authorities with the highest inter-quartile ranges (the longest bars) have the greatest polarisation in social selection amongst their schools.
A local authority with a lower quartile well below 1.0 and an upper quartile well above 1.0 would indicate an area where pupils from disadvantaged backgrounds cluster in particular schools within the authority. It is worth noting that the distribution for a local authority need not centre around 1.0. Pupils do not necessarily attend a school in the local authority in which they reside – for example, areas with grammar schools attract a number of pupils (likely to be disproportionately from non-disadvantaged backgrounds) from other areas, our catchment area approach allows for this cross border movement. In addition, and as seen in Figure 3.3 and Figure 3.4, the national median does not necessarily have to be 1.0.32
Looking at social segregation at Key Stage 4, there is wide variation between the most and least socially segregated. Local authorities which are defined as being fully selective are largely clustered towards the top end of the spectrum: most of the 10 fully selective local authorities appear in the top 25 per cent most socially selective local authorities.33 On the other hand, there is no clear link between proportion of faith secondary schools and social selection at local authority level. Figure 3.5, below, displays the level of social selection by free school meal eligibility across local authorities in 2015.34
At Key Stage 2, there is less variation than at Key Stage 4 between the most and least selective local authorities according to free school meal eligibility. There is no association between proportion of faith schools in a local authority, and its overall level of social selection. Figure 3.6, below, compares levels of social selection by local authority, based on an aggregation of data from three Key Stage 2 cohorts, from 2013 to 2015.35
32 For example, if you had three schools in an area and all FSM pupils were clustered in one school the median school score would actually be zero.
33 The Education (Grammar School Ballots) Regulations 1998 define the following ten local authorities as being wholly selective: Bexley, Buckinghamshire, Kent, Lincolnshire, Medway, Slough, Southend-on-Sea, Torbay, Trafford, and Sutton. See: ‘The Education (Grammar School Ballots) Regulations 1998’, November 1998: http://www.legislation.gov.uk/uksi/1998/2876/made
34 Schools with incomplete FSM data or with fewer than 30 pupils in their Key Stage 4 cohort have been excluded. The City of London and Isles of Scilly do not have any secondary schools suitable for inclusion in the analysis and therefore do not appear in the chart. Rutland has also been excluded on the basis that it has only 3 schools suitable the analysis. Local authorities with an asterisk contain fewer than 10 schools included in the analysis.
28
Comparing the performance of local authorities on the FSM social selection measure at Key Stage 2 and Key Stage 4 shows that there is a weak positive correlation. Whilst there are a number of local authorities which display relatively high levels of social segregation amongst both cohorts (such as Bristol, Poole and Reading), there are others which buck this trend. Bexley and Hillingdon, for example, have high levels of social segregation at Key Stage 4 but quite low levels at Key Stage 2, whereas Wigan is in the top 20 most socially segregated local authorities at Key Stage 2 but is amongst the bottom 10 at Key Stage 4. Levels of social selection by local authority are compared at Key Stages 2 and 4 in Figure 3.7.
29
0 1 2 3 4
Harrow Bolton Bradford Hampshire Bromley Cheshire West and Chester Islington Barking and Dagenham* Plymouth Bracknell Forest* Leeds Tower Hamlets Sunderland Bury Windsor and Maidenhead* Worcestershire Redbridge Medway Enfield Sheffield Buckinghamshire Gloucestershire Wakefield Kirklees Derby Barnet Doncaster St. Helens* Thurrock Salford Bedford* York* Wandsworth Walsall Oldham Milton Keynes South Tyneside* Lincolnshire Lambeth Southampton Coventry Sutton Torbay* Trafford Kingston upon Thames Kingston upon Hull, City of Wirral Kent Liverpool Stoke-on-Trent Southend-on-Sea Halton* Swindon Westminster Slough Newcastle upon Tyne Darlington* Warrington Blackburn with Darwen Birmingham Bexley Nottingham Stockton-on-Tees North East Lincolnshire Middlesbrough* Merton* Knowsley* Hillingdon Hammersmith and Fulham* Portsmouth Bristol, City of Poole* Reading* Blackpool*
0 1 2 3 4
[image:30.595.48.548.34.815.2]Waltham Forest Solihull North Somerset Isle of Wight* Cornwall Norfolk Wigan Newham North Lincolnshire Herefordshire Nottinghamshire Brent East Sussex Staffordshire Northumberland Richmond upon Thames* West Sussex Wokingham* Oxfordshire Hartlepool* Surrey Rotherham Bath and North East Somerset Sandwell Somerset Central Bedfordshire Shropshire Havering Derbyshire Calderdale Kensington and Chelsea* Suffolk South Gloucestershire Gateshead* Warwickshire Cambridgeshire Hackney Cheshire East Lewisham Devon East Riding of Yorkshire Sefton Camden* Lancashire Tameside Rochdale Dorset Leicestershire Wiltshire Durham Barnsley North Tyneside Greenwich Luton Hertfordshire Essex Stockport Croydon Southwark Cumbria North Yorkshire Hounslow Brighton and Hove* Haringey West Berkshire Bournemouth Northamptonshire Manchester Ealing Leicester Dudley Redcar and Cleveland Telford and Wrekin Peterborough Wolverhampton
Figure 3.5: Social selection by FSM eligibility, by local authority, Key Stage 4, 2015
30
0 1 2 3 4
Suffolk Sheffield Northamptonshire Hertfordshire Tameside Wolverhampton Nottinghamshire Warrington Hampshire Surrey Warwickshire Harrow Solihull Durham Coventry Doncaster Kent Hartlepool Bury Cheshire East Peterborough Isle of Wight Gloucestershire Nottingham Oldham South Gloucestershire Kingston upon Thames North Yorkshire Wandsworth Lancashire Portsmouth Kirklees Hounslow Blackpool Newcastle upon Tyne Derby Dudley Sefton Stockport Leicester Blackburn with Darwen Gateshead Calderdale Staffordshire Stoke-on-Trent Windsor and Maidenhead Sunderland Barnet South Tyneside North Tyneside North East Lincolnshire Sutton Bournemouth Telford and Wrekin Liverpool Cumbria Plymouth Knowsley Trafford Redcar and Cleveland Middlesbrough Wigan Kingston upon Hull, City of Cheshire West and Chester Brighton and Hove Darlington Halton Southampton Stockton-on-Tees Southend-on-Sea Reading Poole Bristol, City of Wirral
0 1 2 3 4
[image:31.595.48.550.38.833.2]Tower Hamlets Southwark Waltham Forest Brent Hackney Newham Barking and Dagenham Northumberland Camden Wokingham Sandwell North Somerset Bedford Central Bedfordshire Luton Redbridge Dorset Bradford Haringey Richmond upon Thames Bracknell Forest North Lincolnshire Enfield Rochdale Bolton Bexley Leicestershire Kensington and Chelsea Walsall Thurrock Lambeth Cambridgeshire Lewisham Bath and North East Somerset West Sussex Leeds Worcestershire Greenwich Hillingdon Norfolk Wiltshire Bromley Manchester Rutland Medway Slough Shropshire West Berkshire Cornwall Devon Birmingham St. Helens Westminster Havering York Herefordshire Islington Oxfordshire East Sussex East Riding of Yorkshire Derbyshire Lincolnshire Hammersmith and Fulham Essex Somerset Merton Milton Keynes Croydon Rotherham Torbay Barnsley Swindon Ealing Salford Wakefield Buckinghamshire
31
Figure 3.7: Social selection by FSM eligibility, comparing Key Stage 2 with Key Stage 4, by local authority
Characteristics of the most socially selective schools
The previous two sections have examined overall levels of selection in different school types and across local authorities. The final part of this chapter considers the most socially selective schools at Key Stages 2 and 4 according to FSM eligibility.
[image:32.595.90.421.94.275.2]At Key Stage 4, the top 100 most socially selective schools are identified according to their social selection score on this criteria. Amongst this group, grammar schools and schools which perform in the top 25 per cent for pupil progress between Key Stages 2 and 4 are hugely over-represented; the number of faith schools is also higher than the national proportion, albeit to a lesser extent.
Figure 3.8: Characteristics of top 100 socially selective schools by FSM eligibility at Key Stage 4, 2015
School type Number of schools in top 100
socially selective secondary schools
Percentage of secondary schools nationally eligible for inclusion in analysis36
Faith schools 30 18.8%
Grammar 65 5.4%
Top 25 per cent value added 70 25.2%
Schools in urban areas 90 86.3%
There is considerable overlap between some of the school types listed in Figure 3.8, above. The Venn diagram below separates out the 100 schools into the different combinations of categories into which they can fall. The numbers in brackets show the total number and percentage of schools eligible for inclusion in this analysis in each category. Comparing this percentage with the number of schools which are in the top 100 most socially selective schools provides an indication of which types of schools are over-represented amongst highly socially selective schools (notably, non-faith
grammar schools in urban areas which are in the top 25 per cent nationally for progress made by pupils between Key Stages 2 and 4) and which types are under-represented (particularly
36 Schools with incomplete data on FSM eligibility or with fewer than 30 pupils in their 2015 Key Stage 4 cohort are excluded from this analysis.
R² = 0.2013
0 0.5 1 1.5 2 2.5 3
0 0.5 1 1.5 2
Ke
y St
age
4 in
ter
-q
u
ar
tile
ra
n
ge
in
social
se
le
ctio
n
s
core
32 Grammar and urban school only: 6(40, 1.3%)
[image:33.595.79.556.154.472.2]grammar, non-faith schools in urban areas which do not have a value added score in the top 25 per cent nationally).
Figure 3.9: Breakdown of school types found amongst top 100 socially selective schools by FSM eligibility at Key Stage 4, 2015
At Key Stage 2, there are 518 schools with a social selection score of 0 based on an aggregation of FSM data for three cohorts, from 2013, 2014 and 2015. This report therefore includes all 518 schools in analysis of the characteristics of the most socially selective schools at Key Stage 2, where the patterns are very different from at Key Stage 4. In contrast to the findings for Key Stage 4, primary schools with progress scores in the top 25 per cent nationally are slightly under-represented
amongst the most socially selective schools at Key Stage 237, whilst there is a far lower proportion of urban schools amongst this group than is the case at a national level. Faith schools are again over-represented amongst the most socially selective schools at Key Stage 2.
Again, many primary schools fall into more than one of the categories outlined in Figure 3.10. The Venn diagram below provides a breakdown (raw number and percentage) of the different
combinations of categories into which the 518 schools are placed. Again, the numbers in brackets show the total number and percentage of schools eligible for inclusion in the analysis in each category. This enables identification of school types which are over-represented amongst the very socially selective group of schools – for example faith schools which are neither in urban areas not with a value added score in the top 25 per cent nationally – and also types which are
37 This may in part be due to published value added measures capturing progress between Key Stage 1 and Key Stage 2 and not the whole of primary school.
Faith
Grammar
Top 25 per cent value added
Urban
43 (97, 3.2%)
4 (4, 0.1%)
0 (0, 0.0%)
7 (389, 12.8%)
9 (345, 11.4%)
1 (3, 0.1%) 7
(168, 5.5%)
9 (15, 0.5%)
0 (0, 0.0%) 0
(23, 0.8%)
5 (1,561, 51.4%)
2 (3, 0.1%)
2 (78, 2.6%) Top 25 per cent value added and faith school only: 1(14, 0.5%)
None of categories: 4(295, 9.7%)
33
[image:34.595.108.554.304.667.2]represented – notably, non-faith urban schools which are not in the top 25 per cent for pupil progress.
Figure 3.10: Characteristics of most socially selective schools by FSM eligibility at Key Stage 2, 2013-15
School type
Number of schools in top socially selective primary schools
Percentage of top socially selective primary schools
Percentage of primary schools nationally that are eligible for inclusion in social selection analysis
Faith schools 343 66.2% 38.9%
Top 25 per cent value added38 113 21.8% 24.8%
Schools in urban areas 67 12.9% 70.3%
Figure 3.11: Breakdown of school types found amongst most socially selective schools by FSM eligibility at Key Stage 2, 2015
38 Value added score is based on 2015 data only. Note that not all schools with Key Stage 2 pupils have a value added score published and so, by definition, cannot appear within the Top 25 per cent category. They are included here for completeness.
Faith
Top 25 per cent value added
Urban
13, 2.5% (920, 6.6%)
59, 11.4% (432, 3.1%)
6, 1.2% (1,775, 12.7%) 34, 6.6%
(2,306, 16.4%)
237, 45.7% (1,794, 12.8%)
35, 6.8% (348, 2.5%) 14, 2.7%
(4,855, 34.6%) None of categories: 120, 23.2% (1,591, 11.3%)
Number and % of schools amongst most socially selective that have this combination of characteristics
34
Part 4: Attainment and progress in faith schools
This section presents headline performance statistics for pupils attending faith schools, and compares these with the equivalent statistics for non-faith schools at both primary and secondary level. It goes on to look at the attainment and progress of these pupils according to pupil
characteristics (including eligibility for free school meals, English as an additional language, special educational needs status, and ethnicity).
As discussed in Part 3, the characteristics of pupils who attend faith schools are, on average, different from those that attend non-faith schools. Given that such characteristics are related to pupil outcomes it is important to consider the performance of faith schools in context. Therefore, in this section we also consider the attainment of pupils in faith schools to similar pupils elsewhere. There are no state-funded special schools with a recorded religious denomination. Therefore, analysis of attainment is restricted to state-funded mainstream schools.39
Attainment and progress in faith and non-faith schools at Key Stage 2
In 2015, pupils that attended faith schools were on average slightly more likely to achieve
government performance benchmarks than pupils in faith schools. 81 per cent of pupils in non-faith primary schools achieved level 4 or above in reading, writing and mathematics at the end of Key Stage 2. This was lower than the rate seen in Church of England schools (83 per cent) and Roman Catholic schools (85 per cent) but in line with other schools recorded as Other Christian (81 per cent). Pupils in non-faith schools were also less likely achieve level 4B or above, the level that was at the time viewed as secondary ready,40 than pupils in faith schools (Figure 4.1). Attainment was higher still in Other Faith schools – pupils attending Jewish, Muslim or Sikh schools – but the number of schools included is small, with 40 institutions accommodating around 1,700 pupils at the end of Key Stage 2.
This pattern of results is not so clear when considering value added, i.e. performance after
controlling for prior attainment. On this scale, a score of +1.0 means that pupils make more progress – equivalent to about a term – than pupils with similar prior attainment nationally. The value added score from Key Stage 1 to Key Stage 2 for pupils in non-faith schools was -0.1, the same as that for pupils at Church of England schools. The progress of pupils in Catholic schools was slightly above average at +0.3 (Figure 4.2). It is important to caveat this by saying that value added measures the progress between the end of Key Stage 1 and the end of Key Stage 2 and therefore does not capture progress during Key Stage 1. The majority of primary schools cover both Key Stage 1 and Key Stage 2 and high performance in the former can make it more difficult to demonstrate good progress in the latter.
39 This is because special schools would only get included within the non-faith category. Special schools have, on average, lower results on these measures and so their inclusion would overstate the difference between faith and non-faith schools.
35
Figure 4.1: Proportion of pupils attaining Key Stage 2 headline measures, by religious denomination of school, 2015
Figure 4.2: Mean value added score from Key Stage 1 to Key Stage 2, by religious denomination of school, 2015
Attainment and progress in faith and non-faith schools at Key Stage 4
As in primary schools, pupils that attend faith secondary schools were on average more likely to achieve government performance benchmarks than pupils in non-faith schools. In 2015, 57.4 per cent of pupils in non-faith secondary schools achieved 5+A*-C at GCSE including English and
mathematics. This was lower than the rate seen in Church of England schools (60.6 per cent), Roman Catholic schools (63.2 per cent) but broadly in line with schools classified as Other Christian. Pupils in non-faith schools are less likely to enter or achieve the EBacc than pupils in Church of England or
81%
69%
23% 83%
72%
26% 85%
76%
28% 81%
70%
23% 86%
78%
35%
0% 10% 20% 30% 40% 50% 60% 70% 80% 90% 100%
Level 4+ RWM Level 4B+ RWM Level 5+ RWM
Non-faith Church of England Roman Catholic Other Christian Other faith schools
-0.1 -0.1
+0.3
-0.4
+0.4
-0.5 -0.4 -0.3 -0.2 -0.1 0.0 +0.1 +0.2 +0.3 +0.4 +0.5
[image:36.595.76.514.399.636.2]36
Roman Catholic secondary schools but achieve broadly the same outcomes as those in Other Christian schools.
[image:37.595.80.515.186.449.2]Attainment was higher still in Other Faith schools (pupils educated at Jewish, Muslim or Sikh schools) but, again, the number of schools included is small: fewer than 20 institutions with fewer than 2,000 pupils at the end of Key Stage 4.
Figure 4.3: Proportion of pupils attaining Key Stage 4 headline measures, by religious denomination, 2015
A similar pattern of results is seen when considering value added (performance after controlling for prior attainment) as shown in Figure 4.4. The value added score from Key Stage 2 to Key Stage 4 for pupils in Church of England schools was +2.2, meaning that on average these pupils achieved around one-twentieth of a grade higher in each of 8 GCSE subjects than pupils with similar prior attainment nationally. For pupils in Catholic schools the figure was higher at +8.1 meaning that on average pupils achieved one-sixth of a grade higher in each of 8 GCSE subjects than pupils with similar prior attainment nationally. Pupils in other faith schools scored very highly on this measure. A score of +30.6 is equivalent to achieving two-thirds of a grade higher in each of 8 subjects than pupils with similar prior attainment nationally.41
As with overall attainment, this pattern of results will be affected by the characteristics of pupils that did and did not attend faith schools. This is discussed further later in this section.
41 It should be noted however that this is based on a small number of schools (a total of 19) so this may disproportionately reflect the performance of individual schools.
57.4%
38.7%
24.1% 60.6%
40.9%
25.5% 63.2%
44.2%
29.3% 56.7%
37.5%
23.6% 76.1%
54.3%
41.1%
0% 10% 20% 30% 40% 50% 60% 70% 80% 90% 100%
5+A*-C inc E&M EBacc Entry Ebacc achievement
37
Figure 4.4: Mean value added score from Key Stage 2 to Key Stage 4, by religious denomination of school, 2015
Attainment by pupil characteristics in faith schools
Our previous publications have highlighted the long standing variation in the performance of pupils from different backgrounds. Pupils from disadvantaged backgrounds tend to perform worse at the end of secondary school than their peers. The same applies to pupils from Black Caribbean and Pakistani backgrounds, and those with special educational needs. Conversely, pupils from Indian and Chinese backgrounds tend to perform better than average.42
In this section we consider how attainment varies by pupil characteristics in faith and non-faith schools.
Pupils in faith schools achieve higher outcomes than those in non-faith schools for each
characteristic, at both Key Stage 2 and Key Stage 4. At Key Stage 2 these differences are relatively small. For example, in 2015, 53 per cent of pupils eligible for free school meals in non-faith schools achieved level 4B or above in each of reading, writing and mathematics. In faith schools the figure was 55 per cent. At Key Stage 4, 32 per cent of pupils eligible for free school meals in non-faith schools achieved five good GCSEs including English and mathematics whereas 38 per cent of pupils in faith schools did so.
When considering four key characteristics – eligibility for free school meals, first language other than English, having special educational needs, and being from a non-white British background – the relative prevalence of such pupils varies by key stage. At Key Stage 2 all of these groups perform better in faith schools than elsewhere but they are also less prevalent in faith schools than they are in non-faith schools. At Key Stage 4, pupils from these groups that attend faith schools continue to outperform those at non-faith schools but non-white British and pupils with a first language other
42 N. Perera et al, ‘Education in England: Annual Report’, CentreForum, April 2016. -1.1
+2.2
+8.1
-1.1
+30.6
-5.0 0.0 +5.0 +10.0 +15.0 +20.0 +25.0 +30.0 +35.0