“
STUDY OF CAROTID INTIMA MEDIA THICKNESS
AS A PREDICTOR OF MACROVASCULAR
COMPLICATIONS IN TYPE 2 DIABETES MELLITUS”
.
Submitted in partial fulfillment of the
Requirement for
M.D. DEGREE (BRANCH -I) GENERAL MEDICINE
OF
THE TAMILNADU DR. M.G.R. MEDICAL UNIVERSITY
CHENNAI.
DEPARTMENTOFMEDICINE
KILPAUK MEDICAL COLLEGE, CHENNAI.
BONAFIDE CERTIFICATE
This is to certify that the dissertation entitled ““STUDY OF CAROTID INTIMA MEDIA THICKNESS AS A PREDICTOR OF MACROVASCULAR COMPLICATIONS IN TYPE 2 DIABETES MELLITUS”.” submitted by Dr. K. JEEVITHA RAJALAKSHMI to the Tamil Nadu Dr. M.G.R.Medical University, Chennai in partial
fulfillment of the requirement for the award of M.D Degree Branch I
(General Medicine) during the academic period from July 2013 to June
2016 is a bonafide research work carried out by her under my direct
supervision & guidance.
PROF.DR.S.USHALAKSHMI MD., FMMC
Prof and HOD of Medicine, Department of Medicine, Kilpauk Medical College, Chennai.
Prof.Dr.R.NARAYANA BABU MD., DCH
THE DEAN
DECLARATION
I, DR.K.JEEVITHA RAJALAKSHMI, declare that, I carried out this work on, “STUDY OF CAROTID INTIMA MEDIA THICKNESS
AS A PREDICTOR OF MACROVASCULAR COMPLICATIONS IN TYPE 2 DIABETES MELLITUS” at the Department of Medicine, Kilpauk medical college & hospital during the period of February 2015 to
July 2015. This is submitted to The Tamilnadu Dr.M.G.R.Medical
University, Chennai in partial fulfillment of the requirement for the award
of M.D degree (Branch –I) General Medicine.
ACKNOWLEDGEMENT
At the outset, I wish to thank our Dean Prof.Dr.R.NARAYANA BABU MD., DCH, for permitting me to use the facilities of Kilpauk Medical College and Hospital to conduct this study.
It is with immense honor and gratitude that I specially thank
Prof.Dr.S.USHALAKSHMI M.D., FMMC, Professor& HOD of Medicine, Kilpauk Medical College, Chennai for her supportiveness and
guidance in my study work.
Words fall short to describe my deep sense of gratitude and respect
that express my utmost thank to my unit chief Prof.Dr.S.Ushalakashmi M.D., FMMC, a teacher with excellent clinical skills and knowledge for her unfailing inspiration, affectionate guidance and advice throughout the
course of present study. Her valuable suggestions, sympathetic, helping
nature and encouragement enabled me to attain this achievement
Also I would like to show my gratitude to the
Prof.Dr.Murugapandian M.D., D.M Department of Neurology, for their supportiveness and guidance to my study work.
I offer my heartfelt thanks to Assistant Professors Dr.M.Bathragiri M.D., Dr.A.Marimuthu M.D, and Dr.Narendran M.D, for their constant encouragement, timely help and critical suggestions throughout the study.
I would like to take this opportunity to show gratitude to my Dear
Parents M. Krishnamoorthy and K. Vasuki and my Husband
Dr.K.P.Kannan for their never ending support in finishing this thesis. My friends have stood by me during my times of need. Their help and
support have been invaluable to this study.
Last but not the least I thank all the patients who cooperated with the
study in spite of their illness and stigmata. This work would be complete
and successful, if it had contributed, even in the small possible way to
CONTENTS
S.No TOPIC Page No
1 Introduction 1
2 Review of literature 4
3 Aim of study 53
4 Materials and methods 55 5 Observation and Analysis 57 6 Discussion and Summary 76
7 Conclusion 79
8 APPENDIX
i Abbreviations ii Bibliography iii Master chart
INTRODUCTION
The most common cause of mortality in patients with type 2 diabetes
mellitus (T2DM) are cardiovascular diseases.[1] The Multiple Risk Factor
Intervention Trial (MRFIT) and the Framingham study showed a 2–3 fold
increase in the risk of atherosclerotic disease in patients with T2DM.[2,3]
Similarly, progression of atherosclerosis in persons with T2DM shown in
Insulin Resistance Atherosclerotic Study.[4] The Cholesterol Lowering
Atherosclerosis Study (CLAS) has shown the heightened risk of
atherogenic profile associated with Diabetes Mellitus patients.[5]
World Health Organization has defined stroke as “the rapidly
developing clinical signs of focal/global disturbances of cerebral function,
with symptoms lasting 24 hours or longer or leading to death with no
apparent cause other than of vascular origin”.[6]
Two types of stroke are: (i) ischemic 80–85% and (ii) hemorrhagic
15–20%.[7] Ischemic strokes are further divided into (a) embolic (b)
thrombotic and (c) secondary to systemic hypoperfusion. Apart from other
risk factors like smoking, hypertension, hyperlipidemia, family history,
etc., diabetes mellitus is a well-recognized risk factor of cerebro vascular
Carotid intima media thickness (CIMT) is widely used as a marker
of atherosclerosis, considered to be an important pathogenic mechanism of
Macrovascular diseases.[10]
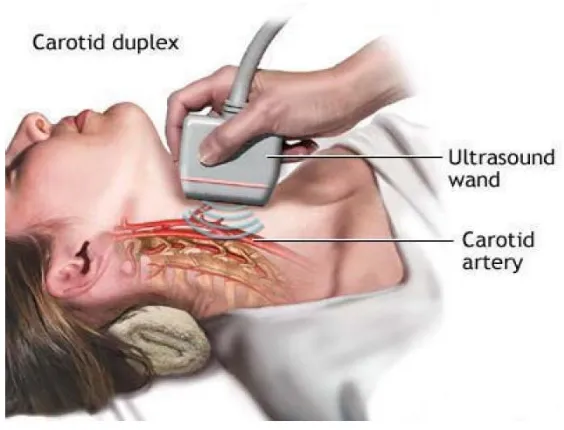
Carotid artery intima-media thickness by B mode ultrasound is a
simple, non-invasive and reproducible imaging parameter to evaluate
atherosclerotic vascular diseases.
Recently, considerable attention has been directed at the carotid
arteries intima media thickness as an early marker of atherosclerotic
disease and as a means of showing the effectiveness of medical therapies
in treating atherosclerosis. Non-invasive techniques such as B-mode
ultrasound can directly assess the carotid intima-media thickness (IMT),
which corresponds to the histologic intima and media thickness.
Ultrasound imaging of carotid vessels can provide information on
Carotid Intima Medial Thickness (CIMT),wall diameter, plaque presence
and type, and calcification, offers the ability to examine pre-symptomatic
lesions, assess atherosclerotic burden and hence the risk of macrovascular
events.
Such non-invasive screening procedures are valuable in identifying
diabetic patients at risk for macro vascular complications. In clinical
The carotid arteries are among the vessels that are prone to
developing overt atherosclerotic lesions in the presence of risk factors such
as smoking, diabetes, hypertension, and dyslipedemia.10,11
Diabetes mellitus patients suffer unduly from premature and severe
atherosclerosis. The Framingham study shown that “ diabetic individuals
have higher serum concentrations of lipids and hypertension, obesity, and
thus they are more prone to metabolic syndrome and it’s sequelae, namely
coronary artery disease (CAD), cerebrovascular disease and vascular
atherosclerosis” .12
In type 2 DM, carotid intimal thickness is significantly more than in
corresponding healthy age and sex matched non diabetic subjects.
Hence measurement of carotid intimal thickness using high
resolution B mode ultrasonography which is non- invasive well validated
REVIEW OF LITERATURE
EPIDEMIOLOGY OF TYPE 2 DIABETES:The global burden due to diabetes is mostly contributed by type 2
diabetes which constitutes 80% to 95% of the total diabetic population.
Diabetes mellitus is the most common metabolic disease which is
prevalent in every part of the world and is a major public health challenge
of the twenty-first century. The explosive increase in the prevalence of
diabetes seen in the last three decades poses huge clinical and economic
burden in many countries. The estimates by the International Diabetes
Federation (IDF) show that 285 million adults (20 to 79 years) are affected
by the disorder in 2010. Epidemiological trends indicate that without
proper control and prevention, its prevalence will increase further to 438
million in 2030. This accounts for a global increase by 54%, i.e. a rise from
a prevalence of 6.6% to 7.8% in 20 years. Nearly 70% of the people with
diabetes live in developing countries; the largest numbers are in the Indian
subcontinent and China. Nauru has the highest prevalence of diabetes
(30.9%) and will continue to be so in 2030 (33.4%). Many Arab countries,
Tonga, and Malaysia are among the top ten countries having high
percentages of people with diabetes. There is little gender difference in the
diabetes. The largest numbers with diabetes are in the 40 to 59 age groups
(132 million, in 2010) which is expected to rise further. By 2030, there will
be more diabetic people in the 60 to 79 age groups (196 millions).(25,26)
DIABETES PREVALENCE IN INDIA
Diabetes prevalence in India in 1970’s was 2.3% in urban and 1.5%
in rural areas, as shown by the multi-centric study by the Indian Council
of Medical Research (ICMR). In 2000s, the prevalence has risen to 12%
to 19% in urban areas and to 4% to 9% in rural areas. Though, the studies
are not strictly comparable due to methodological differences, the rising
trend in prevalence of diabetes in urban and rural areas in India, is evident.
National studies or population based studies on diabetic complications are
sparse in India.(26,27) A few population based studies indicate the
prevalence of retinopathy to be 18% to 27.0% and overt nephropathy to be
about 2.2% with a large percentage (27%) having microalbuminuria.
Peripheral vascular disease is prevalent in 6.3%, peripheral neuropathy in
26%, and coronary artery disease (CAD) is detected in 21%. The major
contributory factors for the high prevalence of the complications are;
delayed diagnosis of diabetes, inadequate control of glycaemia,
hypertension, and lack of awareness about the disease among majority of
ECONOMIC BURDEN DUE TO DIABETES
Diabetes care cost high and is escalating world wide. It is estimated
by the WHO that the global expenditure for diabetes care would increase
from 234 Billions in 2007 to 411 Billions in the next 20 years. The WHO
estimate is based on “ lost productivity due to diabetes, heart diseases, and
stroke together show that over the next 10 years, lost national income in
billions of USD will amount to 555.7 in China, 303.2 in Russian
Federation, 336.6 in India, 49.2 in Brazil, and 2.5 in Tanzania”.(26,27)
A study in India showed that the median expenditure had risen from
INR 4,200 to INR 9,000 between 1998 to 2005. The indirect cost is much
higher than the direct cost and is more difficult to assess. The proportion
of annual income spent on health care is about 25% to 30% by the people.
The cost increases many fold when diabetic complications are present.
PREVENTION OF DIABETES
Several systematic long-term prospective studies from different
parts of the world have shown that type 2 diabetes is largely preventable.
Although the genetic factors cannot be modified, its interaction with the
diabetogenic environmental factors can be prevented by modifying
activity. Indian Diabetes Prevention Programmes (IDPP-1 and IDPP-2)
have shown that by improving physical activity and by using healthy diet,
incidence of diabetes can be significantly reduced with a relative risk
reduction of ~ 30%, in persons with IGT. Metformin in small doses was
also found to be effective in primary prevention of diabetes. Lifestyle
changes due to urbanisation and modernisation have caused unhealthy diet
habits, lack of physical activity, and increased stress leading to overweight
or obesity with higher levels of insulin resistance. India and many other
developing countries are going through this scenario and as a result, we
notice more of chronic metabolic disorders than communicable diseases
posing increasing challenge to the national health.(29)
Type 2 diabetes mellitus patients are at 2- to 6-fold higher risk for
macrovascular disease than persons without diabetes. Moreover,
atherosclerosis is thought to begin in the early prediabetic stage and to
progress silently for years before clinical events such as acute coronary
syndromes, cerebrovascular accidents or peripheral vascular disease occur.
So, The above facts compels strongly for detecting early changes of
atherosclerosis and starting intervention earlier in type 2 diabetic
GENETIC FACTORS IN DIABETES:
Type 2 diabetes is a polygenic disorder, caused by a cluster of
susceptibility genes. The classic method of candidate gene identification
has been unsuccessful in unravelling these genes. The problem has also
been approached by studying the functional candidate genes, tracing back
the functional or biochemical abnormality to the genetic abnormality.
Further, linkage analysis and micro satellite genotyping technique
followed by positional cloning has been tried with limited success. (38)
Although the prevalence of these varieties of diabetes would vary in
various ethnic groups, it is estimated that they do not make more than about
5% to 10% of young-age diabetes. Some rare genetic abnormalities
described are insulin gene abnormality which produces an abnormal
insulin or a convertase deficiency which impairs the conversion of
proinsulin to insulin. Abnormalities of insulin receptor are rare. They
produce syndromes of extreme insulin resistance (type A insulin
resistance, Leprechaunism, Rabson-Mendenhall syndrome; Table 1). If all
these anomalies are put together, they may not make more than 1% of all
type 2 diabetes. The search for genetic abnormalities in the common form
of type 2 diabetes has been very intense but not very fruitful. Most
susceptibility genes described increased the hazard ratio in diabetics versus
Of a variety of candidate genes, calpain-10, Kir 6.2, peroxisome
proliferator activated receptor-γ, hepatocyte nuclear factor-4α gene and
transcription factor 7-like 2 gene are important. Many of these genes
predispose to obesity, thus leading to diabetes. However, an interesting
gene, ENPP-1 K121Q causes insulin resistance in the non-obese Asian
Indians and is one of the susceptibility genes in this population.
ENVIRONMENTAL FACTORS
Physical inactivity and excessive caloric intake are well recognised
environmental factors producing type 2 diabetes. These factors can
produce the disease independently in a genetically susceptible person, but
usually work via production of obesity. Obesity and type 2 diabetes are
inextricably interrelated. They further coexist in the form of metabolic
syndrome, together with other anomalies like hypertension, high
triglycerides, and low HDL-cholesterol. It is estimated that 25% to 30% of
the population in India and elsewhere suffers from the metabolic
syndrome. In the shadow of a global spurt of obesity, type 2 diabetes is
emerging as an epidemic. Obesity results from the interaction of multiple
susceptibility genes with environmental factors. By various estimates,
aetiologically hereditary factors account for 50% to 70% of the obesity.
Obesity is characterised by insulin resistance, an important feature of type
GENE-ENVIRONMENT INTERACTIONS
The mechanism of interaction of gene and environment is a very
complex issue. The environmental factors interact by altering the
expression of genes. There is also a gene-gene interaction. Intrauterine
environment also may influence the subsequent development of many
non-communicable diseases like diabetes, obesity, and hypertension. Low birth
weight, presumably due to poor maternal nutrition leads to development of
insulin resistance in childhood and adult life. This is further exacerbated
by over-nutrition in the post-natal period.(39,40) Epigenetic phenomenon,
where unchanged DNA sequence can lead to altered phenotype, probably
due to enhanced or suppressed expression of certain genes that may be
responsible for obesity and diabetes Environmental factors may operate
through epigenesis.
BIOCHEMICAL PERTURBATIONS
The biochemical perturbations in type 2 diabetes were described
earlier than the genetic factors. Of these, the most well known
abnormalities are of peripheral and hepatic insulin resistance, and impaired
β-cell function. Peripheral and Hepatic Insulin Resistance With the advent
of radioimmunoassay, massive data on serum insulin levels in obesity and
Hyperinsulinaemia was described first in obesity and later in type 2
diabetes, including type 2 normal weight diabetic. Thus, the concept of
insulin resistance emerged. In spite of high insulin levels, there is poor
glucose utilisation and insulin inaction in the muscle, adipose tissue, and
liver.
In type 2 diabetes, adipose tissue in general and visceral fat in
particular, exhibits a decreased inhibition of lipolysis and increased
lipoprotein lipase activity, both resulting in a heightened flux of fatty acids
in the liver and other tissues. High fatty acids levels are known to inhibit
glucose utilisation, as demonstrated by Randle (glucose-fatty acid
cycle).(40,41) In type 2 diabetes and obesity, the adipose tissue also
expresses increased amounts of 11β-hydroxysteroid dehydrogenase type 1
(11 β HSD-1), leading to increased cortisol levels and increased lipolysis
locally. Adipose tissue is known to cause insulin resistance by secreting
TNF-α and interleukins. Of the multiple adipose tissue hormones, resistin
is responsible for insulin resistance, while adiponectin and leptin
ameliorate insulin resistance. Although leptin levels are high in type 2
diabetes, there is also a state of leptin resistance. These biochemical
abnormalities are accentuated in the abdominal adipose tissue, which is
known to be abundant in type 2 diabetes.
relatively low BMI, which may be one of the reasons for the increased type
2 diabetes. For this reason, the BMI above 23 kg/m2 is also considered
overweight in the Asian Indians, unlike the cut-off point of 25 kg/m2 in the
Caucasians. The skeletal muscle glucose utilisation is impaired to a greater
degree than adipose tissue in type 2 diabetes (Figure 1). In the post-prandial
state, the glucose is primarily deposited as glycogen in the muscle.
Hyperinsulinaemic-euglycaemic clamp studies have shown that the
non-oxidative glucose disposal, like that in hexose monophosphate (HMP)
shunt is severely impaired in type 2 diabetes and other insulin resistant
states. The cause of this resistance is a high free fatty acid (FFA)
concentration in the myocytes, as demonstrated in several studies by using
a nuclear-magnetic resonance imaging. This would limit the glycogen
synthesis through the HMP shunt. Recently, a defect in glucose transport
has been described in the milieu of high fatty acids.(41,42) In insulin
resistant state, fatty acid oxidation or re-esterification leading to
triglyceride synthesis is also impaired, thus leading to high levels of
intra-myocellular FFA. On exercise, many of the abnormalities, including the
diminished amount of glycogen synthase gets corrected, thus improving
insulin sensitivity. Exercise increases glucose transporter activity,
improves capillary density, increases mitochondrial mass, and increases
The hepatic insulin resistance leads to enhanced gluconeogenesis
and glycogenolysis. Thus, increased hepatic glucose production is a
hallmark of uncontrolled diabetes. Type 2 diabetes is often associated with
a fatty liver, with or without elevated liver enzymes and evidence of hepatic
necrosis.
It is also a manifestation of hepatic insulin resistance and is often
reversed by weight loss and the use of insulin sensitisers. The molecular
mechanism of insulin resistance has been a subject of intensive studies
(Figure 2).
The resistance is very rarely due to an abnormal insulin or insulin
receptor. Sustained hyperglycaemia produces glucotoxicity, probably by a
failure to enhance hexosamine pathway, leading to increased glucosamine
levels. Increased glucosamine levels can produce insulin resistance in
adipose tissue and skeletal muscle. Sustained hyperinsulinaemia also
down-regulates the insulin receptor and further aggravates insulin
resistance.(39,40) The main locus of the resistance appears to reside at the
post-receptor level. Insulin signalling is initiated by the binding of insulin
to alpha subunits of the receptors. This initiates a cascade of
auto-phosphorylation and deauto-phosphorylation through the intra-cellular tyrosine
kinase, insulin receptor substrates (IRS-1, 2, 3, 4) and other signal
The β subunit of insulin receptor has been shown to undergo besides
tyrosine auto-phosphorylation, a serine-threonine phosphorylation. The
latter type of phosphorylation increases insulin resistance and impairs
insulin signal transduction. The insulin signal is terminated by
dephosphorylation of the β subunit of receptor by tyrosine phosphatases,
[image:23.595.125.465.283.598.2]the activities of which is increased in insulin resistant states.(43)
Fig: Molecular mechanisms of insulin resistance.
Following the insulin receptor phosphorylation a number of down
stream events, including an increase in phosphatidyl inositol-3 kinase
GLUT-4 is not depleted, but its translocation is hampered. The
glucocorticoid-induced insulin resistance is also associated with a reduced
insulin stimulated IRS-1 associated Pl-3 kinase.
Insulin Secretory Defects in Type 2 Diabetes
In a non-diabetic individual, besides the meal-related insulin
secretion, there are rapid oscillations in insulin secretion every 8 to 15 min,
without any glycaemic stimulus. There is also a circadian rhythm occurring
every 80 to 150 min. Overall, about 18 to 32 units of insulin are secreted
daily and about 50% is extracted by the liver for local action during its first
passage. In type 2 diabetes, the rapid meal-related insulin secretion, which
primarily occurs in about 30 min post-meal and mostly represents the
preformed insulin, is attenuated. The post-meal response for the 2-hour
period post-meal appears to be exaggerated but in relation to the high
glycaemic levels is indeed also impaired. In obesity and impaired glucose
tolerance group, absolute amounts of insulin secreted may be
excessive.(38,39)
The molecular mechanism of this phenomenon is probably an
overexpression of hexokinase gene as compared to the glucokinase gene.
As the former has a low Michaelis constant (Km) for glucose,
non-meal related insulin responses is also altered or attenuated. The β-cell mass
appears to be slightly reduced at the time of diagnosis of diabetes; however,
the functional capacity is impaired out of proportion to its mass and hence
in many studies, a 50 % reduced insulin response has been described at the
onset of type 2 diabetes. Subsequently, the β cell mass declines further in
a relentless fashion with increasing insulinopaenia. This is at time
correlated to fibrillary amylin deposition in the β-cells.(43)
The genetic factors that determine β cell differentiation, growth and
apoptosis are being intensively studied at present. The growth factors and
their biology is yet to be elucidated. It obviously holds the key to a fruitful
avenue for intervention. However, it is characterised by an early apoptosis
of β cells. The insulin resistance and β cell failure exist and progress pari
passu. In early phases there is predominately a resistant state.
Subsequently, β cell failure dominates the scene. The β-cell is able to
compensate by increased insulin secretion in the face of rising blood
glucose, but at about 140 mg/dL of blood glucose the insulin secretion
levels off and a further rise in blood glucose results in diminishing insulin
secretion (Figure 3). In about 10% of type 1 diabetics, the β cell failure
may be due to auto immunity. This is called latent autoimmune diabetes of
adults (LADA) and aetiologically represents a forme fruste of type 1
OTHER PATHOGENETIC MECHANISMS
Besides the role of β cell, skeletal muscle, adipose tissue, and liver
in the genesis of type 2 diabetes, a few other important pathogenetic
mechanisms have been described. The gastrointestinal tract secretes a
group of important hormones, collectively labelled as incretins. This
includes two extremely wellknown members: glucagon like peptide
(GLP-1) and glucosedependent insulinotropic peptide (GIP). The former is
secreted from the L-cells of the ileum and the latter from the K-cells located
in the proximal small intestine. These hormones account for the enhanced
insulin secretory response upon ingestion of glucose orally, as compared
to that obtained by intravenous glucose administration. This has been
termed the incretin effect. In type 2 diabetes, the incretin effect is blunted,
which can be corrected by injecting GLP-1 or its longer acting analogue,
like exenatide or liraglutide. GLP-1 is normally destroyed by a group of
enzymes called dipeptyl peptidases, of which dipeptyl peptidase-IV
(DPPIV) is the predominant one. Compounds inhibiting DPP-IV inhibitors
prolong the effect of endogenous GLP-1 and are being used therapeutically
at present.(14)
Although non-suppressibility of glucagon following a meal was
described in type 2 diabetes almost 4 to 5 decades ago, it gained further
anomaly. GLP-1 analogues and DPP-IV inhibitors described above correct
this defect by suppressing glucagon levels post-prandially.
Tachy-alimentation has also been described to aggravate diabetes by exposing the
body to sudden surge of nutrients. GLP-1 analogues and DPP-IV inhibitors
are known to retard gastric emptying, thus offering an additional
mechanism of action.
The hypothalamic neurons and neurotransmitters have been
considered in the pathogenesis of type 2 diabetes. There are numerous
changes described in the neurotransmitter secretion in obesity and type 2
diabetes. The rapid first phase insulin response is mediated through these
pathways. It has been demonstrated that the hypothalamic nuclei regulating
appetite are also insulin resistant. After the ingestion of glucose, the
elevated plasma insulin levels are unable to exert the inhibitory response
in these nuclei in obese, insulin resistant individuals. Hence,
pharmacological manipulation of these neurons by promoting satiety can
be utilised in type 2 diabetes. More recently, dopamine agonists, like
bromocriptine have been shown to improve hyperglycaemia in type 2
diabetes.
Another new pathogenetic mechanism described shows
involvement of kidney in the pathogenesis of type 2 diabetes. Normally
absorbed in the proximal convoluted tubule by a high capacity glucose
transporter called SGLT2. Remaining 10% of the filtered glucose is
absorbed in the straight descending part of the proximal tubule by another
glucose transporter SGLT-1. It has been demonstrated that in type 1
diabetes the tubular maximum for the glucose absorption is increased.
Although it is not clear whether the same holds true of type 2 diabetes, the
levels of SGLT-2 mRNA is four-fold increased in the proximal tubular
renal cells. This may account for increased glucose resorption and hence,
hyperglycaemia. Inhibition of SGLT has provided another avenue to treat
type 2 diabetes.
In summary, type 2 diabetes originates from a complex interaction
of genetic and environmental factors, which express themselves in the form
of myriad biochemical abnormalities.
ATHEROSCLEROSIS IN DIABETES:
The increased prevalence of macrovascular disease among diabetic
subjects prompted research workers to probe into the causes for the
acclerated atherogenic process of diabetic subjects. Dyslipidemias
contribute to considerable increased risk of atherosclerosis and consequent
mortality in diabetes. Dyslipidemias often precedes onset of type 2 DM
HISTORY OF ATHEROSCLEROSIS:
1449-1519- Leonardo Da Vinci described thickening of tunica of blood vessels in aged People. Rokinstansky proposed the Incrustation
theory for pathogenesis of Atherosclerosis.
1858- Virchow proposed Inhibition Hypothesis for pathogenesis of atherosclerosis.
1904- Marchand introduced the term atherosclerosis.
1957 - Robertson modified the Incrustation theory and proposed that intimal thickening results from fibrin deposition with subsequent
organization of fibroblasts and secondary accumulation of lipids.
1960s and 1970s - concepts such as endothelial cell damage and injury were described.
1985- Davies et al proposed that plaque fissuring with thrombosis as the cause of acute coronary syndrome.
1994-George Howard and co-workers concluded that increased CIMT at one site is positively associated with thickened walls at other
carotid sites.
1997-M.L. Bots and co-workers concluded that common carotid intima media thickness and carotid plaques are markers for increased risk
of stroke, coronary heardisease and death within 12 years(7)
LIPIDS
Lipids are organic substances occurring in biologic systems. They
are esters of fatty acids and are insoluble in water but soluble in organic
solvents. Lipids are broadly grouped into
A) Simple lipids -Naturals fats, waxes
B) Compound lipids-Phospholipids, glycolipids, lipoproteins
Among naturals fats, triglycerides form the major part of the dietary
fat intake. Compound lipids are structural lipids. Glycolipids in cell
membrane , sphingomyelins in nervous system and lipoproteins in blood
serve as important physiologic functions. sterols are solid alcohol .The
principle sterol in man is cholesterol.
Fatty acids are esters of a naturally occuring alcohol like glycerol.
Fatty acids from animal tissues are usually unbranced and contain an even
number of carbon atoms. They are classified based on the presence or
absence of double bond between the carbon atoms. when two or more than
Functions of lipids:
1) Cholesterols are structural components of cell membrane. They are
precusors of bile acids and steroid hormones
2) Triglycerides form the major energy stores of the body.
3) Phospholipids are structural constituents of cell membrane.
LIPID METABOLISM IN DIABETES:
Insulin is an anabolic hormone which promotes a) esterification of
fatty acids b) stimulates glucose uptake in peripheral tissues and c)
conversion of glucose to glycogen. Insulin inhibits the hormone sensitive
lipase activity in adipose tissue. hence in insulin deficiency there is
enhanced mobilisation of fatty acids from adipose tissue. This lipolysis
results both from insulin lack of and in the setting of associated counter
hormone excess. Fatty acids and ketone bodies thus formed secondarily
enhance insulin resistance. adequate level of insulin are necessary for
triglyceride synthesis and VLDL secretion. HMG Co A is the rate limiting
enzyme in cholestrol synthesis. Insulin increases its activity and thus
regulates hepatic cholesterol synthesis. In addition insulin, affect LDL
transport kinetics. The fractional catabolic rate of LDL is reduced without
FIG: DEVELOPMENT OF ATHEROSCLEROTIC PLAQUES
Pathologic changes in atherosclerosis process: 1. Intimal thickening
1. Intimal thickening:
The Initial lesion consists of smooth muscle cells, fibrous tissue and
collagens, but no lipid.
2. Fatty streaks:
These composed of very closely packed foam cells, lipid containing
elongated smooth muscle cells and some lymphoid cells. Small
amount of extra cellular lipid, collagen and proteoglycans are also
seen. They are considered as the precursors of plaques.
3. Gelatinous lesions:
These are foci of the increased ground substance in intima with
thinned overlying endothelium. They are also considered as the
precursors of plaques.
4. Atheromatous plaques:
Atheromatous plaque is a fully developed atheromatous lesion.
4. Complicated plaques:
Various complications may occur in fully developed lesions. These
include thrombosis, hemmorhage, calcification, ulceration, and
Macrovascular complications
Coronary artery disease
Cerebrovascular disease
Peripheral vascular disease
Microvascular disease
Neuropathy
Nephropathy
Retinopathy
Mechanisms of Complications:
1. Endothelial Dysfunction: “ Endothelium which is the innermost
layer of the blood vessels and in fact the largest organ of the body is the
initial and common target of all cardiovascular risk factors. The functional
impairment of the vascular endothelium in response to injury occurs long
before the development of visible atherosclerosis.
The endothelial cell behaves as a receptor-effective structure
which senses different physical or chemical stimuli that occur inside the
vessel and, therefore, modifies the vessel shape or releases the necessary
products to counteract the effect of the stimulus and maintain homeostasis.
molecules including the vasodilators (nitric oxide [NO] and prostacyclin)
and vasoconstrictors (endothelin-1 and angiotensin II) and nicely balancing
their effects. When this delicate balance is lost, the conditions are given for
the endothelium to be invaded by lipids and leucocytes (monocytes and
T-lymphocytes). The inflammatory response is incited and fatty streaks
appear – the first step in the formation of the atheromatous plaque which
may later rupture and set the conditions for thrombogenesis and vascular
occlusion. Therefore, endothelial dysfunction which is universal in
diabetes is the starter in the process of atherosclerosis and many other
factors are the chasers.
As a result of this, vascular NO synthesis and stability are reduced
and there is an impairment of endothelium-dependent NO-mediated
vasodilatation in diabetes. In the presence of endothelial dysfunction the
powerful vasoconstrictors like endothelin-I and angiotensin-II replace the
vasodilators, NO and prostacyclin.(14)”
2. Oxidative Stress : “Oxidative products are produced as a consequence
of normal aerobic metabolism. These molecules are highly reactive with
other biological molecules and are referred to as reactive oxygen species
balanced by an efficient system of antioxidants, molecules that are capable
of neutralising them and, thereby, preventing oxidant damage. In
pathological states, ROS may be present in relative excess. This shift of
balance in favour of oxidation termed ‘oxidative stress’ may have
detrimental effects on cellular and tissue function and the cardiovascular
risk factors generate oxidative stress. Both type 1 and type 2 diabetic
patients are under enhanced oxidative stress. Hyperglycaemia causes
nonenzymatic glycosylation of proteins and phospholipids, thus increasing
the intracellular oxidative stress. Therefore, advanced glycosylation end
products (AGEs) formed later in this process are stable and virtually
irreversible and generate ROS with consequent increased vessel oxidative
damage and atherogenesis”.
3. Activation: “ Activation of polyol pathway and diacylglycerol
(DAG), protein kinase C (PKC) cascade are the other consequences of
persistent hyperglycaemia (uncontrolled diabetes). Excess of intracellular
glucose is metabolised by sorbitol pathway; and there is also rise in DAG,
PKC levels intracellularly consequent to persistent hyperglycaemia. This
4. Other Factors: “ There are many cardiovascular risk factors in
diabetes and insulin resistance (IR). These are metabolic and lipid-related
factors, coagulation and inflammatory factors and vascularrelated factors
(Table 1). Some of them are primarily related to diabetes while others may
be found in diabetic as well as non-diabetic individuals. Type 2 diabetes
and IR typically occur in the setting of metabolic syndrome which also
includes visceral (abdominal) obesity, hypertension, dyslipidaemia, and
increased coagulability all of which lead to atherosclerosis (Figure 1). Even
in this setting of multiple risk factors, type 2 diabetes acts as an
independent risk factor for the development of ischaemic heart disease
(IHD), stroke, and death. Among people with type 2 diabetes women may
be at a higher risk for CHD than men. The prevalence of microvascular
disease in itself is also a predictor of CHD”.(14). Important steps in the
initiation and growth of atherosclerotic plaque are:
1. Endothelial dysfunction and injury
2. Sub-endothelial monocyte/macrophage accumulation
3. Lipoprotein infiltration
5. Influence of T lymphocytes and other inflammatory cells and
protein lipid accumulation in foam cells finally leading to plaque formation
and adhesion thrombosis.(14)
Hyperglycemia is the most important single cause of chronic
complications in diabetes which has been proved by the diabetes control
and complications trial (DCCT).Patients with insulin -dependent diabetes
whose intensive insulin therapy resulted in HbA1c values of 2% lower than
those receiving conventional insulin therapy, had a 76% lower incidence
UKPDS study is the best evidence to prove that intensive drug
treatment to lower blood glucose concentration is effective in reducing the
risk of long term microvacular complications. This study also proved that
strict control of blood pressure and lipids is also important in reducing the
risk of diabetic complications.
These alterations remain reversible if good control of hyperglycemia
is achieved. However if persistence of hyperglycemia and in the presence
of secondary factors such as hypertension, hyperlipedemia, smoking,
alcohol, environmental toxins, the functional alterations progress to early
structural changes. once these set in, further progression to irreversible
damage and end stage disease is apparently determined by yet unknown
factors independent of hyperglycemia could be genetic.
VASCULAR CHANGES IN DIABETES:
To ensure adequate nutrition to all tissues, blood vessels must
possess inherent mechanisms to regulate the flow and contractility,
permeability, coagulation and regeneration following injury, depending on
the needs of each tissue.
Diabetes mellitus affects all these processes leading to damage of
target tissues.(16)
Reduced contractility - altered blood flow
Thickened basement membrane - altered permeability
Factor Vii , vWF, PGI - coagulability
Cellular proliferation - neovascularisation
MACROVASCULAR DISEASE IN DIABETES :
Unlike the microvascular disease which gets clicked with the onset
of diabetes, the macrovascular disease antedates the development of
diabetes by several years. Around 75% to 80% of all diabetic patients will
die, many prematurely of cardiovascular (macrovascular) disease (CVD),
particularly coronary heart disease (CHD). Diabetic foot problems
(gangrene, large non-healing infected ulcers) are the commonest cause of
non-traumatic lower limb amputation. In one Indian study done at Chennai,
the prevalence of CHD was 21.4% among diabetic patients, 14.9% among
IGT subjects and 11% among non-diabetic patients. The of PAD in the
There is a close relationship existing between pre-diabetes, diabetes
and macrovascular (cardiovascular) disease throughout life; and the
substantial body of evidence supports the concept that increased risk of
morbidity and mortality due to CVD is associated with abnormalities in
glucose metabolism across the entire continum of glucose tolerance
ranging from normal to clinical diabetes.(14,28)
AETIOPATHOGENESIS:
The central mechanism in macrovascular disease is the process of
atherosclerosis which leads to narrowing of the arteries throughout the
body. Atherosclerosis is a progressive disease of the arterial wall involving
the components of inflammation, vascular lipid deposition and
remodelling, fibrosis, and thrombosis. Diabetes is a major independent risk
factor for CHD resulting from accelerated atherosclerosis of the coronary
arteries occurring at a much earlier age and advancing more rapidly to
clinical cardiovascular events in persons with diabetes than in those
without it.
Multivariate analyses of a number of large prospective studies
with 2- to 5-fold increase in CHD and premature cardiovascular-related
deaths in both type 1 and type 2 diabetes. Atherosclerosis in diabetes is
typically more diffuse, heterogeneous and extensive, occurring earlier and
faster and more often associated with high-risk, unstable and vulnerable
plaque with a large lipid core covered by thin fibrous cap which can easily
rupture and result in acute coronary syndrome and death than in those
without the diabetes. Diabetes, therefore, has definite accelerating impact
on the pathogenesis of atherosclerosis which, in fact, is not qualitatively
different from that occurring in non-diabetic individuals.
Cardiovascular Disease :
Cardiovascular syndromes in patients with diabetes present in
similar ways to those in non-diabetic population, although many patients
are younger, outcomes are worse, and ischaemic events are more likely to
be ‘painless’ (or rather silent) due to associated cardiac autonomic
neuropathy. A cluster of cardiovascular risk factors clinically relevant are
associated with diabetes, pre-diabetes, and IR and have to be looked into
while evaluating the diabetic patients.
These are: 1. Abdominal obesity with increased waist circumference
(> 90 cm in men and >80 cm in women) acanthosis nigricans, ‘hump’-like
fatty bulge nape of the neck
2. Hypertension (>140/90 mmHg)
3. Dyslipidaemia Increased triglycerides Decreased HDL cholesterol Small
dense atherogenic LDL particles Post-prandial lipaemia
4. Microalbuminuria
The clinical syndromes of myocardial ischaemia due to occlusive
CAD are:
1. Angina
Angina may be relatively painless and can present atypically in
long-standing type 2 diabetic patients, particularly the older ones with
autonomic (sensory) neuropathy. Diabetic patients are more likely to
remain asymptomatic while showing the ECG changes during exercise
testing or ambulatory (Holter) ECG monitoring. Such diabetic patients of
angina show reversible ischaemia on myocardial isotope perfusion
scanning in the absence of obvious angina. Silent myocardial ischaemia
carries a more ominous prognosis in diabetic patients than in the
non-diabetic people.
2. Acute coronary syndromes :
Unstable angina, non-ST elevation MI, and ST elevation MI
represent a major cause of death in the diabetic population. These may also
be painless or present with other symptoms like acute dyspnoea (left
ventricular failure, LVF), a variety of cardiac arrhythmias often lethal,
cardiogenic shock, or sudden death. Malaise, nausea and vomiting, profuse
normal circadian pattern of autonomic cardiovascular regulation, most
acute ischaemic events occur during the evening and at night among
diabetic patients.
Diabetic patients who suffer an MI have a higher mortality than
non-diabetic patients both in acute phase and on long-term follow-up. Infarct
expansion or/and extension and recurrence of infarction, acute LVF, and
congestive heart failure (CHF) all occur more commonly in the diabetic
population than the non-diabetic population. Serial determinations of
CK-MB and quantitative estimation of troponins are more useful in assessing
the infarct size and recurrence. All modes of echocardiography (2-D,
Doppler and myocardial contrast echo) are extremely useful in assessing
the LV size and function, myocardial viability, presence of any thrombus
in the LV or its walls and other mechanical complications like mitral
regurgitation, ventricular septal rupture or ventricular aneurysm. A major
cause of adverse outcomes is the five-fold higher frequency of cardiac
failure.
3. Heart failure:
Heart failure (HF) is 2 to 5 times more common in diabetic
absence of obvious CAD. Aetiology of HF in diabetes is complex; factors
include the systolic and diastolic performance of the LV affected by
diabetic cardiomyopathy (diabetic heart muscle disease), the superimposed
deleterious consequences of hypertension and further loss of functioning
myocardium following acute coronary artery occlusion. The contractility
of the non-infarcted myocardium in diabetes is much reduced which adds
further to HF.
4. Cardiac dysrhythmias:
They are related to ischaemia, left ventricular hypertrophy or CAN
and frequently occur in diabetic subjects following MI and may result in
sudden death. Decreased heart rate variability and subtle changes in CV
reflexes due to CAN in the diabetic patients result in lethal cardiac
dysrhythmias.
5. Diagnosis of ischaemic heart disease:
ECG, stress testing either treadmill (TMT) or pharmacologic
(Dobutamine), ambulatory ECG (Holter) monitoring, echocardiography
and ultimately coronary angiography should be done at appropriate times
revascularisation can be very beneficial in the diabetic patients with CAD.
(14,28)
Cerebrovascular Disease
Transient ischaemic attack and stroke are more frequent among
diabetic patients, than in the non-diabetic patients particularly those who
had acute coronary ischaemic event earlier. Lacunar infarcts, large infarcts
and multi-infarct disease occur more often among the diabetic population
than in the non-diabetic population. Haemorrhagic strokes occur less
commonly. The prognosis of stroke is also worse in the diabetic patients.
Hypertension often coexists and worsens the situation.
Coma, convulsions and dense hemiplegias are often present. Carotid
artery Doppler and B-Mode ultrasound imaging to measure the carotid
intima-media thickness (IMT, abnormal if more than 1.1 mm) is an
extremely simple and yet accurate indication of the diffuse atherosclerosis
occurring in coronary and other arteries. The obstructive athero-plaques
may be found in the carotid arteries by ultrasound and colour Doppler. CT
or MRI brain and MR angiography of the brain are extremely useful in
Stroke-related dementia and recurrence of stroke are more frequent
in diabetic patients. Cerebrovascular mortality rate is higher in both type 1
Peripheral Arterial Disease
PAD is 2 to 3 times more frequent in diabetic males and 5 to 6 times
more common in diabetic females. Diabetes is the commonest cause of
non-traumatic limb amputation. Smoking, hypertension and dyslipidaemia
and associated peripheral neuropathy contribute to the increased
prevalence of PAD in diabetic patients. Clinical presentation of ischaemic
limb disease extends over a wide spectrum of intermittent claudication,
critical limb ischaemia, and gangrene resulting from total peripheral artery
occlusion. Limb pain either at rest or on walking is suggestive of occlusive
PAD.
Acute limb ischaemia characterised by pain, paraesthesia, pallor,
pulselessness and perishingly cold limb may also occasionally occur.
Chronic lower limb ischaemia involving popliteal and tibial arteries results
from atherosclerosis in the diabetic individuals. The combination of
ischaemic PAD, peripheral neuropathy, injury and infection results in
CORONARY ARTERY DISEASE IN DIABETES:
Coronary Artery Disease is about twice as frequent in diabetic men
and four times as frequent in diabetic women after menopause compared
to nondiabetics. In fact one third of all deaths occurring in diabetics after
forty years of age have been attributed to CAD. Coronary atherosclerosis
in diabetic women almost equals that of diabetic men. In contrast disease
has distinct male predominance compared to women among nondiabetic
subjects. It has been observed that the immunity from cardiovascular
mortality in the premenopausal non diabetic women is seldom encountered
in the female diabetic subjects.
Coronary artery disease in diabetes is characterised by greater
prevalence of triple vessel disease. The distribution of fatty streaks, fibous
plaques and coronary stenosis are relatively more. A correlation between
the extent and severity of coronary atherosclerosis, with the duration of
diabetes has not been established. The prevalance of diffuse coronary
atherosclerosis ,as evidence by postmortem arteriography and histological
analysis is more often seen in diabetes subjects.
Clinically CAD in diabetic subjects is associated with prematurity
and asymptomatic heart disease. In fact 75% of subjects sustaining acute
intolerance.
An abnormal resting ECG has been documented in about 40%
normotensive, ambulant diabetic subjects. Silent myocardial infarction is
an entity with a greater prevalence in diabetic subjects.(16)
CAROTID INTIMA MEDIA THICKNESS
Carotid intima-media thickness (CIMT) is a well-described
surrogate marker for macrovascular disease, a thickened CIMT correlates
with the presence of macrovascular diseses by cross-sectional analysis.
Several prospective studies have shown an association between increased
CIMT and the incidence of macrovascular disease in the general population
with or without prior cardiovascular disease. CIMT is significantly higher
in diabetic patients than in nondiabetic subjects, and an increased CIMT is
associated with angiography-evaluated coronary artery disease and
predicts future events of macrovascular disease in type 2 diabetic subjects.
CIMT measurements are used in clinical trials to evaluate the
efficacy of interventions. In these trials,CIMT is used as an surrogate for
macrovascular diseases morbidity and mortality on the premise that
changes in CIMT reflect changes in risk of these disease. CIMT usage is
an advantage in a longitudinal trial as a surrogate end point to assess
follow-up, and in sample size and it could contribute to investigating the
cause-and-effect relationship in atherosclerosis process.(17,18)
“STUDY OF CAROTID ARTERY INTIMA-MEDIA THICKNESS BY DOPPLER ULTRASOUND-AS AN INDICATION OF
ATHEROSCLEROSIS”
“High resolution B-mode ultrasound is an non-invasive technique
widely used to assess atherosclerosis in the superficial arteries. It is used to
assess the accurate measurement of the distance between blood -intima and
media-adventitia interfaces of the carotid wall, which is defined as carotid
intima-media thickness (IMT)”.
Several authors have suggested the carotid IMT as a marker of
atherosclerosis in vascular beds.
Increased carotid IMT has been associated with a number of
atherosclerosis risk factors, with the prevalence and extent of coronary
artery disease (CAD) and with the incidence of macrovascular disease. In
view of these relationships, carotid IMT has been proposed as a surrogate
Figure 2 : Sonographic Evaluation of Carotid Arteries
UltraSonography of the Carotid arteries:
B-mode ultrasound offers advantages over angiography as it is
non-invasive ,decreased risk and less expensive. By multiple serial
measurements it is also used to assess progression or regression of
atherosclerosis . Because of all these advantages many investigators since
mid1980s have used Carotid intima media thickness by B-mode
ultrasonography as an important tool to assess atherosclerosis in various
Atherosclerosis is one of the inevitable accompaniment of ageing
and its rate of development depends on various factors. Risk factors for
accelerated atherosclerosis are hypertension, smoking, dyslipidemia and
hyperglycemia. So it is necessary to identify subjects who are at early risk
of developing accelerated atherosclerosis as several practical life style and
pharmacological interventions for attenuating atherosclerosis development
are available.
Measurement of extra cranial carotid intima-media thickness by
Bmode ultrasound imaging correlated with histopathological examination.
The intima media thickness is at present the best-studied ultrasonographic
marker for assesing atherosclerosis. A thickening of intima-media complex
not only corresponds to local alterations but also reflects generalized
atheroscelerosis.
The normal intimal - medial thickness of common carotid artery as
evaluated by B mode ultrasound imaging was 0.80 mm approximately.
some authors have approximated the CIMT with the formula as (0.009×
Age+ 0.116)
.23Measurement of the intima-media thickness, which increases in
clinical trials assessing whether lipid lowering medications might slow or
reverse plaque formation.21
Atherosclerosis within the carotid artery occurs most frequently in
the common carotid artery bifurcation and proximal internal carotid artery.
Also, the carotid siphon (portion within the cavernous sinus) is also
vulnerable to atherosclerosis. Old age, male gender, smoking, diabetes,
hypertension and hypercholesterolemia are risk factors for carotid artery
[image:57.595.184.405.351.638.2]disease.
Figure 3 :“Carotid arteries are examined bilaterally in the areas of common carotid artery (1cm proximal to the dilatation of the carotid bulb), the carotid
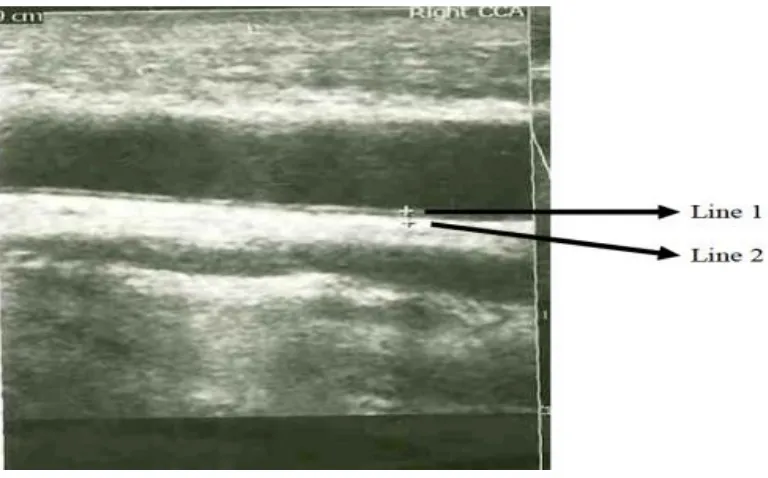
Figure 4: Showing USG guided measurement of IMT in Common carotid artery
Ultrasonographic scanning of the carotid arteries is performed by
using an high resolution B mode ultrasound colour Doppler imaging and
an electrical linear transducer is used.(23,24)
“Scanning of common carotid or internal carotid arteries in
neck is performed bilaterally according to evading edge of second
echogenic line. The first line represent the lumen intimal interface and the
second line represents the collagen containing upper tunic adventitia. At
each longitudinal projections three determinations of IMT are measured at
below from the site of greatest thickness. The three values are then
averaged”.
APPLICATION OF CAROTID ARTERY INTIMA MEDIA THICKNESS:
Howard and colleagues, By Using B-mode ultrasound imaging
examined the incidence of carotid atherosclerosis in the general population.
The median carotid wall thickness ranged from 0.05 – 0.10 cm at all ages,
with more than 5% of the cohort having wall thickness more than 0.20 cm.
Cross-sectional analysis provide information that age-related increases in
wall thickness average approximately 0.015 mm per year in females and
0.018 mm per year in males at the carotid bifurcation, 0.010 per year in
females and 0.014 per year in males at the internal carotid artery, and 0.010
mm per year in both males and females at the common carotid artery.
The association of CIMT with conventional risk factors of
atherosclerosis, include not only hyperglycaemia , fasting insulin and
diabetes, but also body mass index, waist to hip circumference ratio, and
physical inactivity (30). Abnormal glucose metabolism, abdominal
adiposity and physical inactivity are associated positively with carotid
the atherosclerosis risk in communities (ARIC) study showed that carotid
wall thickness is strongly associated with smoking , hypertension,
atherogenesic lipids and tobacco ,(12), suggesting that the atherosclerosis
is reflected in the IMT measurements.
The prognostic value of carotid Intima-Media Thickness has been
prospectively evaluated and in many studies, increased IMT has been
shown to be associated with increased macrovascular complications
(31-35). In one study involving more than 4400 subjects from the
Cardiovascular Health Study with age above 65 years and no known
cardiovascular disease, IMT was a predictor of new cerebrovascular
disease or acute coronary syndromes, even adjusting for traditional
AIM OF THE STUDY:
1. “To compare the carotid intima media thickness in case group and
in control population”.
2. “To find the association of increased carotid intima media thickness
and CAHD/CVA/PVD”.
3. “To assess the usage of carotid intima media thickness as a early
Justification for study:
“Atherosclerosis typically occurs over a period of many years,
usually many decades. After a generally prolonged silent period,
atherosclerosis may become clinically manifest. Evaluation of intimal
medial thickness is considered as surrogate marker of Atherosclerosis. B
mode ultrasound was found to be a suitable non-invasive method to
visualize the arterial walls and to monitor the early stages of the
METHODS AND MATERIALS
Study Design: Case control Study (type 2 dibetes mellitus patients with macrovascular complications as cases and without
macrovascularcomplications as control group)
Study population: Type 2 DM patients presenting with macrovascular complications admitted in the medical ward will be
included in the study. An equal number of age, sex, BMI and comorbid
conditions[ Systemic Hypertension] matched persons not having
macrovascularcomplications attending OPD and in ward will be included
in the study as control group
INCLUSION CRITERIA
1. Patients aged 35 TO 75years with type 2 diabetes mellitus
2. CAHD/CVD/PVD Diagnosed through medical history, clinical
examination and appropriate investigation including
Electrocardiogram, EchoCardiograms, and Computer
EXCLUSION CRITERIA:
Patient with type 1 diabetes mellitus
Patient with hemodynamic instability – bp<90/60 mm hg
Patients with renal disease and liver disease both acute and chronic
and connective tissue disorders.
Sample Size and sampling method: Type 2 Diabetes mellitus patients 50 with macrovascular complications as CASES And 50 without
macrovascular complications as CONTROLS
So, total of 50 cases and 50 controls was be included in the study.
LIMITATION OF STUDY:
Due to limited source and practical constraints this study is being
carried out with a small sample size. Thus the appropriate representation
of the population and better outcomes could be attained by increasing
OBSERVATION AND ANALYSIS
AGE DISTRIBUTION OF CASE AND CONTROL GROUP:
Age Cases Controls
Upto 50 yrs 10 11
51 - 60 yrs 13 12
Above 60 yrs 27 27
Agerange * CC Crosstabulation
CC
Total Cases Controls
Age range
Upto 50 yrs
Count 10 11 21
% within CC
20.0% 22.4% 21.2%
51 - 60 yrs
Count 13 12 25
% within CC
26.0% 24.5% 25.3%
Above 60 yrs
Count 27 27 54
% within CC
54.0% 54.0% 54.0%
Total Count 50 50 100
% within CC
100.0% 100.0% 100.0%
So, Equal number of cases and controls are selected in different
SEX DISTRIBUTION OF CASE AND CONTROL GROUP:
Frequency Percent
Female 27 27.0
Male 73 73.0
Total 100 100.0
Sex = F
Descriptive Statisticsa
N Minimum Maximum Mean Std. Deviation
Age 27 45 70 61.74 8.202
N 27
Sex = M
Descriptive Statisticsa
N Minimum Maximum Mean Std. Deviation
Age 73 45 76 60.07 8.571
N 73
CC
Total Cases Controls
Sex F Count 13 14 27
% within CC
26.0% 28.0% 27.0%
M Count 37 36 73
% within CC
74.0% 72.0% 73.0%
Total Count 50 50 100
% within CC
100.0% 100.0% 100.0%
Chi-Square Tests
Chi square value = .051
p value = 0.822
Cases Controls
Female 13 14
Male 37 36
SMOKING DISTRIBUTION IN CASE AND CONTROL GROUP
Cases Controls
Yes 31 33
No 19 17
MACROVASCULAR COMPLICATION DISTRIBUTION IN CASE GROUP:
Frequency Percent
Valid 50 50.0
ACS 25 25.0
CVA 20 20.0
PVD 5 5.0
HYPERTENSION IN YEARS IN CASE AND CONTROL GROUP:
DURATION OF DIABETES IN CASE AND CONTROL GROUP:
p = 0.014 so, p is stastically significant
As, Duration of diabetes is significantly more in case group than
BODY MASS INDEX DISTRIBUTION IN CASE AND CONTROL GROUP:
p = 0. 188 (p > 0.05 ).
Body mass index is more in case than control group but not
FASTING BLOOD SUGAR IN CASE AND CONTROL GROUP:
P = 0.000 (< 0.01)
Fasting blood sugar is statistically significant ( p <0.01) in case than
POST PRANDIAL BLOOD SUGAR IN CASE AND CONTROL GROUP:
P = 0.000
Post prandial blood sugar is statistically significant (p< 0.01) in case
TOTAL CHOLESTEROL IN CASE AND CONTROL GROUP:
P = 0.000
Total cholesterol is statistically significant (p <0.01) in case than
control group, so total cholesterol is more in case group than control group
SERUM TRIGLYCERIDE LEVEL IN CASE AND CONTROL GROUP:
P = 0.000
Serum triglyceride is statistically significant ( p<0.01) incase group
SERUM LDL IN CASE AND CONTROL GROUP:
P = 0.03
Serum LDL is statistically significant (p< 0.05) in case than control
SERUM HDL IN CASE AND CONTROL GROUP:
p = 0.000
Serum HDL is statistically significant (p <0.01). So, serum HDL is