The authors are solely responsible for the content of this technical presentation. The technical presentation does not necessarily reflect the official position of the American Society of Agricultural and Biological Engineers (ASABE), and its printing and distribution does not constitute an endorsement of views which may be expressed. Technical presentations are not subject to the formal peer review process by ASABE editorial committees; therefore, they are not to be presented as refereed publications. Citation of this work should state that it is from an ASABE meeting paper. EXAMPLE: Author's Last Name, Initials. 2008. Title of Presentation. ASABE Paper No. 08----. St. Joseph, Mich.: ASABE. For information about securing permission to reprint or reproduce a technical presentation, please contact ASABE at
An ASABE Meeting Presentation
Paper Number: 083879
The Effects of Tyre Size on Soil Deformation and Soil Bulk
Density Changes
D.L. Antille
School of Applied Sciences, Natural Resources Department, Cranfield University, Building 37, Cranfield, Bedfordshire, MK43 0AL, UK. Email: [email protected]
D. Ansorge
Claas Selbstfahrende Erntemaschinen GmbH, Münsterstraße 33, 33428 Harsewinkel, Germany. Email: [email protected]
M.L. Dresser
Landcare Research, Manaaki Whenua, University of Waikato, Hamilton, PB 3127, New Zealand. Email: [email protected]
R.J. Godwin
School of Applied Sciences, National Soil Resources Institute, Cranfield University, Silsoe, Bedfordshire, MK45 4DT, UK. Email: [email protected]
Written for presentation at the
2008 ASABE Annual International Meeting
Sponsored by ASABE
Rhode Island Convention Center
Providence, Rhode Island
June 29 – July 2, 2008
Abstract. The selection of appropriate tyre size and inflation pressure for a particular load and soil condition are crucial to minimising soil compaction and ensuring soil sustainability. The purpose of this study was to investigate the changes in soil bulk density from soil deformation data, produced by a selected range of combine-harvester tyres, inflated to the recommended inflation pressures, and at high axle load (10.5 tonnes) to provide a valuable indicator for tyre selection. Results showed that the initial soil strength was the main factor influencing soil deformation and soil bulk density changes beneath the tyres. In addition, increased tyre size and low inflation pressure reduced both soil deformation and the resultant increase in soil bulk density. The increases in soil bulk density after one passage of the tyres over the soil were approximately 25% for the low bulk density soil (1.20 g cm-3) and between 2.3% and 5% for the high bulk density soil (1.60 g cm-3). The advantage of increasing tyre size and lowering inflation pressure was also reflected in the results obtained from penetrometer resistance: at the centre of the wheeling, the tyre with the highest inflation pressure (2.5 bar) gave a significantly higher increase in penetration resistance compared with the tyres with lower inflation pressures (2.2 bar and 1.9 bar). Linear relationships between drop-cone penetration and maximum rut depth were established; these data were subsequently related to those obtained from penetration resistance and initial soil bulk density; therefore, the increase in soil bulk density induced after driving a tyre over the soil can be determined for various tyre configurations and initial soil conditions.
Introduction
Efficient mechanisation in agriculture is a major factor underlying high productivity: larger machinery is often related with timeliness, higher work rates, and lower labour requirements. The drawback of it is that larger machinery usually means increased machinery weight which increases the danger of soil compaction (Raper, 2005). Soil compaction affects the physical, chemical, and biological properties of soils and is one of the main causes of agricultural soil degradation (Hakansson and Voorhees, 1998). Its alleviation is usually costly in terms of the energy and power that the process of soil loosening requires. Generally, an increase in tyre size is accompanied by a decrease in tyre inflation pressure to support a given axle load. This also provides improved tractive performance and reduced soil deformation since the average soil contact pressure under the tyre is approximately equal to the inflation pressure plus carcass stiffness (Plackett et al., 1987, and Misiewicz et al., 2008). Soil compression behaviour is also
related to the initial soil bulk density which is one of the most used measures of soil compaction. Low bulk density soils can suffer from low strength and hence greater deformation and compaction, compared with those with high bulk density.
The aim of this work was to determine the change in soil bulk density from soil deformation data for a selected range of tyres, inflated to the recommended inflation pressures, and at fixed axle load (10.5 tonnes) by extending the graphical representation of the data reported in earlier investigations (Stranks, 2006, Ansorge and Godwin, 2007 & 2008). This would provide a valuable indicator for tyre selection.
Methodology
The investigation was conducted in a soil bin with uniform soil conditions at the Soil Dynamics Laboratory at Cranfield University at Silsoe (UK). Soil bin characteristics were described in detail by Earl and Alexandrou (2001). It is 22 m long, 1.7 m wide and 1 m deep. The soil used was a sandy loam Cottenham series (King, 1969) with 66% sand, 17% silt, and 17% clay, which
was maintained at approximately 10% (g g-1) moisture content. Two different soil bulk densities
were used: low (1.20 g cm-3) and high (1.60 g cm-3). Three different combine-harvester tyres
manufactured by Continental® were used during this study (Table 1). The tyres were operated at a speed of 1 m s-1 in a single wheel test rig (Ansorge and Godwin, 2007 & 2008) at the
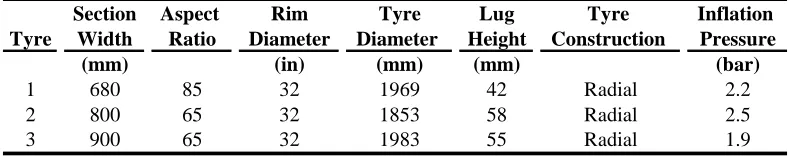
[image:2.612.122.517.601.679.2]recommended inflation pressure according to the manufacturer’s specifications for the working load (10.5 tonnes). The tyres will be referred to in the form of section width (mm)/load (t)/inflation pressure (bar); e.g. 900/10.5 t/2.2 b.
Table 1: Tyre specification
Section Aspect Rim Tyre Lug Tyre Inflation
Tyre Width Ratio Diameter Diameter Height Construction Pressure
(mm) (in) (mm) (mm) (bar)
1 680 85 32 1969 42 Radial 2.2
2 800 65 32 1853 58 Radial 2.5
A technique developed by Ansorge and Godwin (2007) to determine soil deformation (strain) and soil bulk density changes based upon the principles outlined by Trein (1995) was used in this study. This technique consisted of using talcum powder and placing the soil in the soil bin in layers. During the preparation of the soil bin, talcum stripes were placed every 100 mm of soil (i.e. between soil layers) after rolling and wetting the soil to allow the talcum powder to stick to the soil on top of the layer. A total of 7 layers with talcum powder were used throughout the soil profile; each soil layer had 14 talcum powder lines of 200 mm long and 6 mm wide across the width of the soil bin, each one separated vertically and horizontally by 100 mm. These talcum powder marks were put in three positions along the soil bin with the first one, on one end of the soil bin, being the control position where no wheel was driven over so as to use it as base for comparison. To be able to compare the tyres, the vertical displacement in each layer was calculated by subtracting the mean vertical coordinate (taken from the 4 central points) of the control from the final talcum powder position (after driving the tyre over the soil). This mean soil vertical displacement for any given depth was then plotted against depth to produce the diagram shown in Figure 1. Linear regression lines were subsequently fitted to this diagram; they indicate a constant increase in dry bulk density with depth whereby the reciprocal of the slope is equal to the percentage increase in dry bulk density as suggested by Ansorge and Godwin (2007 & 2008). This value can be used to compare different tyre configurations (Ansorge et al.,
2007). Following Stranks (2006), the increase in dry bulk density was plotted against the initial soil bulk density (i.e. before driving the tyres over the soil) for each one of the tyre configurations used in this study; thereby, extending the graphical relationships reported in previous investigations. Soil penetration resistance and drop cone penetration (Godwin et al., 1991) were
also measured. These data were subsequently linked to both the calculated increase in dry bulk density and the initial soil density to aid the estimation of the increase in soil bulk density after driving a tyre over the soil in these conditions. Similarly, drop cone penetration data were linked to measurements of rut dimensions (i.e. maximum depth) and the expected increase in dry bulk density. A statistical analysis was undertaken using GenStat Release 10.1 (2007) and involved analysis of variance (ANOVA) and least significant differences (LSD) to compare means. A 5% probability level was used (p < 0.05).
Results and discussion
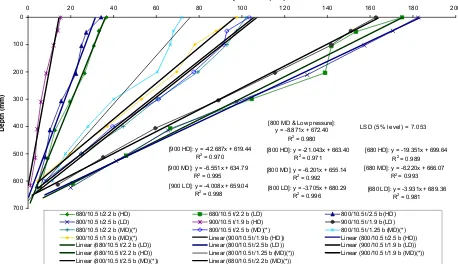
Figure 1 shows soil vertical displacement plotted against depth for the selected range of tyres and soil conditions used in this study. Results obtained by Ansorge and Godwin (2007 & 2008) for a medium bearing capacity soil (γ = 1.38 g cm-3) are also presented in Figure 1 to allow
LSD (5% level) = 7.053
[900 HD]: y = -42.687x + 619.44
R2
= 0.970
[800 HD]: y = -21.043x + 663.40
R2 = 0.971
[680 LD]: y = -3.931x + 689.36
R2 = 0.981
[800 LD]: y = -3.705x + 680.29
R2 = 0.996
[900 LD]: y = -4.008x + 659.04
R2 = 0.998
[680 HD]: y = -19.351x + 699.64
R2
= 0.989 [800 MD & Low pressure]:
y = -8.871x + 672.40
R2 = 0.980
[900 MD]: y = -6.551x + 634.79
R2
= 0.995 [800 MD]: y = -6.201x + 655.14R2 = 0.992
[680 MD]: y = -6.220x + 666.07
R2
= 0.993 0
100
200
300
400
500
600
700
0 20 40 60 80 100 120 140 160 180 200
Soil vertical Displacement (mm)
Depth (mm)
680/10.5 t/2.2 b (HD) 680/10.5 t/2.2 b (LD) 800/10.5 t/2.5 b (HD)
800/10.5 t/2.5 b (LD) 900/10.5 t/1.9 b (HD) 900/10.5 t/1.9 b (LD)
680/10.5 t/2.2 b (MD)(*) 800/10.5 t/2.5 b (MD)(*) 800/10.5 t/1.25 b (MD)(*)
900/10.5 t/1.9 b (MD)(*) Linear (900/10.5 t/1.9 b (HD)) Linear (800/10.5 t/2.5 b (HD))
Linear (680/10.5 t/2.2 b (LD)) Linear (800/10.5 t/2.5 b (LD)) Linear (900/10.5 t/1.9 b (LD))
Linear (680/10.5 t/2.2 b (HD)) Linear (800/10.5 t/1.25 b (MD)(*)) Linear (900/10.5 t/1.9 b (MD)(*))
[image:4.612.76.534.86.350.2]Linear (800/10.5 t/2.5 b (MD)(*)) Linear (680/10.5 t/2.2 b (MD)(*))
Figure 1: Mean soil vertical displacement vs. depth for the three different tyres and soil conditions used in this study (LD: low bulk density – γ = 1.20 g cm-3, MD: medium bulk density –
γ = 1.38 g cm-3, and HD: high bulk density – γ = 1.60 g cm-3). [Note: the tyres are referred to in
the form of section width (mm)/load (t)/inflation pressure (bar). Data for γ = 1.38 g cm-3 from
Ansorge and Godwin (2007 & 2008)].
Previous investigations by Ansorge and Godwin (2007 & 2008) had also demonstrated the influence of tyre inflation pressure on soil deformation finding that the same 800 mm section width tyre loaded to 10.5 t on a medium bearing capacity soil (γ = 1.38 g cm-3) and using half
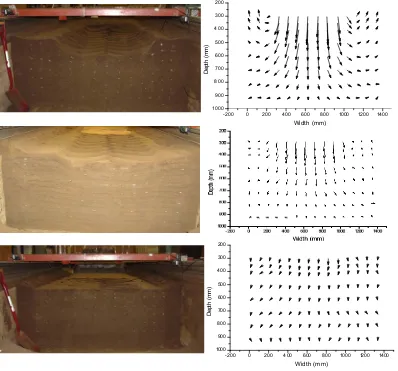
the recommended inflation pressure (1.25 bar) produced significantly less soil deformation (p < 0.0001), hence, compaction, than the same tyre inflated to 2.5 bar as shown in Figure 1. Vertical displacement diagrams (Figure 2) help to understand the response of the soil when it is subjected to stress. The length of the arrows indicates the magnitude of the displacement whereas the direction the arrows are pointing in indicates the direction of the displacement. Ageikin (1987) suggested that soil deformation by a wheel may be subdivided into three types: vertical and lateral displacement, and displacement in the direction of motion. Unfortunately, the method used in this work only allows for measurements in 2D. Further research by Ansorge and Godwin (2008) showed that the lateral movement of soil underneath self-propelled combine-harvester tyres on medium soil conditions (γ = 1.38 g cm-3) was limited to the first 150 mm from
the surface. More research into the lateral displacement of soil beneath self-propelled combine-harvester tyres is needed for the other two soil conditions used in this investigation.
- 200 0 200 400 600 800 1000 1200 1400 1000
900 800 700 600 500 400 300 200
Width (mm)
De
pt
h (
m
m
)
- 200 0 200 400 600 800 1000 1200 1400 1000
900 800 700 600 500 400 300 200
Width (m m)
D
ept
h (
m
m
[image:5.612.121.519.286.657.2])
Figure 2: Soil vertical displacement diagrams after one passage of the 900/10.5 t/1.9 b. [Top: low bulk density soil (γ = 1.20 g cm-3); middle: medium bulk density soil (γ = 1.38 g cm-3);
On the low bearing capacity soil, the lateral soil displacement at depth may be caused by the depth of the soil bin which might have impeded further vertical displacement of soil near the floor of the tank. The facility to use a deeper and wider soil bin is now available at Cranfield University at Silsoe (Godwin et al., 2006). On the medium bearing capacity soil, however, the
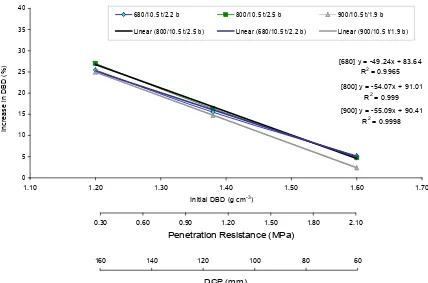
arrows at 920 mm depth pointing mostly to the right are due to the position of the talcum powder board not being accurately placed in the centre of the soil bin. The interaction between tyres and soil displacement in the different layers below the soil surface showed that there were significant differences (p < 0.001) for the different tyres. This is mainly because the 900/10.5 t/1.9 b consistently showed significant differences with the other two tyres on both soil conditions. In addition, on the softer soil, the 800/10.5 t/2.5 b produced the greatest displacement in the uppermost layers (0 – 400 mm) and particularly between 0 – 100 mm deep. Below 400 mm, the regression lines for the 680/10.5t/2.2 b and the 800/10.5 t/2.5 b converged; therefore, producing the same effect at depth. On the harder soil, no differences were recorded for these two tyres; this is also shown on the similarity of slope of the regression lines. The graphical relationship between the initial soil bulk density and its percentage increase produced after driving a tyre over the soil reported by Stranks (2006) was extended to a larger number of tyre sizes and loads as shown in Figure 3.
[800] y = -54.07x + 91.01 R2 = 0.999 [680] y = -49.24x + 83.64
R2 = 0.9965
[900] y = -55.09x + 90.41 R2 = 0.9998
0 5 10 15 20 25 30 35 40
1.10 1.20 1.30 1.40 1.50 1.60 1.70
Initial DBD (g cm-3)
Increase i
n
D
B
D (
%
)
680/10.5 t/2.2 b 800/10.5 t/2.5 b 900/10.5 t/1.9 b
Linear (800/10.5 t/2.5 b) Linear (680/10.5 t/2.2 b) Linear (900/10.5 t/1.9 b)
0.30 0.60 0.90 1.20 1.50 1.80 2.10
60 80
100 120
140 160
DCP (mm)
[image:6.612.89.517.336.619.2]Penetration Resistance (MPa)
Figure 3: Percentage increase in dry bulk density (DBD) as a function of initial soil bulk density, penetration resistance, and drop cone penetration (DCP) for various tyres configurations. [Data
As shown in Figure 3, regardless of the tyre, the increase in soil bulk density decreases progressively as the initial soil bulk density increases. The 900 section width tyre appears to be marginally better compared with the 680 mm and the 800 mm section tyres, especially, when the initial soil bulk density is higher than 1.30 g cm-3. The R2 values encountered clearly reflect
linear relationships for all the tyres configurations. When comparing the 680/10.5 t/2.2 b and the 800/10.5 t/2.5 b, both tyres showed a similar performance in terms of soil density changes over the range of initial soil conditions. Although the 680/10.5 t/2.2 b has a smaller section width than the 800/10.5 t/2.5 b, the contact patch areas remain similar for both tyres, hence soil deformation is also similar. The smaller section width of the former tyre is compensated by a larger section height and lower inflation pressure than the 800/10.5 t/2.5 b.
Interestingly, and according to the work done by Stranks (2006), smaller tyres (500/60-22.5; 700/50-26.4; and 800/40-26.4) loaded to 4.5 t were shown to have an exponential increase in soil density change as the soil becomes softer whereas larger tyres (as those used in this investigation) loaded to 10.5 t appear to be linear with decreasing soil density. In addition, as the tyre inflation pressure decreases, the percentage increase in dry bulk density tends to decrease significantly. This is more obvious on the medium and low bearing capacity soil conditions.
Overall, the mean increases in soil bulk density were 25.7% for the low density soil and between 2.3% and 5% for the high density soil. Ansorge and Godwin (2007) found a mean increase in soil bulk density of 17.5% using the same tyre configurations but on a medium bearing capacity soil (γ = 1.38 g cm-3).
The results shown in Figures 1 and 3 highlight the influence that soil strength (i.e. initial soil bulk density) can have upon soil deformation, and ultimately, soil compaction. Therefore, assessing soil strength becomes particularly important prior to undertaking field operations; this would enable both the prediction of potential damage to the soil and the selection of an adequate running gear. Equally, knowing the strength of the soil at any particular time would help to adapt the machinery (e.g. lowering the tyre inflation pressure) so as to minimise soil compaction. Assessment of soil strength can be done by means of a drop cone penetrometer (Godwin et al., 1991).
0 5 10 15 20 25 30
20 60 100 140 180 220
Rut Depth (mm)
Increase D
B
D
(
%
)
0
54 75 96 117 138 159
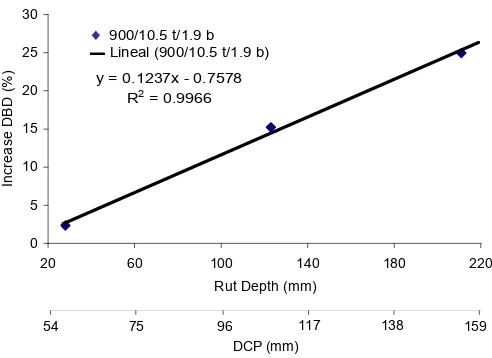
DCP (mm) y = 0.1237x - 0.7578
R2 = 0.9966 900/1.9 b/10.5 t
[image:8.612.197.443.75.254.2]♦ 900/10.5 t/1.9 b ▬ Lineal (900/10.5 t/1.9 b)
Figure 4: Relationship between drop cone penetration (DCP), maximum rut depth, and expected increase in soil bulk density (DBD) when the 900/10.5 t/1.9 b tyre is driven over the
soil. [Maximum rut depth was measured at the centre of the wheeling].
0
100
200
300
400
500
600
700
800
0.00 0.50 1.00 1.50 2.00 2.50 3.00
D
e
pt
h (mm)
900/10.5 t/1.9 b 800/10.5 t/2.5 b 680/10.5 t/2.2 b Mean Control
LSD at 95% confidence level = 0.17113 0
100
200
300
400
500
600
700
800
0.00 0.50 1.00 1.50 2.00 2.50 3.00
D
e
pt
h (
m
m
)
900/1.9 b/10.5 t (AR) 900/1.9 b/10.5 t (BR) 800/2.5 b/10.5 t (AR) 800/2.5 b/10.5 t (BR) 680/2.2 b/10.5 t (AR) 680/2.2 b/10.5 t (BR) 0
100
200
300
400
500
600
700
800
0.00 0.50 1.00 1.50 2.00 2.50 3.00
Penetration resistance (MPa)
De
p
th
(
m
m
)
900/1.9 b/10.5 t (AR) 900/1.9 b/10.5 t (BR)
[image:9.612.162.478.78.557.2]800/2.5 b/10.5 t (AR) 800/2.5 b/10.5 t (BR) 680/2.2 b/10.5 t (AR) 680/2.2 b/10.5 t (BR)
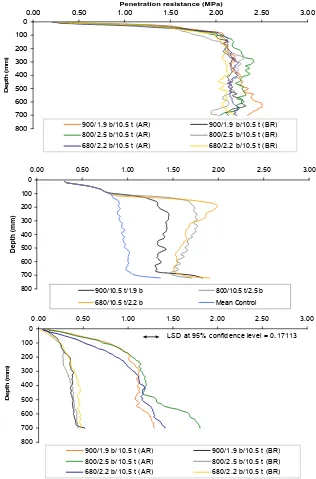
Figure 5: Soil penetration resistance before (BR) and after (AR) running the tyres over the soil. [Top: high bulk density soil (γ = 1.60 g cm-3); middle: medium bulk density soil (γ = 1.38 g cm-3);
bottom: low bulk density soil (γ = 1.20 g cm-3). Data for γ = 1.38 g cm-3 from Ansorge and
Godwin (2007 & 2008)].
This difference was, however, not significant (LSD [5% level] = 0.08578). The 800/10.5 t/2.5 b had a mean penetration resistance of 1.6402 MPa; this indicates a small difference compared with the 680/10.5 t/2.2 b for the same LSD value. It seems that a greater inflation pressure may have influenced this result since the contact patch areas were similar between these two tyres. This value is also greater than that of the 900/10.5 t/1.9 b which has a larger section width but lower inflation pressure. Finally, it was observed that for all the tyres; mean penetration resistance increased significantly (p < 0.001) towards the centre line of the wheel rut with the maximum value being recorded at the centre of the wheeling. In this respect, the 800/10.5 t/2.5 b had a significantly higher penetration resistance than the 680/10.5 t/2.2 b and the 900/10.5 t/1.9 b with mean values of 1.9648, 1.7164, and 1.7863 MPa respectively (LSD [5% level] = 0.11687).
Conclusions
The main conclusions coming from this research are highlighted below.
1. The initial soil condition (i.e. soil strength) was the main factor influencing final soil deformation, the increase in soil bulk density, rut dimensions, and the increase in penetration resistance, under the prevailing experimental conditions.
2. The increases in soil bulk density, calculated from soil deformation data for all the tyre configurations, were 25% for the low and between 2.3% and 5.2% for the high bulk density soils.
3. The 900 mm section tyre produced the lowest soil deformation, and therefore, the lowest increase in soil bulk density compared with the 680 mm and the 800 mm section tyres for all soil conditions; i.e. low, medium, and high bulk density soils. This can be attributable to a larger contact patch area and a lower inflation pressure of the 900 mm section tyre compared with the other two tyres.
4. The 680 mm and the 900 mm section tyres produced a lower increase in penetration resistance than the 800 mm section tyre. Lower inflation pressure and a greater contact patch area of the 900 and the 680 mm section tyres, compared to the 800 mm section, significantly reduced soil penetration resistance at the centre of the wheeling.
5. The increase in penetration resistance outside the wheeling was due to displacement of soil in the horizontal direction, particularly on the low bulk density soil, which was recorded in the displacement diagrams.
6. Linear relationships were established between drop cone penetration and maximum rut depth for all the tyre configurations used in this research. These data can be used to calculate the expected increase in soil bulk density for individual tyre configurations.
Acknowledgements
References
Ageikin, I.S., 1987. Off-the-road wheeled and combined traction devices: theory and calculation. Publisher: translated and published under an agreement for the US Department of Agriculture, Washington, DC, by Amerind Pub. Co.
Ansorge, D., and Godwin, R.J., 2007. The effects of tyres and a rubber track at high axle loads on soil compaction. Part 1: Single axle-studies. Journal of Biosystems Engineering 98: 115 – 126.
Ansorge, D., and Godwin, R.J., 2008. The effects of tyres and a rubber track at high axle loads on soil compaction. Part 2: Multi-axle-machine studies. Journal of Biosystems Engineering (2008), doi: 10.1016/j.biosystemseng.2007.11.014. [Article in press].
Ansorge, D., Antille, D.L., Stranks, S.N., and Godwin, R.J., 2007. The influence of tire sizes and tracks on soil compaction in an axle load range of 9 – 24 t. In: Proceedings of the Tyre
Technology Conference (March 13th-15th 2007) Cologne, Germany.
Earl, R., and Alexandrou, A., 2001. Deformation processes below a plate sinkage test on sandy loam soil: experimental approach. Journal of Terramechanics 38: 153 – 162.
GenStat Release 10.1 (10th Edition PC/Windows XP) Copyright 2007. Lewes Agricultural Trust
(Rothamsted Experimental Station). Registered to Cranfield University at Silsoe, Silsoe, MK45 4DT, UK.
Godwin, R.J., Brighton, J.L., Blackburn, K., Richards, T.E., Ansorge, D., and Wheeler, P.N., 2006. Off-road dynamics research at Cranfield University at Silsoe. Proceedings of ASABE
Annual International Meeting, Portland, Oregon (9th – 12th July 2006). Paper No.: 061131.
Godwin, R.J., Warner, N.L., and Smith, D.L.O., 1991. The development of a dynamic drop – cone device for the assessment of soil strength and the effects of machinery traffic. Journal of Agricultural Engineering Research 48: 123 – 131.
Hakansson, I., and Voorhees, W.B., 1998. Soil Compaction. p. 167-179. In: Methods for assessment of soil degradation. Edited by: Lal, R., Blum, W.H., Valentine, C., and Stewart, B.A. (Advances in Soil Sciences). CRS Press, Boca Raton, FL.
King, D.W., 1969. Soils of the Luton and Bedford District: a reconnaissance survey. Published by The Soil Survey of England and Wales, Harpenden, UK.
Misiewicz, P.A., Richards, T.E., Hann, M.J., and Godwin, R.J., 2008. Techniques for estimating contact pressure resulting from loaded agricultural tyres. In: Proceedings of ASABE Annual
International Meeting, Providence, Rhode Island (29th – 2nd July 2008).
Plackett, C.W., Clements, K., Dwyer, M., and Febo, P., 1987. The ground pressure of agricultural tyres. AFRC, Institute of Engineering Research, Silsoe, UK. Report No. 49.
Raper, R.L., 2005. Agricultural traffic impacts on soil. Journal of Terramechanics 42: 259 – 280. Stranks, S.N., 2006. The effects of tyre systems on the depth and severity of compaction. MSc by
Research-Thesis in Agricultural and Environmental Engineering (unpublished). Cranfield University at Silsoe, Silsoe, MK45 4DT, UK.