JOURNAL OFVIROLOGY, Dec. 2002, p. 12758–12774 Vol. 76, No. 24
0022-538X/02/$04.00⫹0 DOI: 10.1128/JVI.76.24.12758–12774.2002 Copyright © 2002, American Society for Microbiology. All Rights Reserved.
General and Specific Alterations in Programming of Global Viral
Gene Expression during Infection by VP16 Activation-Deficient
Mutants of Herpes Simplex Virus Type 1
William C. Yang,
1G. V. Devi-Rao,
2Peter Ghazal,
3Edward K. Wagner,
2* and Steven J. Triezenberg
1*
Department of Biochemistry and Molecular Biology, Michigan State University, East Lansing, Michigan 48824-13191; Department of Molecular Biology and Biochemistry and Center for Virus Research, University of California, Irvine, California 927172; and
Genomic Technology and Informatics Centre, University of Edinburgh, Summerhall, Edinburgh EH9 1QH, United Kingdom3 Received 12 June 2002/Accepted 13 September 2002
During productive infection by herpes simplex virus 1 (HSV-1), viral gene expression occurs in a temporally regulated cascade in which transcription of the viral immediate-early (IE) genes is strongly stimulated by the virion protein VP16. We have employed an oligonucleotide microarray to examine the effect of VP16 mutations on the overall pattern of viral gene expression following infection of HeLa cells. This microarray detects essentially all HSV-1 transcripts with relative and absolute levels correlating well with known kinetics of expression. This analysis revealed that deletion of the VP16 activation domain sharply reduced overall viral gene expression; moreover, the pattern of this reduced expression varied greatly from the pattern of a wild-type (wt) infection. However, when this mutant virus was delivered at a high multiplicity of infection or in the presence of the cellular stress inducer hexamethylene bisacetamide, expression was largely restored to the wt levels and pattern. Infection with virions that deliver wt VP16 protein at the start of infection but synthesize only truncated VP16 resulted in a normal kinetic cascade. This suggests that newly synthesized VP16 does not play a significant role in the expression of later classes of transcripts. The VP16 activation domain comprises two subregions. Deletion of the C-terminal subregion resulted in minimal changes in the level and profile of gene expression compared to a normal (wt) cascade. In contrast, deletion of the N-terminal subregion reduced the overall expression levels and skewed the relative levels of IE transcripts but did not significantly alter the kinetic pattern of early and late transcript expression. We conclude that the general activation of IE gene transcription by VP16, but not the specific ratios of IE transcripts, is necessary for the subsequent ordered expression of viral genes. Moreover, this report establishes the feasibility of microarray analysis for globally assessing viral gene expression programs as a function of the conditions of infection.
During productive infection of mammalian cells by herpes simplex virus type 1 (HSV-1), transcription of the viral genes occurs in a coordinated cascade (11, 28; reviewed in references 34 and 37). The five viral immediate-early (IE) genes are transcribed rapidly upon viral entry and uncoating. Synthesis of the IE proteins peaks at approximately 2 to 4 h postinfection (hpi), but they continue to accumulate throughout the infec-tion. The IE proteins stimulate the expression of the early (E) and late (L) genes and also have autoregulatory functions.
The virion protein VP16 activates transcription of the IE genes through specific sequence elements in the IE promoters (reviewed in reference 19). VP16 interacts with the viral DNA template by associating with the cellular proteins Oct-1 and HCF-1 at promoter elements containing the sequence TAAT-GARAT (where R represents purine) (reviewed in reference 9). Activation by VP16 is also exerted through DNA sequences bound by the cellular protein GABP (15, 25, 32). Transcrip-tional activation is mediated by interactions of the VP16
acti-vation domain with components of the RNA polymerase II transcription machinery and perhaps any of several cellular coactivators (reviewed in references 7 and 30). Mutations within the VP16 activation domain can result in reduced ex-pression from IE promoters either on reporter plasmids or on viral genomes (for examples, see references 4, 5, 27, 29, 31, and 35). Infection of permissive cells in the absence of expression of IE proteins markedly decreases virus yield and, by inference, the efficiency of initiation of productive infection in any given cell.
Among the open questions pertaining to the kinetic cascade of transcription exhibited in HSV-1 infection is whether spe-cific defects in IE expression result in defects in expression of specific E or L genes or to a more global reduction of all later transcripts. This question has an important bearing on accurate modeling of latency and certain aspects of viral neuropatho-genesis. To explore this question, we have used an oligonucle-otide-based DNA microarray to determine the steady-state mRNA abundance and thus the level of expression of HSV-1 genes from viruses that harbor specific mutations in the VP16 activation domain (29).
DNA microarrays are powerful tools for analyzing genome-wide expression under different biological conditions and have been profitably used to examine both the expression of the viral genes and the effects of viral infection on host gene expression (16, 33). Microarrays can assess steady-state RNA
* Corresponding author. Mailing address for S. J. Triezenberg: De-partment of Biochemistry and Molecular Biology, 510 Biochemistry Building, Michigan State University, East Lansing, MI 48824-1319. Phone: (517) 353-7120. Fax: (517) 353-9334. E-mail: triezenb@msu .edu. Mailing address for E. K. Wagner: Department of Molecular Biology and Biochemistry and Center for Virus Research, University of California, Irvine, CA 92717-3900. Phone: (949) 824-5370. Fax: (949) 824-8551. E-mail: [email protected].
12758
on November 8, 2019 by guest
http://jvi.asm.org/
levels of many genes simultaneously from a given sample but, like single-gene assays such as Northern blots, primer exten-sion, and nuclease protection assays, do not distinguish be-tween rates of mRNA synthesis and rates of mRNA decay. Microarray analyses of viral gene expression patterns following infection with cytomegalovirus, human herpesvirus 8, and HSV-1 were used to assign specific viral genes to either the latent or lytic pathway and to define kinetic classes for previ-ously uncharacterized genes (3, 12, 21, 26, 33). Furthermore, despite a general decline in host cell mRNA levels during HSV-1 infection (14, 20), microarray analyses of host gene expression indicated increased expression of several transcrip-tion factors, the stress response protein GADD45, and inter-feron-dependent and interferon-independent transcripts (13). Infection by a viral mutant expressing only one IE protein, ICP0, induced the expression of a small set of host genes, many associated with cell cycle arrest (10). Similar microarray anal-yses of host gene expression have been performed for infec-tions by other herpesviruses, including human cytomegalovirus (38) and Marek’s disease virus (18).
A prototype HSV-1 oligonucleotide microarray was previ-ously used to assess the regulatory impact of a mutation in the IE gene encoding ICP27 (26). In the present report, we de-scribe the use of an expanded HSV-1 array to examine gene expression from viruses that lack part or all of the VP16 acti-vation domain. Complete deletion of the VP16 actiacti-vation do-main resulted in significant disruption of the normal global patterns of regulated HSV gene expression. This disruption could be largely overcome by increasing the number of virion particles or by infecting in the presence of a cellular stress
inducer, N⬘,N⬘-hexamethylene bisacetamide (HMBA).
Dele-tion of either of two subregions of the activaDele-tion domain re-sulted in different changes in the relative levels of IE tran-scripts but did not markedly alter the overall relative patterns of transcript abundance seen in a normally regulated cascade of expression.
MATERIALS AND METHODS
Cells and viruses.HeLa cells were obtained from the American Type Culture Collection. 16-8 cells, which are Vero cells bearing an integrated copy of the VP16 gene, were obtained from Steven Weinheimer (36). Cells were maintained at 37°C under 10% CO2in Dulbecco modified Eagle medium containing 10%
fetal bovine serum. Cultures of 3⫻106HeLa or 16-8 cells in 100-mm2plates
were used for infections. Virus was adsorbed for 1 h prior to the addition of fresh overlay medium consisting of Dulbecco modified Eagle medium containing 2% fetal bovine serum. For cells treated with cycloheximide (Sigma), the inhibitor was added at a concentration of 60g/ml for 1 h prior to addition of virus and was present in the virus inoculum and overlay medium. HMBA (Sigma) was added after virus adsorption to a final concentration of 5 mM.
Viral mutants constructed from the KOS strain of HSV-1 have been described (29). Strain RP3 bears a deletion of codons 456 to 490 of the VP16 gene, RP4 lacks codons 413 to 452, and RP5 lacks codons 413 to 490. RP5 grown on the VP16-expressing cell line 16-8 is designated RP5/16-8. The mutation in RP5 was rescued by homologous recombination using a wild-type VP16 gene fragment from strain KOS, yielding strain RP5R, which was used here as the control wt virus.
RNA preparation and generation of fluorescence-tagged cDNA.Total RNA was harvested at various times after infection by using Tri-Reagent (Molecular Research Center, Inc., Cincinnati, Ohio). Labeling and hybridization procedures have been described in detail (26). Fluorescence-labeled cDNA was prepared from 1-g aliquots of purified poly(A)-containing RNA by random hexamer-primed polymerization using Superscript II reverse transcriptase (Gibco-BRL). The pool of nucleotides in the labeling reaction consisted of 0.5 mM dGTP, dATP, and dTTP, 0.3 mM dCTP, and fluorescent nucleotides (Cy3dCTP or
Cy5dCTP; Amersham) at 0.1 mM. Fluorescence-labeled DNA was purified by chromatography through Microcon YM-20 columns (Amicon), heat denatured for 2 min at 100°C, and incubated for 20 to 30 min at 37°C before use.
Generation of microarrays, hybridization, and scanning.Oligonucleotide se-lection, synthesis, and deposition on the chip have been described (26, 33). Microarrays were hybridized for 16 h in 5⫻SSC (1⫻SSC is 0.15 M NaCl plus 0.015 M sodium citrate)–0.2% sodium dodecyl sulfate (SDS) at 68°C under coverslips with combined Cy5dCTP and Cy3dCTP-labeled cDNA. The entire assembly was enclosed in a commercial hybridization chamber (GeneMachines, San Carlos, Calif.). After hybridization, the microarray slide assembly was washed for 5 min in 1⫻SSC–0.2% SDS at room temperature for 5 min, 5 min in 0.1⫻SSC–0.2% SDS at room temperature, and 1 min in 0.1⫻SSC and spun dry in a low-speed centrifuge. Microarrays were scanned with a confocal laser Sca-nArray 4000 system (General Scanning, Inc.). Data were collected at a maximum resolution of 10m/pixel with 16 bits of depth by using Quantarray software (General Scanning, Inc.).
The scanning process samples the fluorescence (expressed in arbitrary units) derived from each spotted oligonucleotide. These values were adjusted by sub-tracting the background fluorescence of an equivalent area within a concentric ring just outside the spotted sample. The data from individual spots were then expressed in a Microsoft Excel spreadsheet, and net values were determined by subtracting the average of values obtained from measuring the fluorescence of a large number (ca. 100) of regions spotted with SSC alone. Typically, and de-pending on the exact laser power of the scan, this SSC background ranged from 50 to 500 arbitrary units.
Weak fluorescent signals are inherently less reliable than strong ones. More-over, the ratio of fluorescent signal to actual sample value is linear only to net (minus SSC) values of 40,000 or so. To accommodate these limitations, laser power for scanning was adjusted for optimum signal sensitivity to between 75 and 90, with the photomultiplier set at 5 units less than the laser power. Standard-ization studies have shown that increasing laser power by 5 units in the range used increases signals in the reciprocity range approximately by a factor of 2. Multiple scans at various laser power settings were used to optimize all signals of interest.
To compare data from the various experimental conditions, the net (minus SSC) hybridization values were compiled in several steps. First, in each separate experiment (hybridization) and for each transcript set, a median value was calculated from the three or six replicate probe spots on a given chip. Each experiment was repeated at least three times, and the median values from those experiments were pooled to calculate the final median values displayed in the tables. To compare data from replicate experiments, the 75th percentile rank for the total viral hybridization was calculated. One experiment was arbitrarily cho-sen as the reference and the 75th percentile values of all other determinations were adjusted to this value by appropriate factoring. In this way, chips belonging to each experimental group are scaled accordingly. The relative abundance of each transcript was calculated as the quotient of the final median value for that transcript divided by the sum of the median values for all viral transcripts. These relative abundance values are displayed as percentages. To compare expression levels under different conditions, the sets of median values (or, in some cases, the sets of relative abundance values) from all replicates of the conditions being considered were evaluated using Student’s two-tailedttest, assuming unequal variance and with the null hypothesis being that the true values under those two conditions are identical.
RESULTS
Lack of VP16 activation of IE transcripts profoundly affects
the normal transcription program. An oligonucleotide
mi-croarray specific for HSV-1 has been developed to effectively measure the abundance of a large set of viral RNAs, with results fully consistent with the established kinetics of gene expression (26). The HSV-1 chip used initially contained 60 sets of sense oligonucleotides for the unique detection of HSV-1 transcript families, including 28 probes representing HSV-1 transcripts that are uniquely terminated by a cleavage and polyadenylation signal and 24 additional probes represent-ing partially overlapprepresent-ing transcripts. In the present work, we employed an expanded array that contains 5⬘-specific as well as 3⬘-specific probes to resolve nested transcript sets (described in
VOL. 76, 2002 MICROARRAY ANALYSIS OF HSV-1 VP16 ACTIVATION MUTANTS 12759
on November 8, 2019 by guest
http://jvi.asm.org/
detail in reference 33). This array contains 67 unique sets of HSV-1 probes, of which 43 represent transcripts from single genes. Another 11 probes detect sets of viral transcripts within a single kinetic class that share polyadenylation signals. Thus, a total of 54 probes detect either individual or overlapping transcript sets whose kinetics can be unambiguously assigned, while an additional 13 probes detect either overlapping tran-scripts of different kinetic classes or trantran-scripts whose kinetics have not been previously assigned. For example, the oligonu-cleotides corresponding to the IE gene encoding ICP47 also detect transcripts from two E promoters.
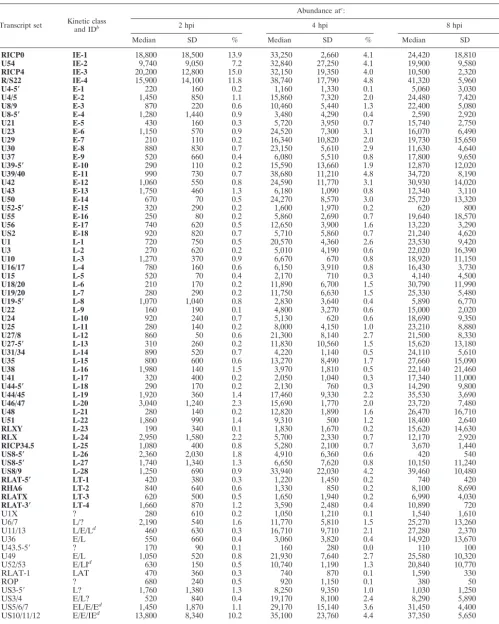
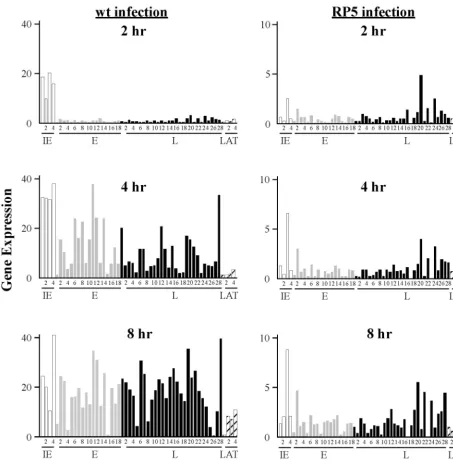
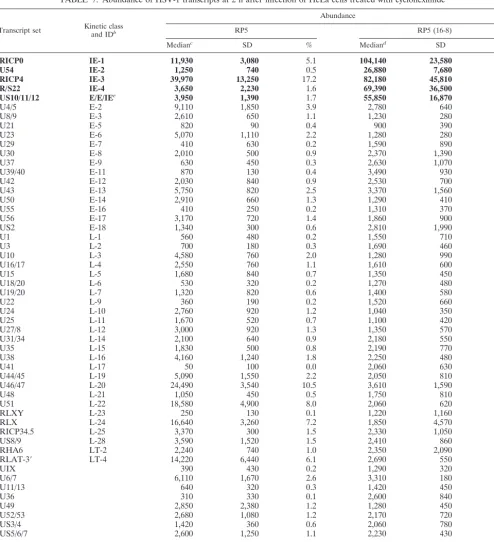
To validate the ability of this new microarray to detect viral transcripts of various kinetic classes, we used this array to measure RNAs expressed during infection of HeLa cells by a wt HSV-1 virus. Our nominal wt virus, designated RP5R, is a derivative of strain KOS and was constructed by replacing the truncated VP16 gene of strain RP5 with the intact wt VP16 gene (29). HeLa cells were infected with RP5R virus at a multiplicity of infection (MOI) of 5 PFU/cell. After 2, 4, or 8 h, poly(A)-containing mRNA was isolated. Fluorescent-labeled cDNA was synthesized and hybridized to the HSV-1 chip, and the fluorescence at each oligonucleotide spot was measured by laser scanning. The results derived from four independent hy-bridizations (two biological replicates) are compiled in Table 1 and displayed in Fig. 1. For ease of comparison, the 54 tran-script groups that can be unambiguously assigned to a specific kinetic class are arbitrarily numbered and grouped according to kinetic classes (Table 1). The pattern of gene expression during RP5R infection followed the well-established kinetics of HSV-1 infection, with the IE genes predominating at 2 h, followed by the E genes at 4 h and the L genes at 8 h. After peak expression of the different kinetic classes of transcripts was reached, total amounts of RNA for most representatives of each class did not significantly decrease at later time points; however, the relative abundance of E transcripts declined as later transcripts accumulated. This pattern is typical of the normal E-to-L transition (26, 33).
To test the effects of the VP16 transcriptional activation domain on the global pattern of viral gene expression in in-fected cells, we inin-fected cells with RP5, a KOS derivative that lacks the activation domain of VP16 (amino acids 413 to 490). RP5 infections were carried out at a nominal MOI of 0.05 PFU/cell. These conditions result in a particle multiplicity of approximately 50 particles per cell, comparable to that used with the RP5R virus, since the particle/PFU ratio of the RP5
mutant is approximately 103, whereas this ratio is typically 10
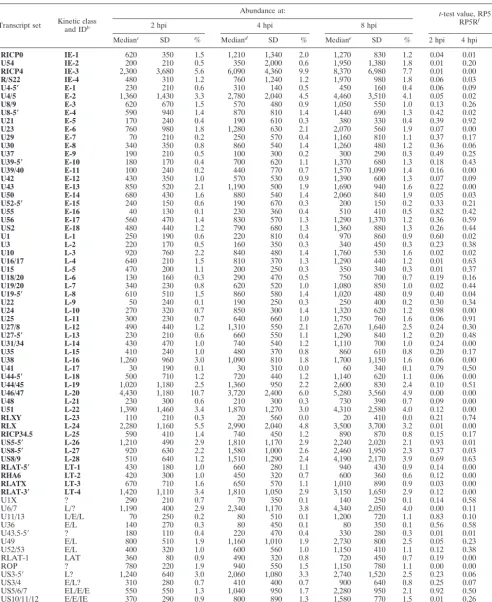
for wt viruses such as RP5R (29). Patterns of transcript abun-dance at 2, 4, and 8 h postinfection by RP5 were assessed using the oligonucleotide array (Table 2 and Fig. 1). At all times, the level of viral transcripts during RP5 infection was markedly reduced compared to the RP5R (wt) infections. Notably, at 2 h postinfection, only one of the five IE genes, ICP4, was ex-pressed at levels higher than twice the SSC background. IE gene transcript levels increased with statistical significance 4 and 8 h after infection, but they still remained well below the wt levels. Interestingly, if IE transcript levels in RP5 infection reflect “basal” activity of the corresponding promoters, then the degree of activation by VP16 is apparently inversely cor-related with that basal activity (compare 2- and 4-h time points in Tables 1 and 2). Most transcript sets diagnostic of E and L
genes were insignificant at 2 h following infection but showed statistically significant increases in expression at later times. The relatively high levels of some E and L transcripts at 2 hpi
(E-2 [UL4/5], L-16 [UL38], L-19 [UL44/45], L-20 [UL46], L-22
[UL51], L-24 [RLX], L-26 [US5], and LT-4 [LAT-3⬘]) may
indicate aberrant expression, since many are also seen in the presence of cycloheximide following RP5R infection (see be-low). However, since the absolute levels of expression are quite low, we cannot rule out the possibility that some of these elevated values are background artifacts.
Given that the overall levels of gene expression were re-duced in RP5 infection, we then asked whether the cascade of gene expression—that is, the relative abundance of each tran-script in a given kinetic class—was affected by deletion of the VP16 activation domain. To make this comparison, we first calculated the relative abundance of each signal (relative to the total viral signal) for each replicate experiment at every time point. The sets of relative abundances for a given transcript in
the two infections were then compared by using Student’s t
test, where the null hypothesis is that the true values from the two infections are the same. The results of this comparison are
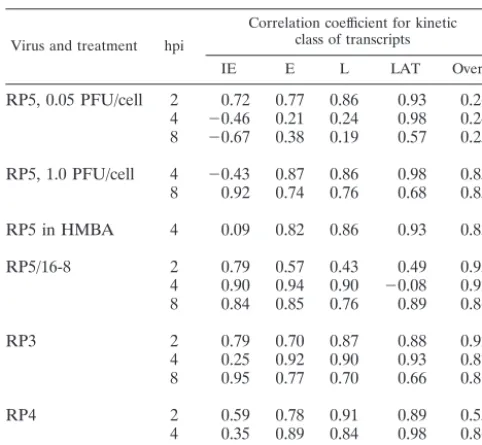
shown in Table 2. The null hypothesis is rejected (P⬍0.05) for
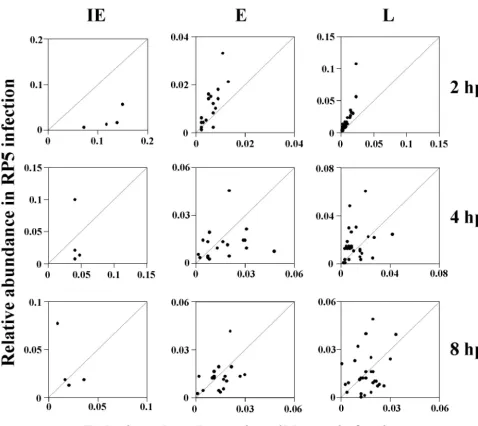
one-third or more of the genes in each kinetic class, indicating that the relative abundances of those transcripts are signifi-cantly different in RP5 infection than in a wt (RP5R) infection. We take this as strong evidence that the pattern of viral gene expression during RP5 infection is aberrant and does not sim-ply reflect a reduced level of a normal gene expression pattern. The difference in transcription patterns during infection by RP5 and wt viruses can also be demonstrated by scatter anal-ysis by plotting the relative abundance of each transcript (based on the median values reported in Tables 1 and 2) in RP5 infection against corresponding values from RP5R infec-tions (Fig. 2). Correlation coefficients calculated for each ki-netic class at each time point are shown in Table 3. The weak correlations for all kinetic classes (IE, E, and L) at 4 and 8 hpi strongly imply that the patterns of viral gene expression are markedly different in cells infected by the RP5 and RP5R viruses. Thus, the expression seen in RP5 infection does not represent a low level of a normal gene expression pattern but an aberrant pattern altogether.
HMBA and MOI have differential effects on the levels of specific IE transcripts while activating a normal regulatory
cascade.The cell-differentiating agent HMBA can increase the
titer of viruses with mutations in VP16. For example, the
poorly replicating viral mutant strainin1814 contains a
four-amino-acid insertion in VP16 that prevents interaction with Oct-1 and is unable to activate IE transcription in standard infection conditions (1). By mechanisms that are not yet well understood, HMBA compensates for the loss of activation by VP16 and permits viral replication and production (17).
To explore the nature of compensation by HMBA, we asked whether this agent could alter or revert the kinetic pattern of viral gene expression during RP5 infection to resemble that of a wt infection. We infected HeLa cells with RP5 at an MOI of 0.05 PFU/cell in the presence of 5 mM HMBA and harvested RNA at 4 hpi. Gene expression levels derived from four hy-bridization experiments are shown in Table 4. Overall viral expression was considerably greater than the level observed during RP5 infection in the absence of HMBA (Table 2) and
12760 YANG ET AL. J. VIROL.
on November 8, 2019 by guest
http://jvi.asm.org/
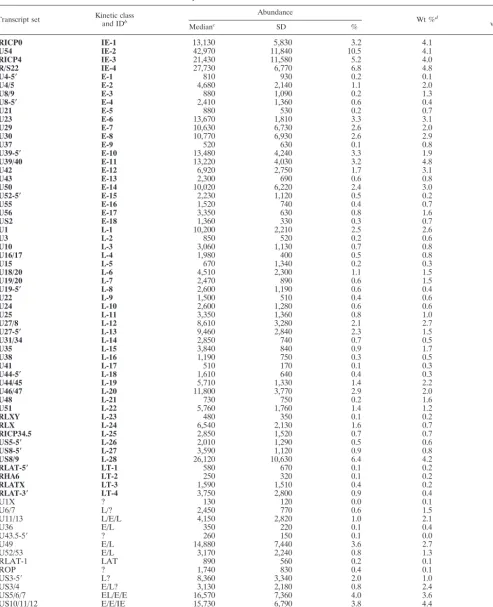
TABLE 1. Abundance of HSV-1 transcripts at various times following infection of HeLa cells with RP5R virusa
Transcript set Kinetic classand IDb
Abundance atc:
2 hpi 4 hpi 8 hpi
Median SD % Median SD % Median SD %
RICP0 IE-1 18,800 18,500 13.9 33,250 2,660 4.1 24,420 18,810 2.1
U54 IE-2 9,740 9,050 7.2 32,840 27,250 4.1 19,900 9,580 1.7
RICP4 IE-3 20,200 12,800 15.0 32,150 19,350 4.0 10,500 2,320 0.9
R/S22 IE-4 15,900 14,100 11.8 38,740 17,790 4.8 41,320 5,960 3.6
U4-5ⴕ E-1 220 160 0.2 1,160 1,330 0.1 5,060 3,030 0.4
U4/5 E-2 1,450 850 1.1 15,860 7,320 2.0 24,480 7,420 2.1
U8/9 E-3 870 220 0.6 10,460 5,440 1.3 22,400 5,080 1.9
U8-5ⴕ E-4 1,280 1,440 0.9 3,480 4,290 0.4 2,590 2,920 0.2
U21 E-5 430 160 0.3 5,720 3,950 0.7 15,740 2,750 1.4
U23 E-6 1,150 570 0.9 24,520 7,300 3.1 16,070 6,490 1.4
U29 E-7 210 110 0.2 16,340 10,820 2.0 19,730 15,650 1.7
U30 E-8 880 830 0.7 23,150 5,610 2.9 11,630 4,640 1.0
U37 E-9 520 660 0.4 6,080 5,510 0.8 17,800 9,650 1.5
U39-5ⴕ E-10 290 110 0.2 15,590 13,660 1.9 12,870 12,020 1.1
U39/40 E-11 990 730 0.7 38,680 11,210 4.8 34,720 8,190 3.0
U42 E-12 1,060 550 0.8 24,590 11,770 3.1 30,930 14,020 2.7
U43 E-13 1,750 460 1.3 6,180 1,090 0.8 12,340 3,110 1.1
U50 E-14 670 70 0.5 24,270 8,570 3.0 25,720 13,320 2.2
U52-5ⴕ E-15 320 290 0.2 1,600 1,970 0.2 620 800 0.1
U55 E-16 250 80 0.2 5,860 2,690 0.7 19,640 18,570 1.7
U56 E-17 740 620 0.5 12,650 3,900 1.6 13,220 3,290 1.1
US2 E-18 920 820 0.7 5,710 5,860 0.7 21,240 4,620 1.8
U1 L-1 720 750 0.5 20,570 4,360 2.6 23,530 9,420 2.0
U3 L-2 270 620 0.2 5,010 4,190 0.6 22,020 16,390 1.9
U10 L-3 1,270 370 0.9 6,670 670 0.8 18,920 11,150 1.6
U16/17 L-4 780 160 0.6 6,150 3,910 0.8 16,430 3,730 1.4
U15 L-5 520 70 0.4 2,170 710 0.3 4,140 4,500 0.4
U18/20 L-6 210 170 0.2 11,890 6,700 1.5 30,790 11,990 2.7
U19/20 L-7 280 290 0.2 11,750 6,630 1.5 25,330 5,480 2.2
U19-5ⴕ L-8 1,070 1,040 0.8 2,830 3,640 0.4 5,890 6,770 0.5
U22 L-9 160 190 0.1 4,800 3,270 0.6 15,000 2,020 1.3
U24 L-10 920 240 0.7 5,130 620 0.6 18,690 9,350 1.6
U25 L-11 280 140 0.2 8,000 4,150 1.0 23,210 8,880 2.0
U27/8 L-12 860 50 0.6 21,300 8,140 2.7 21,500 8,330 1.9
U27-5ⴕ L-13 310 260 0.2 11,830 10,560 1.5 15,620 13,180 1.3
U31/34 L-14 890 520 0.7 4,220 1,140 0.5 24,110 5,610 2.1
U35 L-15 800 600 0.6 13,270 8,490 1.7 27,660 15,090 2.4
U38 L-16 1,980 140 1.5 3,970 1,810 0.5 22,140 21,460 1.9
U41 L-17 320 400 0.2 2,050 1,040 0.3 17,340 11,000 1.5
U44-5ⴕ L-18 290 170 0.2 2,130 760 0.3 14,290 9,800 1.2
U44/45 L-19 1,920 360 1.4 17,460 9,330 2.2 35,530 3,690 3.1
U46/47 L-20 3,040 1,240 2.3 15,690 1,770 2.0 23,720 7,480 2.0
U48 L-21 280 140 0.2 12,820 1,890 1.6 26,470 16,710 2.3
U51 L-22 1,860 990 1.4 9,310 500 1.2 18,400 2,640 1.6
RLXY L-23 190 340 0.1 1,830 1,670 0.2 15,620 14,630 1.3
RLX L-24 2,950 1,580 2.2 5,700 2,330 0.7 12,170 2,920 1.1
RICP34.5 L-25 1,080 400 0.8 5,280 2,100 0.7 3,670 1,440 0.3
US8-5ⴕ L-26 2,360 2,030 1.8 4,910 6,360 0.6 420 540 0.0
US8-5ⴕ L-27 1,740 1,340 1.3 6,650 7,620 0.8 10,150 11,240 0.9
US8/9 L-28 1,250 690 0.9 33,940 22,030 4.2 39,460 10,480 3.4
RLAT-5ⴕ LT-1 420 380 0.3 1,220 1,450 0.2 740 420 0.1
RHA6 LT-2 840 640 0.6 1,330 850 0.2 8,100 8,690 0.7
RLATX LT-3 620 500 0.5 1,650 1,940 0.2 6,990 4,030 0.6
RLAT-3ⴕ LT-4 1,660 870 1.2 3,590 2,480 0.4 10,890 720 0.9
U1X ? 280 610 0.2 1,050 1,210 0.1 1,540 1,610 0.1
U6/7 L/? 2,190 540 1.6 11,770 5,810 1.5 25,270 13,260 2.2
U11/13 L/E/Ld 460 630 0.3 16,710 9,710 2.1 27,280 2,370 2.4
U36 E/L 550 660 0.4 3,060 3,820 0.4 14,920 13,670 1.3
U43.5-5⬘ ? 170 90 0.1 160 280 0.0 110 100 0.0
U49 E/L 1,050 520 0.8 21,930 7,640 2.7 25,580 10,320 2.2
U52/53 E/LId 630 150 0.5 10,740 1,190 1.3 20,840 10,770 1.8
RLAT-1 LAT 470 360 0.3 740 870 0.1 1,590 330 0.1
ROP ? 680 240 0.5 920 1,150 0.1 380 50 0.0
US3-5⬘ L? 1,760 1,380 1.3 8,250 9,350 1.0 1,030 1,250 0.1
US3/4 E/L? 520 840 0.4 19,170 8,100 2.4 8,290 5,890 0.7
US5/6/7 EL/E/Ed 1,450 1,870 1.1 29,170 15,140 3.6 31,450 4,400 2.7
US10/11/12 E/E/IEd 13,800 8,340 10.2 35,100 23,760 4.4 37,350 5,650 3.2
Total 134,900 802,760 1,157,500
aInfection was initiated at an MOI of 5 PFU per cell. Bold entries represent either single transcripts or multiple transcripts of the same kinetic class.
bTranscripts are assigned to kinetic classes as described in reference 34. LT, latency associated. Arbitrary identification numbers (ID) are used for simplicity in Fig. 1 and 3. cThe median value is based on four separate experiments, calculated as described in Materials and Methods. All signals were measured at a laser power of 80 with a
photomultiplier at 75. Relative values (%) are the quotient of the median signal for a given transcript divided by the total viral signal, multiplied by 100.
dThis probe detects transcripts from several genes of different kinetic classes.
12761
on November 8, 2019 by guest
http://jvi.asm.org/
approached the levels observed during infection by the wt RP5R virus (Table 1). Of the IE genes, only that encoding ICP0 showed a significantly lower median expression level (approximately 40%) in RP5-HMBA infection than in RP5R
infection. In contrast, UL54 (ICP27) expression was relatively
high in HMBA-treated cells. Very few E and L genes showed statistically significant differences in expression based on
rela-tive abundance (Student’sttest) (Table 4). Thus, despite
dif-ferences in expression of two of the IE transcripts, the overall levels and patterns of E and L gene expression during RP5 infection in HMBA and during wt RP5R infection were quite
[image:5.603.66.520.70.539.2]similar. This conclusion was supported by correlation coeffi-cients calculated for the relative abundance values for RP5-HMBA versus RP5R (Table 3). Although the correlation co-efficient for the IE genes was rather low, the correlation coefficients for the E and L genes were quite high. This result implies that, in the absence of activation by VP16, HMBA stimulates expression of the IE genes but not in normal ratios. Nonetheless, the IE gene expression induced by HMBA is sufficient to support later waves of viral gene expression in relatively normal patterns. Thus, considerable variation in rel-ative levels of IE transcripts can be tolerated during HSV
FIG. 1. Gene expression levels during infection with wt (RP5R) or VP16 activation domain-deficient (RP5) isolates of HSV-1. Microarray chips were hybridized with probes prepared from RNA harvested from HeLa cells infected with wt or RP5 virus at 2, 4, or 8 hpi. The levels of expression for IE (open), E (shaded), L (solid), and latency-associated (LAT) (hatched) transcripts are in arbitrary units. The numbers corresponding to individual transcripts are defined in Table 1.
12762 YANG ET AL. J. VIROL.
on November 8, 2019 by guest
http://jvi.asm.org/
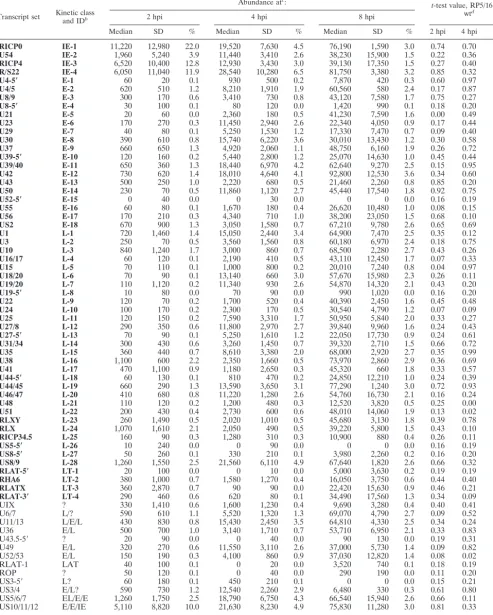
TABLE 2. Abundance of HSV-1 transcripts at various times following infection of HeLa cells with RP5 virusa
Transcript set Kinetic classand IDb
Abundance at: t-test value, RP5 vs
RP5Rf
2 hpi 4 hpi 8 hpi
Medianc SD % Mediand SD % Mediane SD % 2 hpi 4 hpi 8 hpi
RICP0 IE-1 620 350 1.5 1,210 1,340 2.0 1,270 830 1.2 0.04 0.01 0.28
U54 IE-2 200 210 0.5 350 2,000 0.6 1,950 1,380 1.8 0.01 0.20 0.48
RICP4 IE-3 2,300 3,680 5.6 6,090 4,360 9.9 8,370 6,980 7.7 0.01 0.00 0.00
R/S22 IE-4 480 310 1.2 760 1,240 1.2 1,970 980 1.8 0.06 0.03 0.00
U4-5ⴕ E-1 230 210 0.6 310 140 0.5 450 160 0.4 0.06 0.09 0.88
U4/5 E-2 1,360 1,430 3.3 2,780 2,040 4.5 4,460 3,510 4.1 0.05 0.02 0.00 U8/9 E-3 620 670 1.5 570 480 0.9 1,050 550 1.0 0.13 0.26 0.02 U8-5ⴕ E-4 590 940 1.4 870 810 1.4 1,440 690 1.3 0.42 0.02 0.00
U21 E-5 170 240 0.4 190 610 0.3 380 330 0.4 0.39 0.92 0.00
U23 E-6 760 980 1.8 1,280 630 2.1 2,070 560 1.9 0.07 0.00 0.19
U29 E-7 70 210 0.2 250 570 0.4 1,160 810 1.1 0.37 0.17 0.48
U30 E-8 340 350 0.8 860 540 1.4 1,260 480 1.2 0.36 0.06 0.51
U37 E-9 190 210 0.5 100 300 0.2 300 290 0.3 0.49 0.25 0.07
U39-5ⴕ E-10 180 170 0.4 700 620 1.1 1,370 680 1.3 0.18 0.43 0.98
U39/40 E-11 100 240 0.2 440 770 0.7 1,570 1,090 1.4 0.16 0.00 0.01
U42 E-12 430 350 1.0 570 530 0.9 1,390 600 1.3 0.07 0.09 0.06 U43 E-13 850 520 2.1 1,190 500 1.9 1,690 940 1.6 0.22 0.00 0.17 U50 E-14 680 430 1.6 880 540 1.4 2,060 840 1.9 0.05 0.03 0.39
U52-5ⴕ E-15 240 150 0.6 190 670 0.3 200 150 0.2 0.33 0.21 0.03
U55 E-16 40 130 0.1 230 360 0.4 510 410 0.5 0.82 0.42 0.19
U56 E-17 560 470 1.4 830 570 1.3 1,290 1,370 1.2 0.36 0.59 0.22 US2 E-18 480 440 1.2 790 680 1.3 1,360 880 1.3 0.26 0.44 0.12
U1 L-1 250 190 0.6 220 810 0.4 970 860 0.9 0.60 0.02 0.10
U3 L-2 220 170 0.5 160 350 0.3 340 450 0.3 0.23 0.38 0.10
U10 L-3 920 760 2.2 840 480 1.4 1,760 530 1.6 0.02 0.02 0.45
U16/17 L-4 640 210 1.5 810 370 1.3 1,290 440 1.2 0.01 0.63 0.24
U15 L-5 470 200 1.1 200 250 0.3 350 340 0.3 0.01 0.37 0.72
U18/20 L-6 130 160 0.3 290 470 0.5 750 700 0.7 0.19 0.16 0.02
U19/20 L-7 340 230 0.8 620 520 1.0 1,080 850 1.0 0.02 0.44 0.02
U19-5ⴕ L-8 610 510 1.5 860 580 1.4 1,020 480 0.9 0.40 0.04 0.25
U22 L-9 50 240 0.1 190 250 0.3 250 400 0.2 0.30 0.34 0.00
U24 L-10 270 320 0.7 850 300 1.4 1,320 620 1.2 0.98 0.00 0.44 U25 L-11 300 230 0.7 640 660 1.0 1,750 760 1.6 0.06 0.91 0.28
U27/8 L-12 490 440 1.2 1,310 550 2.1 2,670 1,640 2.5 0.24 0.30 0.11
U27-5ⴕ L-13 230 210 0.6 660 550 1.1 1,290 840 1.2 0.20 0.48 0.94
U31/34 L-14 430 470 1.0 740 540 1.2 1,110 700 1.0 0.24 0.00 0.03
U35 L-15 410 240 1.0 480 370 0.8 860 610 0.8 0.20 0.17 0.06
U38 L-16 1,260 960 3.0 1,090 810 1.8 1,700 1,150 1.6 0.06 0.00 0.47
U41 L-17 30 190 0.1 30 310 0.0 60 340 0.1 0.79 0.50 0.08
U44-5ⴕ L-18 500 710 1.2 720 440 1.2 1,140 620 1.1 0.06 0.00 0.87
U44/45 L-19 1,020 1,180 2.5 1,360 950 2.2 2,600 830 2.4 0.10 0.51 0.00
U46/47 L-20 4,430 1,180 10.7 3,720 2,400 6.0 5,280 3,560 4.9 0.00 0.00 0.00
U48 L-21 230 300 0.6 210 300 0.3 730 390 0.7 0.09 0.00 0.09
U51 L-22 1,390 1,460 3.4 1,870 1,270 3.0 4,310 2,580 4.0 0.12 0.00 0.00
RLXY L-23 110 210 0.3 20 560 0.0 20 410 0.0 0.21 0.74 0.19
RLX L-24 2,280 1,160 5.5 2,990 2,040 4.8 3,500 3,700 3.2 0.01 0.00 0.00
RICP34.5 L-25 590 410 1.4 740 450 1.2 890 870 0.8 0.15 0.17 0.00
US5-5ⴕ L-26 1,210 490 2.9 1,810 1,170 2.9 2,240 2,020 2.1 0.93 0.01 0.00
US8-5ⴕ L-27 920 630 2.2 1,580 1,000 2.6 2,460 1,950 2.3 0.37 0.03 0.03
US8/9 L-28 510 640 1.2 1,510 1,290 2.4 4,190 2,170 3.9 0.69 0.63 0.68
RLAT-5ⴕ LT-1 430 180 1.0 660 280 1.1 940 430 0.9 0.14 0.00 0.00
RHA6 LT-2 420 300 1.0 450 320 0.7 600 360 0.6 0.12 0.00 0.65
RLATX LT-3 670 710 1.6 650 570 1.1 1,010 890 0.9 0.03 0.00 0.05
RLAT-3ⴕ LT-4 1,420 1,110 3.4 1,810 1,050 2.9 3,150 1,650 2.9 0.12 0.00 0.00
U1X ? 290 210 0.7 70 350 0.1 140 250 0.1 0.14 0.58 0.67
U6/7 L/? 1,190 400 2.9 2,340 1,170 3.8 4,340 2,050 4.0 0.00 0.11 0.25 U11/13 L/E/L 70 250 0.2 80 510 0.1 1,200 720 1.1 0.83 0.10 0.00
U36 E/L 140 270 0.3 80 450 0.1 80 350 0.1 0.56 0.58 0.18
U43.5-5⬘ ? 180 110 0.4 220 470 0.4 330 280 0.3 0.01 0.01 0.00 U49 E/L 800 510 1.9 1,160 1,010 1.9 2,730 800 2.5 0.05 0.23 0.88 U52/53 E/L 400 320 1.0 600 560 1.0 1,150 410 1.1 0.12 0.38 0.15 RLAT-1 LAT 360 80 0.9 490 320 0.8 720 450 0.7 0.19 0.00 0.00
ROP ? 780 220 1.9 940 550 1.5 1,150 780 1.1 0.00 0.00 0.00
US3-5⬘ L? 1,240 640 3.0 2,060 1,080 3.3 2,740 1,520 2.5 0.23 0.06 0.00 US3/4 E/L? 310 280 0.7 410 400 0.7 900 640 0.8 0.25 0.07 0.36 US5/6/7 EL/E/E 550 550 1.3 1,040 950 1.7 2,280 950 2.1 0.92 0.50 0.08 US10/11/12 E/E/IE 370 290 0.9 800 890 1.3 1,580 770 1.5 0.01 0.26 0.00
Total 41,350 61,820 108,540
aInfection was initiated at an MOI of 0.05 PFU per cell. Bold entries represent either single transcripts or multiple transcripts of the same kinetic class. bSee Table 1, footnoteb.
cMedian values are based upon eight separate experiments. All signals were determined at a laser power of 90 with a photomultiplier at 85. dMedian value is based upon 17 separate hybridizations.
eMedian value is based upon 16 separate hybridizations.
fRelative values of transcript levels for infections by RP5R (wt) and RP5 at the various time points were compared using Student’sttest as described in Materials
and Methods. The null hypothesis is that the true values for the wt and mutant viruses are identical. A value of 0.00 is used to indicatePvalues of⬍0.01.
12763
on November 8, 2019 by guest
http://jvi.asm.org/
infection. This observation suggests an inherent plasticity in the viral regulatory network.
We have previously shown that infection by wt virus at MOIs ranging from 0.05 to 5 PFU/cell results in essentially the same temporal profile of transcript abundance (33). The infections described above used 50 virions per cell, which corresponds to an MOI of 5 PFU for wt virus or 0.05 PFU for the RP5 mutant grown on noncomplementing cells (29). These conditions were chosen to allow a comparison of equivalent numbers of parti-cles (and thus of viral DNA templates) on gene expression. However, in some cases, high-multiplicity infections can over-come defects in viral gene expression. Therefore, we tested whether infecting cells with greater numbers of RP5 virion particles would affect viral transcription. HeLa cells were in-fected with RP5 at an MOI of 1 PFU per cell (a 20-fold
[image:7.603.57.535.69.495.2]increase). RNA was extracted at 4 and 8 hpi, and viral mRNA levels were assessed by hybridization to DNA microarrays. Data derived from eight separate hybridizations are shown in Table 5. The higher-multiplicity infections led to significantly higher levels of viral transcripts, so that by 8 h most viral transcript levels were essentially equivalent to those in a wt infection. Moreover, most probes revealed time-based differ-ences in transcript abundance consistent with a rather normal kinetic cascade of expression. Despite this, some statistically significant differences were observed. For example, at 4 h, the median signals for ICP0 and ICP22 transcripts (and a number of E and L transcripts) were lower in high-multiplicity RP5 infection than in wt (RP5R) infection. In contrast, by 8 h the levels of these transcripts were typically indistinguishable in the two infections, but other genes (including that for ICP4)
FIG. 2. Correlation of transcript abundances between expression levels of RP5R (wt) and RP5 at 2, 4, and 8 hpi. The relative abundances of transcripts for RP5R infection are displayed on the abscissa, and the relative abundances of transcripts from an RP5 infection are on the ordinate. Each point represents a signal for IE, E, or L transcripts at 2, 4, or 8 hpi. For each plot, the ordinate and abscissa have the same units, and the expected locations of equivalent signals under both conditions (i.e., a correlation of 1.0) are indicated by the 45° diagonals.
12764 YANG ET AL. J. VIROL.
on November 8, 2019 by guest
http://jvi.asm.org/
showed differences at the later times. Correlation coefficients comparing RP5 at a high MOI with wt virus were calculated for the various kinetic classes (Table 3). At 4 h, the pattern of IE gene expression in the high-multiplicity RP5 infection did not correlate well with the pattern seen with the RP5R infection. At both 4 and 8 h, however, the relative expression levels for the E and L genes correlated well with the levels seen in wt RP5R infection. We conclude that both HMBA and high-multiplicity infections result in IE gene expression patterns noticeably different from those in wt infections, but nonethe-less the patterns of viral E and L gene expression at later times are not significantly affected.
VP16 produced during productive infection has no apparent
effect on E or L gene expression.Although virion-borne VP16
is best known as an activator of IE gene expression, the pos-sibility also exists that the VP16 produced in infected cells as a leaky-late protein might contribute to IE gene expression at later times in infection or might directly influence transcription of E or L genes. To distinguish between the effects of virion-borne and newly synthesized VP16 in infected cells, we used RP5 virions grown in a complementing cell line, 16-8 (36). These virions, designated RP5/16-8, contain normal amounts of wt VP16 protein in the tegument (expressed from the host cell) but express the truncated VP16 (lacking the activation domain) from the infecting viral genome (29). Oligonucleotide microarrays were used to assess the changes in abundance of viral transcripts in HeLa cells infected for 2, 4, and 8 h with RP5/16-8. The hybridization data reported in Table 6 were compared with the results for a wt (RP5R) infection (Table 1) for each gene at each time point, and correlation coefficients were calculated for the major kinetic classes (Table 3). The results reveal that during infection by RP5/16-8, all classes of
viral genes are expressed in essentially normal patterns. No significant difference in IE gene expression was noted at early or late times, nor were any E or L genes significantly altered during this infection. From this, we conclude that the VP16 protein translated at late times in infected cells has little direct impact on the gene expression in that cell.
Cycloheximide stimulates IE gene expression independently
of the VP16 activation domain.Cycloheximide has frequently
been used as a protein synthesis inhibitor to block translation of viral IE proteins and thus to arrest HSV infection at the IE stage. Other laboratories have previously reported that the presence of cycloheximide itself (or other translation inhibi-tors) can stimulate expression of individual IE genes as mea-sured by steady-state levels of IE or reporter gene mRNAs (22). We tested the effects of cycloheximide on the global pattern of viral gene expression in the absence or presence of stimulation by the VP16 activation domain. Cycloheximide-treated cells were infected with either RP5 or RP5/16-8. RNA was isolated at 2 hpi and hybridized to “first-generation” oli-gonucleotide array chips, with the results shown in Table 7. The overall signal strength for RP5/16-8 was much higher than that from the mutant infection, so relative values rather than absolute median values were used for comparisons with infec-tions in the absence of cycloheximide. The analysis indicates that during RP5 infection, cycloheximide caused a pronounced increase (20-fold) in ICP4 and ICP0 expression and modest increases (approximately 6-fold) in ICP22 and ICP27 expres-sion. The relatively elevated expression of transcripts hybrid-izing to probes L-20, L22, L-24, and LT-4 seen at 2 h in the RP5 infection (Table 1) was also seen here. In cells infected with viruses carrying intact VP16 protein (RP5/16-8), total IE gene expression was greater in the presence of cycloheximide than in its absence, but the impact on specific IE genes was less apparent. These results suggest that cycloheximide can stimu-late IE gene expression above that induced by VP16. More-over, the VP16-independent effect of cycloheximide is more pronounced on some IE genes than others, implying that some transcript-specific mechanism involving either mRNA stabili-zation or transcription effects (or both) might be involved. To date, the contributions of these factors to this cycloheximide effect on ICP4 and ICP0 abundance have not been identified.
Deletion of either of two subregions of the VP16 activation domain results in quantitative and qualitative changes in viral
gene expression.The activation domain of VP16 extends from
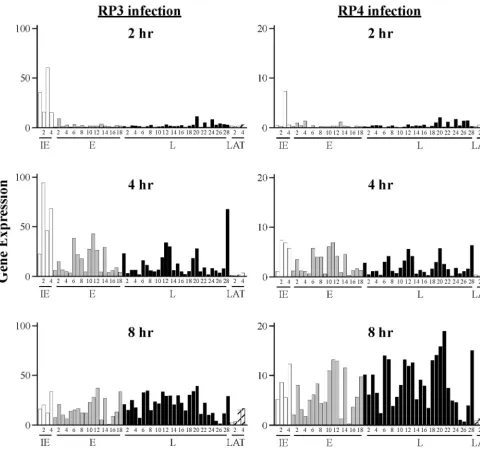
[image:8.603.42.283.98.321.2]amino acids 413 to 490, within which two subregions have been defined, each of which can function independently to activate transcription (23, 27, 35). To ask whether these two subregions support identical patterns of viral gene expression, we used two recombinant viruses in which only one subregion or the other is present on VP16. Strain RP3 retains VP16 amino acids 1 to 456 (and lacks residues 457 to 490), whereas in strain RP4 the amino acids 413 to 452 were deleted (29). We infected HeLa cells with each virus and harvested RNA at 2, 4, and 8 h. We then used DNA chip hybridization analysis to determine the median and relative values for abundance of each viral tran-script (Table 8). The abundance of trantran-scripts at the three time intervals, summarized in Fig. 3, permits three observations. First, the absolute expression levels of transcripts in cells in-fected with RP3 were essentially indistinguishable from those in wt infections, whereas transcript levels during RP4 infection
TABLE 3. Correlation between relative abundance of the different kinetic classes of HSV-1 transcripts following infection with
wt versus mutant viruses under various conditionsa
Virus and treatment hpi
Correlation coefficient for kinetic class of transcripts
IE E L LAT Overall
RP5, 0.05 PFU/cell 2 0.72 0.77 0.86 0.93 0.26 4 ⫺0.46 0.21 0.24 0.98 0.24 8 ⫺0.67 0.38 0.19 0.57 0.25
RP5, 1.0 PFU/cell 4 ⫺0.43 0.87 0.86 0.98 0.85 8 0.92 0.74 0.76 0.68 0.85
RP5 in HMBA 4 0.09 0.82 0.86 0.93 0.83
RP5/16-8 2 0.79 0.57 0.43 0.49 0.93
4 0.90 0.94 0.90 ⫺0.08 0.92 8 0.84 0.85 0.76 0.89 0.86
RP3 2 0.79 0.70 0.87 0.88 0.92
4 0.25 0.92 0.90 0.93 0.87 8 0.95 0.77 0.70 0.66 0.81
RP4 2 0.59 0.78 0.91 0.89 0.55
4 0.35 0.89 0.84 0.98 0.86 8 0.81 0.94 0.76 0.68 0.88
aComparisons are based on data in Tables 1, 2, 4, 5, 7, and 8. In each case,
relative abundance values for each transcript were compared to RP5R (wt) transcript abundances at the given time. LAT, latency associated.
VOL. 76, 2002 MICROARRAY ANALYSIS OF HSV-1 VP16 ACTIVATION MUTANTS 12765
on November 8, 2019 by guest
http://jvi.asm.org/
TABLE 4. Abundance of HSV-1 transcripts at 4 h after infection with RP5 virus in HeLa cells treated with HMBAa
Transcript set Kinetic classand IDb
Abundance
Wt %d ttest
valuee
Medianc SD %
RICP0 IE-1 13,130 5,830 3.2 4.1 0.04
U54 IE-2 42,970 11,840 10.5 4.1 0.03
RICP4 IE-3 21,430 11,580 5.2 4.0 0.32
R/S22 IE-4 27,730 6,770 6.8 4.8 0.16
U4-5ⴕ E-1 810 930 0.2 0.1 0.20
U4/5 E-2 4,680 2,140 1.1 2.0 0.27
U8/9 E-3 880 1,090 0.2 1.3 0.08
U8-5ⴕ E-4 2,410 1,360 0.6 0.4 0.44
U21 E-5 880 530 0.2 0.7 0.17
U23 E-6 13,670 1,810 3.3 3.1 0.47
U29 E-7 10,630 6,730 2.6 2.0 0.12
U30 E-8 10,770 6,930 2.6 2.9 0.99
U37 E-9 520 630 0.1 0.8 0.18
U39-5ⴕ E-10 13,480 4,240 3.3 1.9 0.15
U39/40 E-11 13,220 4,030 3.2 4.8 0.11
U42 E-12 6,920 2,750 1.7 3.1 0.21
U43 E-13 2,300 690 0.6 0.8 0.13
U50 E-14 10,020 6,220 2.4 3.0 0.99
U52-5ⴕ E-15 2,230 1,120 0.5 0.2 0.11
U55 E-16 1,520 740 0.4 0.7 0.18
U56 E-17 3,350 630 0.8 1.6 0.02
US2 E-18 1,360 330 0.3 0.7 0.25
U1 L-1 10,200 2,210 2.5 2.6 0.83
U3 L-2 850 520 0.2 0.6 0.21
U10 L-3 3,060 1,130 0.7 0.8 0.63
U16/17 L-4 1,980 400 0.5 0.8 0.30
U15 L-5 670 1,340 0.2 0.3 0.83
U18/20 L-6 4,510 2,300 1.1 1.5 0.31
U19/20 L-7 2,470 890 0.6 1.5 0.15
U19-5ⴕ L-8 2,600 1,190 0.6 0.4 0.24
U22 L-9 1,500 510 0.4 0.6 0.29
U24 L-10 2,600 1,280 0.6 0.6 0.77
U25 L-11 3,350 1,360 0.8 1.0 0.30
U27/8 L-12 8,610 3,280 2.1 2.7 0.43
U27-5ⴕ L-13 9,460 2,840 2.3 1.5 0.18
U31/34 L-14 2,850 740 0.7 0.5 0.12
U35 L-15 3,840 840 0.9 1.7 0.27
U38 L-16 1,190 750 0.3 0.5 0.30
U41 L-17 510 170 0.1 0.3 0.15
U44-5ⴕ L-18 1,610 640 0.4 0.3 0.19
U44/45 L-19 5,710 1,330 1.4 2.2 0.18
U46/47 L-20 11,800 3,770 2.9 2.0 0.04
U48 L-21 730 750 0.2 1.6 0.00
U51 L-22 5,760 1,760 1.4 1.2 0.65
RLXY L-23 480 350 0.1 0.2 0.22
RLX L-24 6,540 2,130 1.6 0.7 0.01
RICP34.5 L-25 2,850 1,520 0.7 0.7 0.92
US5-5ⴕ L-26 2,010 1,290 0.5 0.6 0.79
US8-5ⴕ L-27 3,590 1,120 0.9 0.8 0.72
US8/9 L-28 26,120 10,630 6.4 4.2 0.07
RLAT-5ⴕ LT-1 580 670 0.1 0.2 0.66
RHA6 LT-2 250 320 0.1 0.2 0.26
RLATX LT-3 1,590 1,510 0.4 0.2 0.12
RLAT-3ⴕ LT-4 3,750 2,800 0.9 0.4 0.04
U1X ? 130 120 0.0 0.1 0.20
U6/7 L/? 2,450 770 0.6 1.5 0.10
U11/13 L/E/L 4,150 2,820 1.0 2.1 0.22
U36 E/L 350 220 0.1 0.4 0.20
U43.5-5⬘ ? 260 150 0.1 0.0 0.14
U49 E/L 14,880 7,440 3.6 2.7 0.04
U52/53 E/L 3,170 2,240 0.8 1.3 0.01
RLAT-1 LAT 890 560 0.2 0.1 0.14
ROP ? 1,740 830 0.4 0.1 0.01
US3-5⬘ L? 8,360 3,340 2.0 1.0 0.22
US3/4 E/L? 3,130 2,180 0.8 2.4 0.10
US5/6/7 EL/E/E 16,570 7,360 4.0 3.6 0.27
US10/11/12 E/E/IE 15,730 6,790 3.8 4.4 0.96
Total 410,340
aInfection was initiated at an MOI of 0.05 PFU (50 virions) per cell in the presence of 5 mM HMBA. Bold entries represent either single transcripts or multiple
transcripts of the same kinetic class.
bSee Table 1, footnoteb.
cMedian values are based upon eight separate experiments. All values were determined at a laser power of 80 with a photomultiplier at 75%. dTaken from Table 1.
eStudent’s two-tailedttest (assuming unequal variance) was used to compare the relative abundance values of transcripts in all experiments of RP5-HMBA infection
with corresponding set of values for wt infection at 4 hpi (Table 1). The null hypothesis is that the values are identical.
12766
on November 8, 2019 by guest
http://jvi.asm.org/
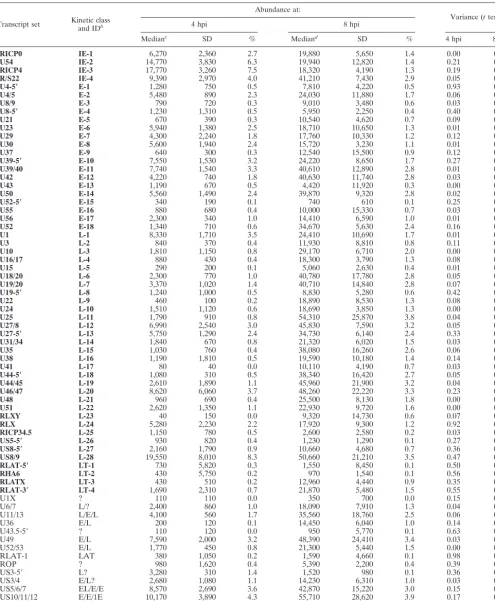
TABLE 5. Abundance of HSV-1 transcripts following high-multiplicity infection of HeLa cells with RP5a
Transcript set Kinetic classand IDb
Abundance at:
Variance (ttest)e
4 hpi 8 hpi
Medianc SD % Mediand SD % 4 hpi 8 hpi
RICP0 IE-1 6,270 2,360 2.7 19,880 5,650 1.4 0.00 0.59
U54 IE-2 14,770 3,830 6.3 19,940 12,820 1.4 0.21 0.37
RICP4 IE-3 17,770 3,260 7.5 18,320 4,190 1.3 0.19 0.01
R/S22 IE-4 9,390 2,970 4.0 41,210 7,430 2.9 0.05 0.89
U4-5ⴕ E-1 1,280 750 0.5 7,810 4,220 0.5 0.93 0.22
U4/5 E-2 5,480 890 2.3 24,030 11,880 1.7 0.06 0.58
U8/9 E-3 790 720 0.3 9,010 3,480 0.6 0.03 0.01
U8-5ⴕ E-4 1,230 1,310 0.5 5,950 2,250 0.4 0.40 0.14
U21 E-5 670 390 0.3 10,540 4,620 0.7 0.09 0.04
U23 E-6 5,940 1,380 2.5 18,710 10,650 1.3 0.01 0.12
U29 E-7 4,300 2,240 1.8 17,760 10,330 1.2 0.12 0.88
U30 E-8 5,600 1,940 2.4 15,720 3,230 1.1 0.01 0.13
U37 E-9 640 300 0.3 12,540 15,500 0.9 0.12 0.76
U39-5ⴕ E-10 7,550 1,530 3.2 24,220 8,650 1.7 0.27 0.25
U39/40 E-11 7,740 1,540 3.3 40,610 12,890 2.8 0.01 0.43
U42 E-12 4,220 740 1.8 40,630 11,740 2.8 0.03 0.70
U43 E-13 1,190 670 0.5 4,420 11,920 0.3 0.00 0.48
U50 E-14 5,560 1,490 2.4 39,870 9,320 2.8 0.02 0.08
U52-5ⴕ E-15 340 190 0.1 740 610 0.1 0.25 0.99
U55 E-16 880 680 0.4 10,000 15,330 0.7 0.03 0.52
U56 E-17 2,300 340 1.0 14,410 6,590 1.0 0.01 0.48
U52 E-18 1,340 710 0.6 34,670 5,630 2.4 0.16 0.00
U1 L-1 8,330 1,710 3.5 24,410 10,690 1.7 0.01 0.97
U3 L-2 840 370 0.4 11,930 8,810 0.8 0.11 0.43
U10 L-3 1,810 1,150 0.8 29,170 6,710 2.0 0.00 0.20
U16/17 L-4 880 430 0.4 18,300 3,790 1.3 0.08 0.25
U15 L-5 290 200 0.1 5,060 2,630 0.4 0.01 0.81
U18/20 L-6 2,300 770 1.0 40,780 17,780 2.8 0.05 0.15
U19/20 L-7 3,370 1,020 1.4 40,710 14,840 2.8 0.07 0.02
U19-5ⴕ L-8 1,240 1,000 0.5 8,830 5,280 0.6 0.42 0.37
U22 L-9 460 100 0.2 18,890 8,530 1.3 0.08 0.10
U24 L-10 1,510 1,120 0.6 18,690 3,850 1.3 0.00 0.68
U25 L-11 1,790 910 0.8 54,310 25,870 3.8 0.04 0.03
U27/8 L-12 6,990 2,540 3.0 45,830 7,590 3.2 0.05 0.00
U27-5ⴕ L-13 5,750 1,290 2.4 34,730 6,140 2.4 0.33 0.06
U31/34 L-14 1,840 670 0.8 21,320 6,020 1.5 0.03 0.67
U35 L-15 1,030 760 0.4 38,080 16,260 2.6 0.06 0.32
U38 L-16 1,190 1,810 0.5 19,590 10,180 1.4 0.14 0.74
U41 L-17 80 40 0.0 10,110 4,190 0.7 0.03 0.39
U44-5ⴕ L-18 1,080 310 0.5 38,340 16,420 2.7 0.05 0.01
U44/45 L-19 2,610 1,890 1.1 45,960 21,900 3.2 0.04 0.17
U46/47 L-20 8,620 6,060 3.7 48,260 22,220 3.3 0.23 0.04
U48 L-21 960 690 0.4 25,500 8,130 1.8 0.00 0.97
U51 L-22 2,620 1,350 1.1 22,930 9,720 1.6 0.00 0.35
RLXY L-23 40 150 0.0 9,320 14,730 0.6 0.07 0.82
RLX L-24 5,280 2,230 2.2 17,920 9,300 1.2 0.92 0.17
RICP34.5 L-25 1,150 780 0.5 2,600 2,580 0.2 0.03 0.63
US5-5ⴕ L-26 930 820 0.4 1,230 1,290 0.1 0.27 0.06
US8-5ⴕ L-27 2,160 1,790 0.9 10,660 4,680 0.7 0.36 0.81
US8/9 L-28 19,550 8,010 8.3 50,660 21,210 3.5 0.47 0.16
RLAT-5ⴕ LT-1 730 5,820 0.3 1,550 8,450 0.1 0.50 0.28
RHA6 LT-2 430 5,750 0.2 970 1,540 0.1 0.56 0.20
RLATX LT-3 430 510 0.2 12,960 4,440 0.9 0.35 0.02
RLAT-3ⴕ LT-4 1,690 2,310 0.7 21,870 5,480 1.5 0.55 0.00
U1X ? 110 110 0.0 350 700 0.0 0.15 0.31
U6/7 L/? 2,400 860 1.0 18,090 7,910 1.3 0.04 0.24
U11/13 L/E/L 4,100 560 1.7 35,560 18,760 2.5 0.06 0.24
U36 E/L 200 120 0.1 14,450 6,040 1.0 0.14 0.81
U43.5-5⬘ ? 110 120 0.0 950 5,770 0.1 0.63 0.19
U49 E/L 7,590 2,000 3.2 48,390 24,410 3.4 0.03 0.03
U52/53 E/L 1,770 450 0.8 21,300 5,440 1.5 0.00 0.71
RLAT-1 LAT 380 1,050 0.2 1,590 4,660 0.1 0.98 0.34
ROP ? 980 1,620 0.4 5,390 2,200 0.4 0.39 0.01
US3-5⬘ L? 3,280 310 1.4 1,520 980 0.1 0.36 0.24
US3/4 E/L? 2,680 1,080 1.1 14,230 6,310 1.0 0.03 0.12
US5/6/7 EL/E/E 8,570 2,690 3.6 42,870 15,220 3.0 0.15 0.02
US10/11/12 E/E/1E 10,170 3,890 4.3 55,710 28,620 3.9 0.17 0.02
Total 235,570 1,442,860
aInfection was initiated at an MOI of 1 PFU (approximately 1,000 virions) of RP5 per cell. Bold entries represent either single transcripts or multiple transcripts
of the same kinetic class.
bSee Table 1, footnoteb.
cMedian values are based upon eight separate experiments. All values were determined at a laser power of 80 with a photomultiplier at 75%. dMedian values are based upon seven separate experiments.
eThe relative abundance values for high-multiplicity infection by RP5 (this table) were compared with values determined at 4 and 8 hpi for wt infection (Table 1).
The null hypothesis is that the true values for a given timepoint in the two infections are identical. The value 0.00 is used to indicatePvalues of⬍0.01.
12767
on November 8, 2019 by guest
http://jvi.asm.org/
TABLE 6. Abundance of HSV-1 transcripts following infection by RP5 virus grown in 16-8 cellsa
Transcript set Kinetic classand IDb
Abundance atc:
t-test value, RP5/16-8 vs wtd
2 hpi 4 hpi 8 hpi
Median SD % Median SD % Median SD % 2 hpi 4 hpi 8 hpi
RICP0 IE-1 11,220 12,980 22.0 19,520 7,630 4.5 76,190 1,590 3.0 0.74 0.70 0.44
U54 IE-2 1,960 5,240 3.9 11,440 3,410 2.6 38,230 15,900 1.5 0.22 0.36 0.82
RICP4 IE-3 6,520 10,400 12.8 12,930 3,430 3.0 39,130 17,350 1.5 0.27 0.40 0.37
R/S22 IE-4 6,050 11,040 11.9 28,540 10,280 6.5 81,750 3,380 3.2 0.85 0.32 0.53
U4-5ⴕ E-1 60 20 0.1 930 500 0.2 7,870 420 0.3 0.60 0.97 0.42 U4/5 E-2 620 510 1.2 8,210 1,910 1.9 60,560 580 2.4 0.17 0.87 0.52 U8/9 E-3 300 170 0.6 3,410 730 0.8 43,120 7,580 1.7 0.75 0.27 0.56 U8-5ⴕ E-4 30 100 0.1 80 120 0.0 1,420 990 0.1 0.18 0.20 0.25 U21 E-5 20 60 0.0 2,360 180 0.5 41,230 7,590 1.6 0.00 0.49 0.15 U23 E-6 170 270 0.3 11,450 2,940 2.6 22,340 4,050 0.9 0.17 0.44 0.18 U29 E-7 40 80 0.1 5,250 1,530 1.2 17,330 7,470 0.7 0.09 0.40 0.23 U30 E-8 390 610 0.8 15,740 6,220 3.6 30,010 13,430 1.2 0.30 0.58 0.70 U37 E-9 660 650 1.3 4,920 2,060 1.1 48,750 6,160 1.9 0.26 0.72 0.47
U39-5ⴕ E-10 120 160 0.2 5,440 2,800 1.2 25,070 14,630 1.0 0.45 0.44 0.73
U39/40 E-11 650 360 1.3 18,440 6,970 4.2 62,640 9,270 2.5 0.15 0.95 0.43
U42 E-12 730 620 1.4 18,010 4,640 4.1 92,800 12,530 3.6 0.34 0.60 0.32 U43 E-13 500 250 1.0 2,220 680 0.5 21,460 2,260 0.8 0.85 0.20 0.26 U50 E-14 230 70 0.5 11,860 1,120 2.7 45,440 17,540 1.8 0.92 0.75 0.47
U52-5ⴕ E-15 0 40 0.0 0 30 0.0 0 0 0.0 0.16 0.19 0.19
U55 E-16 60 80 0.1 1,670 180 0.4 26,620 10,480 1.0 0.08 0.15 0.40 U56 E-17 170 210 0.3 4,340 710 1.0 38,200 23,050 1.5 0.68 0.10 0.59 US2 E-18 670 900 1.3 3,050 1,580 0.7 67,210 9,780 2.6 0.65 0.69 0.29 U1 L-1 720 1,460 1.4 15,050 2,440 3.4 64,900 7,470 2.5 0.35 0.12 0.30 U3 L-2 250 70 0.5 3,560 1,560 0.8 60,180 6,970 2.4 0.18 0.75 0.70 U10 L-3 840 1,240 1.7 3,000 860 0.7 68,500 2,280 2.7 0.43 0.26 0.14
U16/17 L-4 60 120 0.1 2,190 410 0.5 43,110 12,450 1.7 0.07 0.33 0.41
U15 L-5 70 110 0.1 1,000 800 0.2 20,010 7,240 0.8 0.04 0.97 0.27
U18/20 L-6 70 90 0.1 13,140 660 3.0 57,670 15,980 2.3 0.26 0.11 0.45
U19/20 L-7 110 1,120 0.2 11,340 930 2.6 54,870 14,320 2.1 0.43 0.20 0.88
U19-5ⴕ L-8 10 80 0.0 70 90 0.0 990 1,020 0.0 0.16 0.20 0.19
U22 L-9 120 70 0.2 1,700 520 0.4 40,390 2,450 1.6 0.45 0.48 0.03 U24 L-10 100 170 0.2 2,300 170 0.5 30,540 4,790 1.2 0.07 0.09 0.40 U25 L-11 120 150 0.2 7,590 3,310 1.7 50,950 5,840 2.0 0.33 0.27 0.96
U27/8 L-12 290 350 0.6 11,800 2,970 2.7 39,840 9,960 1.6 0.24 0.43 0.69
U27-5ⴕ L-13 70 90 0.1 5,250 1,610 1.2 22,050 17,730 0.9 0.24 0.61 0.55
U31/34 L-14 300 430 0.6 3,260 1,450 0.7 39,320 2,710 1.5 0.66 0.72 0.19
U35 L-15 360 440 0.7 8,610 3,380 2.0 68,000 2,920 2.7 0.35 0.99 0.97 U38 L-16 1,100 600 2.2 2,350 1,660 0.5 73,970 2,860 2.9 0.36 0.69 0.53 U41 L-17 470 1,100 0.9 1,180 2,650 0.3 45,320 660 1.8 0.33 0.57 0.60
U44-5ⴕ L-18 60 130 0.1 810 470 0.2 24,850 12,210 1.0 0.24 0.39 0.70
U44/45 L-19 660 290 1.3 13,590 3,650 3.1 77,290 1,240 3.0 0.72 0.93 0.91
U46/47 L-20 410 680 0.8 11,220 1,280 2.6 54,760 16,730 2.1 0.16 0.24 0.84
U48 L-21 110 120 0.2 1,200 480 0.3 12,520 3,820 0.5 0.25 0.00 0.08 U51 L-22 200 430 0.4 2,730 600 0.6 48,010 14,060 1.9 0.13 0.02 0.39 RLXY L-23 260 1,490 0.5 2,020 1,010 0.5 45,680 3,130 1.8 0.39 0.78 0.54 RLX L-24 1,070 1,610 2.1 2,050 490 0.5 39,220 5,800 1.5 0.43 0.10 0.03
RICP34.5 L-25 160 90 0.3 1,280 310 0.3 10,900 880 0.4 0.26 0.11 0.42
US5-5ⴕ L-26 10 240 0.0 0 90 0.0 0 0 0.0 0.16 0.19 0.18
US8-5ⴕ L-27 50 260 0.1 330 210 0.1 3,980 2,260 0.2 0.16 0.20 0.23
US8/9 L-28 1,260 1,550 2.5 21,560 6,110 4.9 67,640 1,820 2.6 0.66 0.32 0.12
RLAT-5ⴕ LT-1 20 100 0.0 0 10 0.0 5,000 3,630 0.2 0.19 0.19 0.40
RHA6 LT-2 380 1,000 0.7 1,580 1,270 0.4 16,050 3,750 0.6 0.44 0.40 0.83
RLATX LT-3 360 2,870 0.7 90 90 0.0 22,420 15,630 0.9 0.46 0.21 0.56
RLAT-3ⴕ LT-4 290 460 0.6 620 80 0.1 34,490 17,560 1.3 0.34 0.09 0.50
UIX ? 330 1,410 0.6 1,600 1,230 0.4 9,690 3,280 0.4 0.40 0.41 0.23 U6/7 L/? 590 610 1.1 5,520 1,320 1.3 69,070 4,790 2.7 0.09 0.52 0.54 U11/13 L/E/L 430 830 0.8 15,430 2,450 3.5 64,810 4,330 2.5 0.34 0.24 0.45 U36 E/L 500 700 1.0 3,140 1,710 0.7 53,710 6,950 2.1 0.33 0.83 0.29
U43.5-5⬘ ? 20 90 0.0 0 40 0.0 90 130 0.0 0.19 0.31 0.37
U49 E/L 320 270 0.6 11,550 3,110 2.6 37,000 5,730 1.4 0.09 0.82 0.19 U52/53 E/L 150 190 0.3 4,100 860 0.9 37,030 12,820 1.4 0.08 0.02 0.51
RLAT-1 LAT 40 100 0.1 0 20 0.0 3,520 740 0.1 0.18 0.19 0.59
ROP ? 50 120 0.1 0 40 0.0 290 190 0.0 0.11 0.20 0.07
US3-5⬘ L? 60 180 0.1 450 210 0.1 0 0 0.0 0.15 0.21 0.18
US3/4 E/L? 590 730 1.2 12,540 2,260 2.9 6,480 330 0.3 0.61 0.80 0.16 US5/6/7 EL/E/E 1,260 1,750 2.5 18,790 6,750 4.3 66,540 15,940 2.6 0.66 0.11 0.96 US10/11/12 E/E/IE 5,110 8,820 10.0 21,630 8,230 4.9 75,830 11,280 3.0 0.81 0.33 0.85
Total 50,950 437,060 2,554,860
aHeLa cells were infected at an MOI of 5 PFU per cell using RP5 virus grown in the complementing cell line 16-8. Bold entries represent either single transcripts
or multiple transcripts of the same kinetic class.
bSee Table 1, footnoteb.
cMedian values are based on three, three, and two separate experiments at 2, 4, and 8 hpi, respectively.
dRelative values for each transcript at each time point during RP5/16-8 infection were compared with values for wt infection (Table 1) by using Student’s two-tailed ttest assuming unequal variance. The value 0.00 is used to indicate aPvalue of⬍0.01.
12768
on November 8, 2019 by guest
http://jvi.asm.org/
TABLE 7. Abundance of HSV-1 transcripts at 2 h after infection of HeLa cells treated with cycloheximidea
Transcript set Kinetic classand IDb
Abundance
RP5 RP5 (16-8)
Medianc SD % Mediand SD %
RICP0 IE-1 11,930 3,080 5.1 104,140 23,580 24.2
U54 IE-2 1,250 740 0.5 26,880 7,680 6.2
RICP4 IE-3 39,970 13,250 17.2 82,180 45,810 19.1
R/S22 IE-4 3,650 2,230 1.6 69,390 36,500 16.1
US10/11/12 E/E/IEe 3,950 1,390 1.7 55,850 16,870 13.0
U4/5 E-2 9,110 1,850 3.9 2,780 640 0.6
U8/9 E-3 2,610 650 1.1 1,230 280 0.3
U21 E-5 820 90 0.4 900 390 0.2
U23 E-6 5,070 1,110 2.2 1,280 280 0.3
U29 E-7 410 630 0.2 1,590 890 0.4
U30 E-8 2,010 500 0.9 2,370 1,390 0.6
U37 E-9 630 450 0.3 2,630 1,070 0.6
U39/40 E-11 870 130 0.4 3,490 930 0.8
U42 E-12 2,030 840 0.9 2,530 700 0.6
U43 E-13 5,750 820 2.5 3,370 1,560 0.8
U50 E-14 2,910 660 1.3 1,290 410 0.3
U55 E-16 410 250 0.2 1,310 370 0.3
U56 E-17 3,170 720 1.4 1,860 900 0.4
US2 E-18 1,340 300 0.6 2,810 1,990 0.7
U1 L-1 560 480 0.2 1,550 710 0.4
U3 L-2 700 180 0.3 1,690 460 0.4
U10 L-3 4,580 760 2.0 1,280 990 0.3
U16/17 L-4 2,550 760 1.1 1,610 600 0.4
U15 L-5 1,680 840 0.7 1,350 450 0.3
U18/20 L-6 530 320 0.2 1,270 480 0.3
U19/20 L-7 1,320 820 0.6 1,400 580 0.3
U22 L-9 360 190 0.2 1,520 660 0.4
U24 L-10 2,760 920 1.2 1,040 350 0.2
U25 L-11 1,670 520 0.7 1,100 420 0.3
U27/8 L-12 3,000 920 1.3 1,350 570 0.3
U31/34 L-14 2,100 640 0.9 2,180 550 0.5
U35 L-15 1,830 500 0.8 2,190 770 0.5
U38 L-16 4,160 1,240 1.8 2,250 480 0.5
U41 L-17 50 100 0.0 2,060 630 0.5
U44/45 L-19 5,090 1,550 2.2 2,050 810 0.5
U46/47 L-20 24,490 3,540 10.5 3,610 1,590 0.8
U48 L-21 1,050 450 0.5 1,750 810 0.4
U51 L-22 18,580 4,900 8.0 2,060 620 0.5
RLXY L-23 250 130 0.1 1,220 1,160 0.3
RLX L-24 16,640 3,260 7.2 1,850 4,570 0.4
RICP34.5 L-25 3,370 300 1.5 2,330 1,050 0.5
US8/9 L-28 3,590 1,520 1.5 2,410 860 0.6
RHA6 LT-2 2,240 740 1.0 2,350 2,090 0.5
RLAT-3⬘ LT-4 14,220 6,440 6.1 2,690 550 0.6
UIX 390 430 0.2 1,290 320 0.3
U6/7 6,110 1,670 2.6 3,310 180 0.8
U11/13 640 320 0.3 1,420 450 0.3
U36 310 330 0.1 2,600 840 0.6
U49 2,850 2,380 1.2 1,280 450 0.3
U52/53 2,680 1,080 1.2 2,170 720 0.5
US3/4 1,420 360 0.6 2,060 780 0.5
US5/6/7 2,600 1,250 1.1 2,230 430 0.5
Total 232,260 430,400
aHeLa cells were infected with equivalent virion numbers of either RP5 virus grown in Vero cells (at 0.05 PFU/cell) or RP5 virus grown in VP16-expressing 16-8
cells (at 5 PFU/cell). Cycloheximide (60g/ml) was present in culture media starting 2 h prior to infection. RNA was harvested at 2 hpi. Bold entries represent probes for IE transcripts.
bSee Table 1, footnoteb.
cMedian values are based upon four separate experiments. All signals were determined at a laser power of 90 with a photomultiplier at 85%.
dMedian values are based upon four separate experiments. All signals were determined at a laser power of 80 with a photomultiplier at 75. These values were then
multiplied by 8 to allow direct comparison with the values for the RP5 infection alone (see the text) (33).
eAlthough this probe nominally detects transcripts from several genes of different kinetic classes, the signal at IE times arises predominantly from the US12 (ICP47)
gene.
VOL. 76, 2002 MICROARRAY ANALYSIS OF HSV-1 VP16 ACTIVATION MUTANTS 12769
on November 8, 2019 by guest
http://jvi.asm.org/
TABLE 8. Abundance of HSV-1 transcripts at various times following infection of HeLa cells with RP3 or RP4 virus a Transcript set Kinetic class and ID b Abundance % RP3 vs % RP4 c Infection by RP3 Infection by RP4 2 hpi 4 hpi 8 hpi 2 hpi 4 hpi 8 hpi Median SD % Median SD % Median SD % Median SD % Median SD % Median SD % 2 hpi 4 hpi 8 hpi RICP0 IE-1 34,380 27,220 13.4 21,780 12,930 2.2 15,560 4,720 1.4 320 540 1.0 1,010 480 0.7 4,970 1,140 1.1 0.00 0.00 0.32 U54 IE-2 14,610 29,530 5.7 91,290 65,700 9.1 19,290 3,070 1.7 220 90 0.7 7,110 3,800 4.7 8,310 2,120 1.8 0.04 0.10 0.50 RICP4 IE-3 58,490 30,190 22.8 44,550 25,330 4.4 11,730 6,170 1.0 7,070 3,080 21.1 6,580 2,480 4.4 5,370 1,730 1.2 0.36 0.73 0.96 R/S22 IE-4 14,420 31,680 5.6 66,120 37,570 6.6 32,250 5,070 2.8 510 280 1.5 5,520 1,160 3.7 11,920 2,740 2.6 0.03 0.00 0.20 U4-5 ⴕ E-1 450 190 0.2 5,470 2,360 0.5 7,180 3,000 0.6 210 620 0.6 1,110 180 0.7 1,990 1,100 0.4 0.20 0.11 0.68 U4/5 E-2 8,290 4,340 3.2 14,180 7,170 1.4 19,850 6,180 1.7 890 450 2.7 3,350 1,110 2.2 7,800 3,260 1.7 0.69 0.14 0.89 U8/9 E-3 840 370 0.3 6,060 2,470 0.6 9,440 5,480 0.8 370 390 1.1 1,100 220 0.7 3,000 1,440 0.6 0.08 0.25 0.57 U8-5 ⴕ E-4 2,380 970 0.9 4,510 2,160 0.4 5,590 1,840 0.5 1,300 650 3.9 980 280 0.6 1,690 930 0.4 0.02 0.39 0.86 U21 E-5 330 160 0.1 2,890 1,790 0.3 13,080 2,820 1.1 30 70 0.1 510 210 0.3 4,850 1,180 1.0 0.67 0.46 0.96 U23 E-6 2,770 1,820 1.1 37,180 25,550 3.7 14,610 5,940 1.3 340 180 1.0 5,550 1,200 3.7 5,900 4,590 1.3 0.13 0.22 0.37 U29 E-7 660 300 0.3 21,030 11,940 2.1 15,840 5,590 1.4 0 70 0.0 3,760 1,570 2.5 8,050 3,160 1.7 0.11 0.83 0.74 U30 E-8 1,760 840 0.7 16,980 4,830 1.7 11,650 4,590 1.0 220 330 0.7 3,820 860 2.5 4,160 1,440 0.9 0.34 0.00 0.53 U37 E-9 280 140 0.1 4,200 2,230 0.4 11,360 6,180 1.0 140 230 0.4 530 180 0.4 4,460 1,360 1.0 0.14 0.69 0.47 U39-5 ⴕ E-10 1,370 630 0.5 26,410 9,300 2.6 21,850 1,830 1.9 160 90 0.5 5,850 1,800 3.9 10,580 3,550 2.3 0.66 0.06 0.41 U39/40 E-11 1,360 750 0.5 41,560 9,980 4.1 26,890 4,010 2.3 260 150 0.8 6,630 2,440 4.4 12,780 3,310 2.7 0.13 0.17 0.43 U42 E-12 1,280 220 0.5 25,500 3,190 2.5 35,930 3,550 3.1 250 210 0.7 3,940 660 2.6 12,470 2,350 2.7 0.63 0.77 0.12 U43 E-13 3,090 740 1.2 3,900 1,570 0.4 4,550 6,050 0.4 1,070 570 3.2 780 270 0.5 1,120 980 0.2 0.03 0.16 0.41 U50 E-14 1,480 450 0.6 28,180 8,820 2.8 25,800 6,390 2.2 280 610 0.8 4,340 1,120 2.9 11,160 2,990 2.4 0.29 0.50 0.74 U52-5 ⴕ E-15 870 1,800 0.3 3,420 2,710 0.3 560 660 0.0 200 150 0.6 220 310 0.1 230 170 0.0 0.75 0.13 0.98 U55 E-16 290 160 0.1 5,550 3,890 0.6 8,300 5,170 0.7 0 20 0.0 1,180 500 0.8 3,460 2,180 0.7 0.04 0.90 0.98 U56 E-17 1,530 1,130 0.6 8,370 6,810 0.8 12,680 5,690 1.1 250 130 0.7 1,550 490 1.0 5,440 3,330 1.2 0.74 0.65 0.46 US2 E-18 1,410 450 0.6 3,750 2,970 0.4 32,200 7,130 2.8 220 240 0.7 1,210 380 0.8 9,410 1,960 2.0 0.44 0.03 0.04 U1 L-1 940 1,060 0.4 22,140 12,220 2.2 19,910 5,200 1.7 170 100 0.5 2,640 1,230 1.7 9,820 5,050 2.1 0.68 0.63 0.32 U3 L-2 280 150 0.1 2,680 1,920 0.3 14,400 6,020 1.3 110 350 0.3 360 200 0.2 5,880 3,110 1.3 0.18 0.64 0.70 U10 L-3 1,670 670 0.7 5,830 3,910 0.6 24,100 4,960 2.1 370 230 1.1 1,000 720 0.7 9,830 3,410 2.1 0.13 0.46 0.99 U16/17 L-4 1,480 500 0.6 5,810 3,130 0.6 16,670 2,800 1.5 400 230 1.2 1,070 310 0.7 6,250 1,480 1.3 0.08 0.76 0.36 U15 L-5 780 280 0.3 1,440 1,870 0.1 6,690 2,760 0.6 360 300 1.1 250 210 0.2 2,240 1,820 0.5 0.08 0.90 0.89 U18/20 L-6 270 130 0.1 15,410 6,920 1.5 31,520 23,200 2.7 0 70 0.0 2,850 980 1.9 13,560 4,150 2.9 0.85 0.59 0.65 U19/20 L-7 930 210 0.4 10,690 6,970 1.1 33,360 22,220 2.9 140 370 0.4 3,970 1,100 2.6 12,820 4,220 2.8 0.32 0.04 0.46 U19-5 ⴕ L-8 2,040 690 0.8 5,410 4,600 0.5 14,100 4,090 1.2 350 480 1.0 1,060 580 0.7 3,650 1,250 0.8 0.36 0.58 0.48 U22 L-9 210 140 0.1 4,320 3,090 0.4 22,670 3,470 2.0 60 40 0.2 610 240 0.4 5,460 2,020 1.2 0.12 0.92 0.04 U24 L-10 720 320 0.3 6,190 2,890 0.6 20,710 3,770 1.8 20 100 0.1 1,690 600 1.1 7,760 1,220 1.7 0.27 0.01 0.96 U25 L-11 740 190 0.3 18,180 6,010 1.8 32,310 20,880 2.8 80 200 0.2 3,100 890 2.0 12,770 3,500 2.7 0.56 0.74 0.55 U27/28 L-12 2,500 570 1.0 32,810 10,760 3.3 28,170 2,280 2.5 530 370 1.6 5,380 700 3.6 11,490 860 2.5 0.14 0.91 0.60 U27-5 ⴕ L-13 1,280 490 0.5 28,950 14,040 2.9 28,330 2,950 2.5 190 90 0.6 3,960 1,070 2.6 12,200 1,510 2.6 0.63 0.17 0.27 U31/34 L-14 980 780 0.4 5,620 1,930 0.6 19,620 6,520 1.7 340 220 1.0 540 390 0.4 4,950 1,880 1.1 0.06 0.81 0.26 U35 L-15 1,130 190 0.4 12,270 3,280 1.2 28,660 3,810 2.5 290 290 0.9 1,260 340 0.8 8,780 2,980 1.9 0.24 0.13 0.61 U38 L-16 1,720 710 0.7 4,460 2,690 0.4 21,530 6,230 1.9 480 410 1.4 840 470 0.6 7,620 2,680 1.6 0.11 0.45 0.37 U41 L-17 90 90 0.0 1,710 1,600 0.2 13,950 6,080 1.2 50 70 0.1 200 90 0.1 3,270 2,770 0.7 0.10 0.27 0.54 U44-5 ⴕ L-18 1,330 650 0.5 4,670 2,970 0.5 29,200 26,940 2.5 260 120 0.8 1,460 440 1.0 12,610 4,420 2.7 0.76 0.03 0.86 U44/45 L-19 2,350 480 0.9 17,420 4,000 1.7 32,830 10,510 2.9 930 430 2.8 2,810 290 1.9 13,620 2,920 2.9 0.02 0.39 0.56 U46/47 L-20 10,500 2,700 4.1 26,870 15,430 2.7 37,800 17,800 3.3 1,970 1,350 5.9 5,480 980 3.6 15,340 3,790 3.3 0.39 0.13 0.87 U48 L-21 300 140 0.1 4,330 1,740 0.4 10,550 4,940 0.9 100 140 0.3 2,400 1,070 1.6 18,340 8,100 3.9 0.26 0.00 0.01 U51 L-22 4,510 1,520 1.8 8,280 3,040 0.8 21,320 3,110 1.9 1,080 1,130 3.2 1,410 530 0.9 7,180 2,940 1.5 0.12 0.19 0.64 RLXY L-23 140 100 0.1 1,600 1,470 0.2 9,540 2,630 0.8 120 210 0.4 80 100 0.1 4,730 1,990 1.0 0.18 0.01 0.90 RLX L-24 7,670 1,650 3.0 7,560 5,410 0.8 11,410 5,970 1.0 1,620 1,500 4.8 1,620 700 1.1 4,360 1,790 0.9 0.09 0.33 0.90 RICP34.5 L-25 2,460 610 1.0 5,310 3,300 0.5 3,630 1,200 0.3 350 290 1.0 560 190 0.4 940 710 0.2 0.91 0.22 0.99
12770 YANG ET AL. J. VIROL.