Copyright © 2002, American Society for Microbiology. All Rights Reserved.
Human Immunodeficiency Virus Type 1 (HIV-1)-Specific CD8
⫹
-T-Cell
Responses for Groups of HIV-1-Infected Individuals with Different
HLA-B*35 Genotypes
Xia Jin,
1* Xiaojiang Gao,
2Murugappan Ramanathan, Jr.,
3Geoffrey R. Deschenes,
3George W. Nelson,
2Stephen J. O’Brien,
4James J. Goedert,
5David D. Ho,
3Thomas R. O’Brien,
5and Mary Carrington
2University of Rochester Medical Center, Rochester, New York 146421; Intramural Research Support Program, SAIC,2and Laboratory of Genomic Diversity,4NCI—Frederick, Frederick, Maryland 21702; Aaron Diamond AIDS Research
Center, New York, New York 100213; and Viral Epidemiology Branch, Division of Cancer Epidemiology and Genetics, National Cancer Institute, Rockville, Maryland 208525
Received 3 May 2002/Accepted 29 August 2002
Human immunodeficiency virus type 1 (HIV-1)-infected individuals with HLA-B*35 allelic variants B*3502/ 3503/3504/5301 (B*35-Px) progress more rapidly to AIDS than do those with B*3501 (B*35-PY). The mecha-nisms responsible for this phenomenon are not clear. To examine whether cellular immune responses may differ according to HLA-B*35 genotype, we quantified HIV-1-specific CD8ⴙ-T-cell (CTL) responses using an
intracellular cytokine-staining assay with specimens from 32 HIV-1-positive individuals who have B*35 alleles. Among them, 75% had CTL responses to Pol, 69% had CTL responses to Gag, 50% had CTL responses to Nef, and 41% had CTL responses to Env. The overall magnitude of CTL responses did not differ between patients bearing B*35-Px genotypes and those bearing B*35-PY genotypes. A higher percentage of Gag-specific CTL was associated with lower HIV-1 RNA levels (P ⴝ 0.009) in individuals with B*35-PY. A negative association between CTL activity for each of the four HIV antigens and viral load was observed among individuals with B*35-PY, and the association reached significance for Gag. No significant relationship between CTL activity and viral load was observed in the B*35-Px group. The relationship between total CTL activity and HIV RNA among B*35-Px carriers differed significantly from that among B*35-PY carriers (P < 0.05). The data are consistent with the hypothesis that higher levels of virus-specific CTL contribute to protection against HIV disease progression in infected individuals with B*35-PY, but not in those with B*35-Px.
Associations between major histocompatibility complex (MHC) class I genotype and disease have been studied in many models (29). While most of these studies have involved auto-immune diseases, several associations have been consistently identified with infectious diseases. HLA-B*35 has a codomi-nant susceptibility effect on the rate of progression to AIDS after human immunodeficiency virus type 1 (HIV-1) infection (7, 22). In contrast, HLA-B*27 is associated with slower dis-ease progression (17, 36), and B*5701 is overrepresented in long-term nonprogressors (LTNPs) (16, 31). B*27 and B*57 carriers also had the strongest responses by cytotoxic T-lym-phocytes (CTL) in recipients of candidate HIV vaccines (23). Our recent study indicates that the HLA-B*35/53 subtypes B*3502, B*3503, B*3504, and B*5301 (termed B*35-Px) cor-relate more strongly with rapid HIV-1 disease progression than does the common Caucasian and African-American subtype, B*3501 (termed B*35-PY) (14). The mechanisms responsible for MHC class I association with HIV disease progression are not known. It is well documented that MHC class I-mediated antigen presentation determines the magnitude of a CTL re-sponse, and CTL response is crucial in protection against viral infections (20). However, an association between resistance to
HIV-1 infection and recognition of CTL epitopes distinct from those targeted in HIV⫹individuals with the same HLA types has been reported, suggesting that there are significant quali-tative differences in CTL responses against HIV-1 (24).
The magnitude, breadth, specificity, and avidity of a CTL response may all contribute to the control of HIV viremia levels. The importance of a high-magnitude CTL response has been described in numerous reports (6, 25, 35, 37). HIV-spe-cific CTL frequencies are strong in patients with high CD4 counts and during earlier stages of infection, whereas they are often low in later stages of infection, particularly when pa-tients’ clinical situations deteriorate (6, 25). Further, HIV-infected LTNPs were shown to have higher CTL frequencies than those who progressed to AIDS (37), and an inverse as-sociation between CTL numbers and viremia levels has been also been observed (4, 9, 11, 18, 32, 35, 38). Nevertheless, recent data have indicated that not all CTL responses are equal and that rather than quantity, the quality of the CTL response may be most important in control of viral load and AIDS progression (2, 3, 31). Because of the importance of CTL in conferring protection, it is conceivable that the class I loci may affect rate of progression to AIDS through a number of mechanisms.
On average, individuals homozygous at class I loci present a more limited range of CTL epitopes than do heterozygous individuals. Thus, viral escape mutants may arise more quickly in homozygotes, leading to dissemination of the virus and
ear-* Corresponding author. Mailing address: Infectious Disease Unit, University of Rochester Medical Center, 601 Elmwood Ave., Box 689, Rochester, NY 14642. Phone: (716) 275-6515. Fax: (716) 442-9328. E-mail: [email protected].
12603
on November 8, 2019 by guest
http://jvi.asm.org/
lier onset of disease. Genetic data support this model for involvement of HLA and CTL in progression to AIDS (7). It is also reasonable to expect that HLA class I genotypes vary in the degree to which they induce a protective CTL response and that a range of responses from weak to strong occurs depend-ing on genotype. This in turn will affect how rapidly one de-velops disease. Alternatively, unknown host genes associated with class I loci may be responsible for the different rates of HIV-1 progression.
We hypothesize that HIV-1-specific CTL responses are stronger (quantitatively and/or qualitatively) in B*35-PY than in B*35-Px positive individuals. Here, a potential correlation between the frequency of HIV-specific CTL and viral load was tested, addressing whether quantity of specific CTL might ex-plain to some degree the epidemiological difference between these groups.
MATERIALS AND METHODS
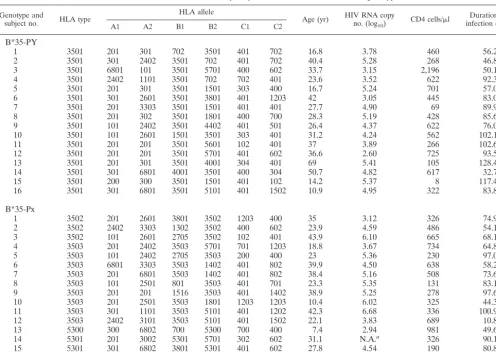
Patients.Thirty-two individuals were selected from either the Multicenter Hemophilia Cohort Study or a cohort of homosexual men from New York City and Washington, D.C. (33, 34). The duration of infection at the time of blood draw ranged from 10.8 to 128.4 months in these patients, their CD4 counts
ranged from 8 to 2,194 perl, and baseline viremia levels ranged from 428 to
4,810,940 HIV-1 RNA copies/ml. All blood samples were collected prior to any antiretroviral treatment. All subjects have known subtypes of B*35/53 (Table 1).
These subtypes have been classified as B*35-PY (B*3501), or B*35-Px (B*3502, B*3503, or B*5301) previously, based on their epitope preference (14).
HIV-1 viral load measurement.HIV-1 RNA levels were quantified using the Amplicor HIV-1 Monitor assay (Roche Molecular Systems, Branchburg, N.J.), which has a detection limit of 200 HIV-1 RNA copies/ml. The HIV-1 RNA levels
in study subjects were expressed as log10HIV-1 RNA copies/ml.
HLA typing.Genomic DNA was isolated from patients’ lymphoblastoid B-cell lines and amplified with a panel of 96 sequence-specific primers for HLA-A, -B, and -C. PCR products were electrophoresed on agarose gels containing ethidium bromide, and predicted size products were visualized under UV light. Finer typing for B*35-related subtypes was achieved by direct sequencing of the PCR products with the ABI Big Dye terminator cycle sequencing ready reaction kit (Applied Biosystems Division/Perkin-Elmer, Foster City, Calif.). Primers in the first and third introns of HLA-A, -B, and -C were used for locus-specific ampli-fication of exons 2 and 3. The amplified products were subjected to cycle se-quencing in both orientations. The samples were then run on an ABI 377 sequencer (Applied Biosystems Division/Perkin-Elmer), and the sequences were analyzed with the Match Tools and MT navigator allele identification software (Applied Biosystems Division/Perkin-Elmer).
ICS.The intracellular cytokine staining (ICS) assay has been used for
mea-suring HIV-specific CTL responses by several groups (3, 21, 31). There are, however, major differences in ways by which the cells are stimulated. We use HIV expressing recombinant vaccinia virus-infected autologous
antigen-presenting cells to stimulate a CD8⫹T-cell response (21), while others use either
overlapping HIV peptides (3) or recombinant vaccinia virus-infected
B-lympho-blastoid cells (31). Briefly, an aliquot of 0.5⫻106to 1⫻106cryopreserved
peripheral blood mononuclear cells (PBMC) from each patient was infected with recombinant vaccinia virus expressing B-clade HIV-1 Env, Gag, Pol, Nef, or control Eco antigens (Virogenetics, Troy, N.Y.) at a multiplicity of infection of
8 3501 201 302 3501 1801 400 700 28.3 5.19 428 85.6
9 3501 101 2402 3501 4402 401 501 26.4 4.37 622 76.0
10 3501 101 2601 1501 3501 303 401 31.2 4.24 562 102.1
11 3501 201 201 3501 5601 102 401 37 3.89 266 102.6
12 3501 201 201 3501 5701 401 602 36.6 2.60 725 93.5
13 3501 201 301 3501 4001 304 401 69 5.41 105 128.4
14 3501 301 6801 4001 3501 400 304 50.7 4.82 617 32.7
15 3501 200 300 3501 1501 401 102 14.2 5.37 8 117.4
16 3501 301 6801 3501 5101 401 1502 10.9 4.95 322 83.8
B*35-Px
1 3502 201 2601 3801 3502 1203 400 35 3.12 326 74.9
2 3502 2402 3303 1302 3502 400 602 23.9 4.59 486 54.1
3 3502 101 2601 2705 3502 102 401 43.9 6.10 665 68.1
4 3503 201 2402 3503 5701 701 1203 18.8 3.67 734 64.8
5 3503 101 2402 2705 3503 200 400 23 5.36 230 97.0
6 3503 6801 3303 3503 1402 401 802 39.9 4.50 638 58.2
7 3503 201 6801 3503 1402 401 802 38.4 5.16 508 73.6
8 3503 101 2501 801 3503 401 701 23.3 5.35 131 83.1
9 3503 201 201 1516 3503 401 1402 38.9 5.25 278 97.6
10 3503 201 2501 3503 1801 1203 1203 10.4 6.02 325 44.3
11 3503 301 1101 3503 5101 401 1202 42.3 6.68 336 100.9
12 3503 2402 3101 3503 5101 401 1502 22.1 3.83 689 10.8
13 5300 300 6802 700 5300 700 400 7.4 2.94 981 49.6
14 5301 201 3002 5301 5701 302 602 31.1 N.A.a 326 90.1
15 5301 301 6802 3801 5301 401 602 27.8 4.54 190 80.8
16 5301 201 6802 5301 5101 401 1402 22.3 5.30 374 111.4
aInformation not available.
on November 8, 2019 by guest
http://jvi.asm.org/
[image:2.603.46.543.79.432.2]2 for 20 to 22 h at 37°C. Brefeldin A (10g/ml; Golgiplug; PharMingen, San Diego, Calif.) was added during the last 5 h of incubation. The cells were stained with anti-CD3PE, -CD4APC, -CD8PerCP in the pilot experiment as previously described (21) and with anti-CD69PE, -CD3APC, -CD8PerCP (Becton Dickin-son, San Jose, Calif.) antibodies for 30 min at 4°C in the main experiment presented in Fig. 3 and 4. After washing and permeabilization with CytoFix/ Cytoperm solution (PharMingen), the cells were stained intracellularly by
an anti-gamma interferon (anti-IFN-␥) fluorescein isothiocyanate antibody
(PharMingen) before being analyzed using a FACScalibur flow cytometer. The fluorescence-activated cell sorter data were analyzed with CellQuest software by
gating on small CD3⫹CD4⫺T cells first, followed by displaying CD69 versus
IFN-␥staining. Stimulation by a 5-g/ml concentration of a superantigen,
staph-ylococcal enterotoxin B (SEB), was used as a positive control in all assays. Only
samples containing at least 1% of IFN-␥-producing CD8⫹T cells, after SEB
stimulation, were included in the final calculations. All experimental results were
expressed as a percentage of IFN-␥-producing CD8⫹T cells, with the
back-ground IFN-␥production from control samples subtracted. When stimulated
with control antigens, we detected little IFN-␥production from CD8⫹T cells
(0.02% to 0.03%,n⫽195) (21) and therefore contend that the assay sensitivity
is sufficient and variation is minimal.
Data analysis.To assess whether CTL levels affected HIV RNA levels among individuals carrying B*35-Px or those carrying B*35-PY, we performed a linear regression analysis for each genotype. To examine if the effect of CTL levels differed by genotype, we created homogeneity-of-slopes models that compared the relationship between CTL and HIV RNA among B*35-Px carriers to that among B*35-PY carriers. These analyses were performed using the PROC GLM program in the SAS package (6.12 ed.; SAS Institute, Cary, N.C.). The interval from seroconversion to the time of the blood draw, from which both the CTL and viral load measurements were taken, was considered to be a confounding
co-variate in both analyses. Relative hazard (RH) andPvalues in the survival
analysis were calculated by Cox model analysis (10).
RESULTS
Rate of progression to AIDS among individuals with B*35-Px versus B*35-PY.To confirm that the survival advan-tage of B*35-PY over -Px was true in this smaller set of
pa-tients, we compared the survival times of 16 B*35-Px and 16 B*35-PY patients. The B*35-PY group had a significantly longer survival time for the outcome AIDS 1993 (8a) (RH⫽
3.4;P⫽0.04) (Fig. 1), but not for the later outcomes AIDS 1987 ( 8b) (RH⫽1.6;P⫽0.48) or AIDS-related death (RH⫽
1.03;P⫽0.97) (data not shown). Although the sample size is small, the results were generally consistent with the previously observed results (14). The results for AIDS 1993 correspond to a median time to AIDS that is 3 years longer for the B*35-PY subjects than for the B*35-Px subjects.
Detection of HIV-1-specific CTL using the ICS assay. To assess the percentage of antigen-specific CD8⫹ T cells, we developed an assay to quantify, at the single-cell level, the number of cells capable of producing IFN-␥after stimulation with HIV-1 antigens (21). This ICS assay is similar to those described previously (3, 31), differing primarily in the protocol used to stimulate the CTL (see Materials and Methods). An example of a pilot experiment using this method is illustrated in Fig. 2, where aliquots of cryopreserved PBMC from one HIV-1-infected patient were simulated with recombinant vac-cinia virus expressing HIV-1 Env, Gag, Pol, Nef, or control Eco antigens. The percentage of IFN-␥-producing CD8⫹T cells was enumerated as described in the Materials and Methods. In this sample, a background percentage of IFN-␥-producing cells (0.03%) was detected when stimulated with the negative con-trol antigen Eco, and 5.74% CD8⫹T cells produced IFN-␥ after simulation with the positive control SEB. As expected, HIV-1 antigens activated various percentages of CD8⫹T cells. Gag, Nef, and Pol stimulated 0.93, 0.17, and 0.06% CD8⫹T cells, respectively, whereas Env did not activate enough CTL to be detectable. Because these percentages fall within the
nor-FIG. 1. Survival analysis of B*35-Px- and B*35-PY-positive individuals free of AIDS. Data for 16 B*35-Px individuals were compared with data for 16 B*35-PY individuals. RH andPwere calculated by Cox model analyses.
on November 8, 2019 by guest
http://jvi.asm.org/
mal range of the frequency of HIV-specific CTL as reported by most investigators (30), we proceeded to quantify the HIV-1-specific CTL in patients bearing different HLA-B*35 subtypes.
Lack of an overall quantitative difference in HIV-1-specific CTL responses between the B*35-Px and -PY groups. The rapid rate of progression to AIDS among individuals with HLA-B*35-Px relative to those with B*35-PY could be ex-plained by quantitative and/or qualitative differences in CTL activity. The frequency of CTL specific for each of the four HIV antigens was measured to determine whether a gross quantitative difference in CTL could account for the observed genetic effects. All individuals selected in this study were het-erozygous at the HLA-B locus, and all but five individuals were heterozygous at HLA-A and -C (three were homozygous at HLA-A and two were homozygous at HLA-C [Table 1]). Thus, CTL restricted by at least five different HLA types would be
expected to contribute to the total CTL measured for each antigen. Both the B*35-Px and -PY groups showed CD8⫹ -T-cell responses to various HIV-1 antigens, as illustrated in Fig. 3, and the level of response to HIV-1 antigens did not differ between the B*35-Px and B*35-PY groups. Among the 32 patients studied, 75% had CTL responses to Pol, 69% had CTL responses to Gag, 50% had CTL responses to Nef, and 41% had CTL responses to Env (Fig. 3). The magnitude of these responses was variable according to antigens tested. The strongest responses were to Gag and Pol, with a mean of 0.25%
[image:4.603.108.479.67.481.2]⫹ 0.34% (ranging from 0.00 to 1.45%) and 0.30%⫾ 0.39% (ranging from 0.00 to 1.72%), respectively. Weaker responses to Nef (0.10% ⫾ 0.21%) and Env (0.07% ⫾ 0.09%) were observed. The data suggest that CTL responses restricted by all HLA alleles may not differ significantly between the B*35-Px and -PY groups, although statistical power issues in the data
FIG. 2. Quantifying HIV-1-specific CD8⫹T cells by intracellular cytokine staining. Aliquots of PBMC from one HIV-1-infected individual were stimulated by recombinant vaccinia virus expressing negative control Eco, HIV-1 antigens (Env, Gag, Pol, and Nef), and positive control SEB first, followed by staining with anti-CD3, -CD4, -CD8, and -IFN-␥antibodies. The antigen-specific CD8⫹T cells were enumerated and expressed as a percentage, shown on the upper right quadrant of each plot. FITC, fluorescein isothiocyanate.
on November 8, 2019 by guest
http://jvi.asm.org/
set may hinder our ability to detect small differences. If other quantitative CTL differences between the B*35-Px and -PY groups were responsible for the observed disparity between these groups, then among the four major HIV antigens exam-ined, they should be most evident in the response against Gag and Pol since responses to these antigens were stronger than those against Nef and Env in our data set.
Small differences in association of CTL quantity with viral load in the B*35 subgroups. Individuals with one copy of HLA-B*35-Px progress to AIDS significantly faster than those who are homozygous for other alleles at the HLA-B locus (8), suggesting that HLA-B*35-Px may interact with HIV in a man-ner that results in an actively negative phenotype, rather than simply as a null allele. Based on these epidemiological findings, we propose that higher CTL numbers may not control virus in individuals with B*35-Px relative to those with other HLA-B types, because CTL restricted by individuals with B*35-Px may actually contribute to the susceptibility observed. On the other hand, higher CTL percentages might be expected to be asso-ciated with better viral control in the B*35-PY group, since CTL restricted by B*35-PY should be relatively protective. To test this hypothesis, we determined whether the frequency of CTL specific for each HIV antigen was associated with viral load in the B*35-Px and -PY groups.
For individuals with B*35-PY alleles, higher percentages of CTL specific for each of the HIV-1 antigens was associated with lower HIV RNA levels (Table 2), and the association with Gag was significant (P⫽0.009). While the association between CTL and viral load did not reach significance for the other HIV antigens, the trend was observed in the analysis where CTL against all antigens were combined (P⫽0.087). In con-trast, no indication of a negative correlation between viral load and frequencies of CTL specific for any HIV protein tested was observed for the B*35-Px group.
It had been shown previously that the numbers of A2-re-stricted CTL are inversely associated with viral load (35); we therefore examined whether the same is true in our study population. A significant negative correlation was observed between CTL level and viral load for the A*02 positive indi-viduals in this study (P⫽0.003 for total CTL andP⫽0.0005 for Gag-specific CTL) but not for the remainder of samples. Because A*02 is evenly distributed in the B*35-Px and -PY group of patients we studied (seven in each group), the
ob-served difference in CTL and viral load association between the B*35-Px and -PY groups is unlikely due to the A*02 effect. However, such a deduction cannot be formally proved due to a substantial reduction in sample size if A*02-bearing subjects are excluded from the analysis used in Fig. 3 and 4 as well as Table 2.
We used a homogeneity-of-slopes model to compare the relationships of CTL frequency to viral load levels between the B*35-Px and -PY groups for each antigen and all antigens combined (Table 2). Significantly different relationships be-tween the B*35-Px and -PY carriers were observed for all CTL combined (P⫽0.049) and also for Gag alone (P⫽0.018). The homogeneity-of-slopes test showed striking differences in viral load versus CTL correlations between subjects bearing and lacking A*02, for all CTL (P⫽0.002), Gag-specific CTL (P⫽
0.001), and Pol-specific CTL (P⫽0.004). These data suggest that increasing frequency of HIV-specific CTL confers
[image:5.603.127.462.70.201.2]protec-FIG. 3. Broadly reactive antigen-specific CD8⫹T cells were detected in both B*35-Px and -PY groups. The percentage of IFN-␥-producing CD8⫹T cells specific for HIV-1-antigens Env, Gag, Pol, and Nef in each patient was expressed as one open circle. Data for 16 B*35-Px individuals and 16 B*35-PY individuals were included in each plot.
TABLE 2. Linear model analysis of effect of anti-HIV CTL levels on viral load
Variant group categoryCTL Regressioncoefficient P
B*35-Pxa Total 0.263 0.432
Env 3.996 0.340
Gag 0.305 0.692
Pol 0.699 0.301
Nef 1.947 0.725
B*35-PYa Total ⫺0.449 0.087c
Env ⫺2.419 0.374
Gag ⫺2.002 0.009c
Pol ⫺0.727 0.302
Nef ⫺1.271 0.155
B*35-Px vs B*35-PYb Total 0.786 0.049
Env 7.383 0.101
Gag 2.486 0.018
Pol 1.590 0.092
Nef 3.935 0.445
aData for B*35-Px and for B*35-PY show effects of CTL level on viral load for
these groups considered separately. Regression coefficient is the slope.
bData for B*35-Px vs B*35-PY show difference in effect of CTL level on viral
load. Regression coefficient is the comparison of B*35-Px and -PY.
cBoldface type indicatesP⬍0.05.
on November 8, 2019 by guest
http://jvi.asm.org/
[image:5.603.300.540.489.683.2]tion among A*02- and B*35-PY-positive individuals but not among B*35-Px-positive individuals.
DISCUSSION
Our initial approach to understanding the functional basis for the difference in AIDS progression between individuals with B*35-Px versus those with B*35-PY was to examine po-tential differences in overall CTL frequency mediated through all the HLA genes present in each individual, instead of those restricted only by either the B*35-Px or -PY molecules. We did not observe a significant difference in CTL percentages be-tween the B*35-Px and B*35-PY groups, either for total or individual HIV antigens, suggesting that the quantity of HIV-1-specific CTL overall does not account for the different rates of disease progression between these two groups. This result was not unexpected since these individuals should have CTL restricted by all other HLA types present in addition to B*35. Furthermore, we propose that B*35-Px exerts an actively neg-ative effect on disease progression, where CTL recognizing HIV peptides in the context of B*35-Px may actually cause damage in a manner similar to that observed in autoimmune diseases. This hypothesis is based on epidemiological data showing that individuals with B*35-Px progress to AIDS sig-nificantly more rapidly than do individuals who are homozy-gous for other alleles at HLA-B (8), indicating that B*35-Px cannot simply be considered a null allele (i.e., where CTL recognizing HIV peptides in the context of B*35-Px are simply missing or inactive). These data correlate with a previous re-port which indicated that although HLA-B*57 is overrepre-sented in the HIV-1-infected LTNPs, there is no quantitative difference in the total HIV-1-specific CTL between B*57-pos-itive LTNPs and B*57-posB*57-pos-itive progressors (15, 31).
Although an obvious, overall quantitative difference in fre-quencies of HIV-specific CTL between the two patient groups was not observed, the B*35-PY group did show an inverse relationship between CTL levels and viral loads for each HIV
antigen examined. However, significance was reached only in the case of Gag-specific CTL, and the inverse correlations observed for B*35-PY were not nearly as pronounced as those for A*02. The relationship for the B*35-Px group actually tended in the opposite direction, and the difference between the B*35-Px and B*35-PYgroups in their relationships be-tween total HIV-specific CTL level (combined CTL percent-ages for all four antigens) and viral loads was marginally sig-nificant (P⬍0.05) (Table 2). This difference may be weakened by the presence of CTL restricted by other non-B*35 subtypes in the same individuals.
The data presented herein serve as a foundation for further studies that address activity of CTL restricted by B*35-PY versus -Px specifically. The difference between the B*35-Px and -PY groups in their association between HIV-specific CTL percentages and viral load, particularly of CTL against Gag, might be explained by several possibilities, some of which are (i) B*35-Px-bearing individuals present a similar set of peptide epitopes, but do so less effectively than those bearing the B*35-PY allele; (ii) CTL escape mutants are more frequently generated in B*35-Px-positive patients than -PY-positive pa-tients; (iii) B*35-Px and -PY molecules present different epitopes, and those presented by CTL generated in B*35-PY are protective, but those presented by B*35-Px are not; and (iv) B*35-Px molecules suppress the CTL activity mediated through the other HLA molecules in the same individuals.
Alternatively, some HIV-1-specific CD8⫹T cells (i.e., those in the B*35-Px group) may not be fully functional, in that they contain less perforin or produce fewer-chemokines, for ex-ample. Indeed, recent studies have reported the existence of HIV-1-specific CTL that lack perforin (2) and melanoma-spe-cific CD8⫹T cells that are not cytolytic (28). Further experi-ments using specific tetramers in combination with cytokine staining may help to test these other possibilities in patients with various subtypes.
CTL specific for some HIV antigens may be more protective against high viral load and HIV disease progression than
oth-FIG. 4. Association between viral loads and HIV-1-specific CTL numbers at the time of blood draw. Plots on the upper row are correlations between viremia (log10) levels and Env, Pol, Gag, and Nef specific CTL numbers in the B*35-PY group of patients; those on the lower row are the same correlations for the B*35-Px group of patients. Each open circle represents one patient. There is a significant inverse correlation between Gag-specific CTL and viral load in the B*35-PY group (r⫽ ⫺0.614;P⫽0.009).
on November 8, 2019 by guest
http://jvi.asm.org/
ers. Several studies concluded that CTL to early HIV or simian immunodeficiency virus gene products, such as Nef and Tat, are the most effective (1, 12, 13, 19, 26), because these CTL recognize and kill virus-infected cells before viral particles are produced. CTL specific for env gene product have been de-tected during primary HIV infection and appear to exert strong selective pressure on HIV genetic variation (5, 27, 32, 39). Gag sequences are highly conserved, and CTL specific for the molecule are readily detected in most patients at all stages of HIV infection (6, 25, 35, 37), suggesting that Gag-specific CTL responses could potentially restrict HIV replication. Data described herein would support a protective role for Gag-specific CTL responses after HIV infection, though qualitative effects of CTL against HIV molecules—which are not mea-sured by methods employed here—cannot be ruled out.
While CTL are important in controlling viral replication, other factors that might contribute to the different rates of HIV-1 disease progression in HLA-B*35-bearing individuals should also be considered. Genetic factors in linkage disequi-librium with B*35 may contribute to the predisposition of these subjects to HIV-1 disease progression, as opposed to B*35 itself, though the fact that B*35-Px is associated with rapid progression in both Caucasians and African-Americans argues against this possibility (14). Furthermore, immunolog-ical factors other that CD8⫹T cells, such as natural killer (NK) and CD4⫹T cells, may also be important in controlling HIV-1 replication differentially through specific B*35 subtypes. Therefore, in order to fully elucidate the mechanisms of MHC class I-associated variability in rates of HIV-1 disease progres-sion, it will be necessary to examine characteristics of these other cells as well.
ACKNOWLEDGMENTS
We thank Wendy Chen for graphics and Michael Plankey for the advice on statistics.
This project has been funded in part with federal funds from the National Cancer Institute, National Institutes of Health, under con-tract NO1-CO-12400.
The content of this publication does not necessarily reflect the views or policies of the Department of Health and Human Services, nor does mention of trade names, commercial products, or organizations imply endorsement by the U.S. Government.
REFERENCES
1. Allen, T. M., D. H. O’Connor, P. Jing, J. L. Dzuris, B. R. Mothe, T. U. Vogel, E. Dunphy, M. E. Liebl, C. Emerson, N. Wilson, K. J. Kunstman, X. Wang, D. B. Allison, A. L. Hughes, R. C. Desrosiers, J. D. Altman, S. M. Wolinsky, A. Sette, and D. I. Watkins.2000. Tat-specific cytotoxic T lymphocytes select
for SIV escape variants during resolution of primary viraemia. Nature407:
386–390.
2. Appay, V., D. F. Nixon, S. M. Donahoe, G. M. Gillespie, T. Dong, A. King, G. S. Ogg, H. M. Spiegel, C. Conlon, C. A. Spina, D. V. Havlir, D. D. Richman, A. Waters, P. Easterbrook, A. J. McMichael, and S. L. Rowland-Jones.2000. HIV-specific CD8⫹T cells produce antiviral cytokines but are
impaired in cytolytic function. J. Exp. Med.192:63–75.
3. Betts, M. R., J. P. Casazza, B. A. Patterson, S. Waldrop, W. Trigona, T. M. Fu, F. Kern, L. J. Picker, and R. A. Koup.2000. Putative immunodominant
human immunodeficiency virus-specific CD8⫹T-cell responses cannot be
predicted by major histocompatibility complex class I haplotype. J. Virol.
74:9144–9151.
4. Betts, M. R., J. F. Krowka, T. B. Kepler, M. Davidian, C. Christopherson, S. Kwok, L. Louie, J. Eron, H. Sheppard, and J. A. Frelinger.1999. Human immunodeficiency virus type 1-specific cytotoxic T lymphocyte activity is inversely correlated with HIV type 1 viral load in HIV type 1-infected
long-term survivors. AIDS Res. Hum. Retrovir.15:1219–1228.
5. Borrow, P., H. Lewicki, X. P. Wei, M. S. Horwitz, N. Peffer, H. Meyers, J. A. Nelson, J. E. Gairin, B. H. Hahn, M. B. A. Oldstone, and G. M. Shaw.1997. Antiviral pressure exerted by HIV-1-specific cytotoxic T lymphocytes (CTLs)
during primary infection demonstrated by rapid selection of CTL escape
virus. Nat. Med.3:205.
6. Carmichael, A., X. Jin, P. Sissons, and L. Borysiewicz.1993. Quantitative analysis of the human immunodeficiency virus type 1 (HIV-1)-specific cyto-toxic T lymphocyte (CTL) response at different stages of HIV-1 infection: differential CTL responses to HIV-1 and Epstein Barr virus in late disease.
J. Exp. Med.177:249–256.
7. Carrington, M., G. W. Nelson, M. P. Martin, T. Kissner, D. Vlahov, J. J. Goedert, R. Kaslow, S. Buchbinder, K. Hoots, and S. J. O’Brien.1999. HLA and HIV-1: heterozygote advantage and B*35-Cw*04 disadvantage. Science
283:1748–1752.
8. Carrington, M., and S. J. O’Brien.The influence of HLA genotype on AIDS. Annu. Rev. Med, in press.
8a.Centers for Disease Control.1992. 1993 Revised classification system for HIV infection and expanded surveillance case definition for AIDS among
adolescents and adults. Morbid. Mortal. Wkly. Rep.41(RR-17):1–19.
8b.Centers for Disease Control.1987. Revision of the CDC surveillance case definition for acquired immunodeficiency syndrome. Morb. Mortal. Wkly.
Rep.36(Suppl. 1):3S–15S.
9. Connick, E., R. L. Schlichtemeier, M. B. Purner, K. M. Schneider, D. M. Anderson, S. MaWhinney, T. B. Campbell, D. R. Kuritzkes, J. M. Douglas, F. N. Judson, and R. T. Schooley.2001. Relationship between human im-munodeficiency virus type 1 (HIV-1)-specific memory cytotoxic T
lympho-cytes and virus load after recent HIV-1 seroconversion. J. Infect. Dis.184:
1465–1469.
10. Cox, D. R., and D. Oakes.1984. Analysis of survival data. Chapman and Hall, London, United Kingdom.
11. Edwards, B. H., A. Bansal, S. Sabbaj, J. Bakari, M. J. Mulligan, and P. A. Goepfert.2002. Magnitude of functional CD8⫹T-cell responses to the gag
protein of human immunodeficiency virus type 1 correlates inversely with
viral load in plasma. J. Virol.76:2298–2305.
12. Evans, D. T., D. H. O’Connor, P. Jing, J. L. Dzuris, J. Sidney, J. da Silva, T. M. Allen, H. Horton, J. E. Venham, R. A. Rudersdorf, T. Vogel, C. D. Pauza, R. E. Bontrop, R. DeMars, A. Sette, A. L. Hughes, and D. I. Watkins.
1999. Virus-specific cytotoxic T-lymphocyte responses select for amino-acid
variation in simian immunodeficiency virus Env and Nef. Nat. Med.5:1270–
1276.
13. Gallimore, A., M. Cranage, N. Cook, N. Almond, J. Bootman, E. Rud, P. Silvera, M. Dennis, T. Corcoran, J. Stott, and et al.1995. Early suppression
of SIV replication by CD8⫹nef-specific cytotoxic T cells in vaccinated
macaques. Nat. Med.1:1167–1173.
14. Gao, X.-J., G. W. Nelson, P. Karacki, M. P. Martin, J. Phair, R. Kaslow, J. J. Goedert, S. Buchbinder, K. Hoots, D. Vlahov, S. J. O’Brien, and M. Car-rington.2001. Effect of a single amino acid change in MHC class I molecules
on the rate of progression to AIDS. N. Engl. J. Med.344:1668–1675.
15. Gea-Banacloche, J. C., S. A. Migueles, L. Martino, W. L. Shupert, A. C. McNeil, M. S. Sabbaghian, L. Ehler, C. Prussin, R. Stevens, L. Lambert, J. Altman, C. W. Hallahan, J. C. de Quiros, and M. Connors.2000.
Mainte-nance of large numbers of virus-specific CD8⫹T cells in HIV-infected
progressors and long-term nonprogressors. J. Immunol165:1082–1092.
16. Goulder, P. J., M. Bunce, P. Krausa, K. McIntyre, S. Crowley, B. Morgan, A. Edwards, P. Giangrande, R. E. Phillips, and A. J. McMichael.1996. Novel, cross-restricted, conserved, and immunodominant cytotoxic T lymphocyte epitopes in slow progressors in HIV type 1 infection. AIDS Res. Hum.
Retrovir.12:1691–1698.
17. Goulder, P. J. R., R. E. Phillips, R. A. Colbert, S. McAdam, G. Ogg, M. A. Nowak, P. Giangrande, G. Luzzi, B. Morgan, A. Edwards, A. J. McMichael, and S. Rowland-Jones.1997. Late escape from an immunodominant cyto-toxic T lymphocyte response associated with progression to AIDS. Nat. Med.
3:212.
18. Greenough, T. C., D. B. Brettler, M. Somasundaran, D. L. Panicali, and J. L. Sullivan.1997. Human immunodeficiency virus type 1-specific cytotoxic T lymphocytes (CTL), virus load, and CD4 T cell loss: evidence supporting a
protective role for CTL in vivo. J. Infect. Dis.176:118–125.
19. Haas, G., U. Plikat, P. Debre, M. Lucchiari, C. Katlama, Y. Dudoit, O. Bonduelle, M. Bauer, H. G. Ihlenfeldt, G. Jung, B. Maier, A. Meyerhans, and B. Autran.1996. Dynamics of viral variants in HIV-1 Nef and specific
cytotoxic T lymphocytes in vivo. J. Immunol.157:4212–4221.
20. Harty, J. T., A. R. Tvinnereim, and D. W. White.2000. CD8⫹T cell effector
mechanisms in resistance to infection. Annu. Rev. Immunol.18:275–308.
21. Jin, X., M. Ramanathan Jr, Jr., S. Barsoum, G. R. Deschenes, L. Ba, J. Binley, D. Schiller, D. E. Bauer, D. C. Chen, A. Hurley, L. Gebuhrer, R. El Habib, P. Caudrelier, M. Klein, L. Zhang, D. D. Ho, and M. Markowitz.
2002. Safety and immunogenicity of ALVAC vCP1452 and recombinant gp160 in newly human immunodeficiency virus type 1-infected patients
treated with prolonged highly active antiretroviral therapy. J. Virol.76:2206–
2216.
22. Kaslow, R. A., M. Carrington, R. Apple, L. Park, A. Munoz, A. J. Saah, J. J. Goedert, C. Winkler, S. J. O’Brien, C. Rinaldo, R. Detels, W. Blattner, J. Phair, H. Erlich, and D. L. Mann.1996. Influence of combinations of human major histocompatibility complex genes on the course of HIV-1 infection.
Nat. Med.2:405–411.
on November 8, 2019 by guest
http://jvi.asm.org/
Med.181:1365–1372.
26. Koenig, S., A. J. Conley, Y. A. Brewah, G. M. Jones, S. Leath, L. J. Boots, V. Davey, G. Pantaleo, J. F. Demarest, and C. Carter.1995. Transfer of HIV-1-specific cytotoxic T lymphocytes to an AIDS patient leads to selection for
mutant HIV variants and subsequent disease progression. Nat. Med.1:330–
336.
27. Koup, R. A., J. T. Safrit, Y. Cao, C. A. Andrews, G. McLeod, W. Borkowsky, C. Farthing, and D. D. Ho.1994. Temporal association of cellular immune response with the initial control of viremia in primary HIV-1 syndrome.
J. Virol.68:4650–4655.
28. Lee, P. P., C. Yee, P. A. Savage, L. Fong, D. Brockstedt, J. S. Weber, D. Johnson, S. Swetter, J. Thompson, P. D. Greenberg, M. Roederer, and M. M. Davis.1999. Characterization of circulating T cells specific for
tumor-asso-ciated antigens in melanoma patients. Nat. Med.5:677–685.
29. Marsh, S. G. E., P. Parham, and L. D. Barber.2000. HLA and disease, p. 79–83, The HLA facts book. Academic Press, London, United Kingdom. 30. McMichael, A., and T. Hanke.2002. The quest for an AIDS vaccine: is the
CD8⫹T-cell approach feasible? Nat. Rev. Immunol.2:283–291.
31. Migueles, S. A., M. S. Sabbaghian, W. L. Shupert, M. P. Bettinotti, F. M. Marincola, L. Martino, C. W. Hallahan, S. M. Selig, D. Schwartz, J. Sulli-van, and M. Connors.2000. HLA B*5701 is highly associated with restriction
Segal, Y. Cao, S. L. Rowland-Jones, V. Cerundolo, A. Hurley, M. Markowitz, D. D. Ho, D. F. Nixon, and A. J. McMichael.1998. Quantitation of HIV-1-specific cytotoxic T lymphocytes and plasma load of viral RNA. Science
279:2103–2106.
36. Phillips, R. E., S. Rowland-Jones, D. F. Nixon, F. M. Gotch, J. P. Edwards, A. O. Ogunlesi, J. G. Elvin, J. Rothbard, C. R. M. Bangham, C. R. Rizza, and A. J. McMichael.1991. Human immunodeficiency virus genetic variation
that can escape cytotoxic T cell recognition. Nature354:453–459.
37. Rinaldo, C., X. L. Huang, Z. Fan, M. Ding, L. Beltz, A. Logar, D. Panicali, G. Mazzara, J. Liebmann, M. Cottrill, and P. Gupta.1995. High levels of anti-human immunodeficiency virus type 1 (HIV-1) memory cytotoxic T lymphocytes activity and low viral load are associated with lack of disease in
HIV-1-infected long-term nonprogressors. J. Virol.69:5838–5842.
38. van Baalen, C. A., O. Pontesilli, R. C. Huisman, A. M. Geretti, M. R. Klein, F. de Wolf, F. Miedema, R. A. Gruters, and A. D. Osterhaus.1997. Human immunodeficiency virus type 1 Rev- and Tat-specific cytotoxic T lymphocyte frequencies inversely correlate with rapid progression to AIDS. J. Gen.
Virol.78:1913–1918.
39. Wolinsky, S. M., B. T. M. Korber, A. U. Neumann, M. Daniels, K. J. Kunstman, A. J. Whetsell, M. R. Furtado, Y. Cao, D. D. Ho, J. T. Safrit, and R. A. Koup.1996. Adaptive evolution of human immunodeficiency virus type
1 during the natural course of infection. Science272:537–542.