Micrographs of Fractured Vinyl Ester Composites H Ku, S F Ang, C Snook and D Baddeley
Faculty of Engineering and Surveying, University of Southern Queensland, Australia.
Corresponding Author: Title : Dr.
Name : Harry Siu-lung Ku
Affiliation : Faculty of Engineering and Surveying, University of Southern Queensland. Tel. No. : (07) 46 31-2919
Fax. No. : (07) 4631-2526
E-mail : ku@usq.edu.au
Abstract: This paper reports the difference in impact strength between microwave cured vinyl ester particulate composites and those cured under ambient conditions by
examining the micrographs of the fractured specimens. Drop weight impact test had
been used to fracture the samples. The original contribution of this paper is to tell the
fracture behaviour of the samples as well as the relative toughness of the specimens
by viewing their micrographs. The results show that the difference in the impact
strength between optimally (lower power and longer exposure duration) microwave
cured samples and those cured under ambient conditions is minimal. However, if the
specimens were cured using higher power, the resulting toughness of the samples
would be lower as many voids would form in the samples due to the initial expansion
of the composite.
Introduction
Composite components made from vinyl ester resins suffer considerable shrinkage
during cross-linking. This shrinkage is particularly serious if the fiber composite
components are large. It can be more than ten percent in volume, which is much
higher than claimed by some researchers and resins’ manufacturers [1, 2]. The main
drawback of this shrinkage in a composite component is to have stresses set up
internally. These stresses in plane are usually tensile in the core of the component and
compressive on the surface [3]. When these stresses act together with the applied
loads during service they may cause premature failure of the composite components.
A method to reduce the shrinkage is to cure the composites using microwave power
[4-7]. In the previous study, the difference in average energy required to fracture or
ambient conditions were found to be very small. The more powderised appearance in
the crushed zone in the microwave cured samples may be due to higher impact
resistance.
In addition, quite a number of specimens that were cured with microwaves tended not
to fracture when they were impacted from a drop height of 400mm; whereas most of
the specimen cured under ambient condition tended to fail at a drop height of 400mm
[8, 9]. This research is to try higher level of microwave powers with shorter duration
of exposure to increase processing efficiency but at the same time maintain the quality
of the samples. The same composite, thirty three (33%) by weight of fly ash
particulate reinforced vinyl ester resins [VE/FLYASH (33%)], is used.
The impact strength of a material is the energy required to initiate and propagate a
crack through the material. The impact energy of a material is the amount of energy
required to fracture a given volume of the material. The crack propagation energy is
related to the toughness of the material and the length of that crack tip that must travel
in order to fracture a component [10].
The Composite samples and the test
In this study, Hetron 922 PAW (vinyl ester resin used in winter) was used. The resin
catalyst (MEKP) ratio used in the experiment was 98% resin by volume and 2%
catalyst by volume [11]. The reinforcement was fly ash (ceramic hollow spheres)
particulate and they were made 33 % by weight in the cured vinyl ester composite
considered optimum because the composite will have a reasonable fluidity for casting
combined with a good tensile strength in service.
The resin, a colourless liquid, is first mixed with the colourless accelerator. After that
the fly ash is added to the mixture and they are then mixed to give the uncured
composite. As the raw materials of the composites are liquid and ceramic hollow
spheres (E-spheres SLG with a mean diameter of 130 µm), the short bar specimens
were cast to shape. The uncured composite was poured into the moulds of PVC tubes
(Figure 1) for curing in ambient or microwaved conditions [6].
The preference for drop weight impact test over the more conventional methods, e.g.,
Charpy and Izod tests, is due to the limitations that are experienced while trying to
perform impact testing on composite materials. Another main advantage of using
drop weight impact test over other standard tests is its ability to reproduce conditions
under which real life component would be subject to impact loading. This means that
if a material specimen or an actual item was tested, replication of the testing
arrangement should be possible, provided enough testing samples should be produced.
The method of using the drop weight impact includes the use of a falling weight
which impacts the specimen. The drop weight impact test set-up is shown in Figure
2. The impact striker is known as a tup which falls through a vertical guide tube that
directs it to the centre of a specimen. The guide tube must be perpendicular to the
impact surface as stated in the American testing standards. In testing composite
materials, the constant weight and varying height method has to be used because
reduce the number of samples required and increase accuracy. The required items are
accelerometer, charge amplifier, A/D converter and data acquisition equipment.
Microwaves and sample size
The material properties of greatest importance in microwave processing of a dielectric
are the complex relative permittivity ε = ε′ - jε″ and the loss tangent, tan δ = ε ε
′ ′′
[13].
The real part of the permittivity, ε′, sometimes called the dielectric constant, mostly
determines how much of the incident energy is reflected at the air-sample interface,
and how much enters the sample. The most important property in microwave
processing is the loss tangent, tan δ or dielectric loss, which predicts the ability of the
material to convert the incoming energy into heat. For optimum microwave energy
coupling, a moderate value of ε′, to enable adequate penetration, should be combined
with high values of ε″ and tan δ, to convert microwave energy into thermal energy.
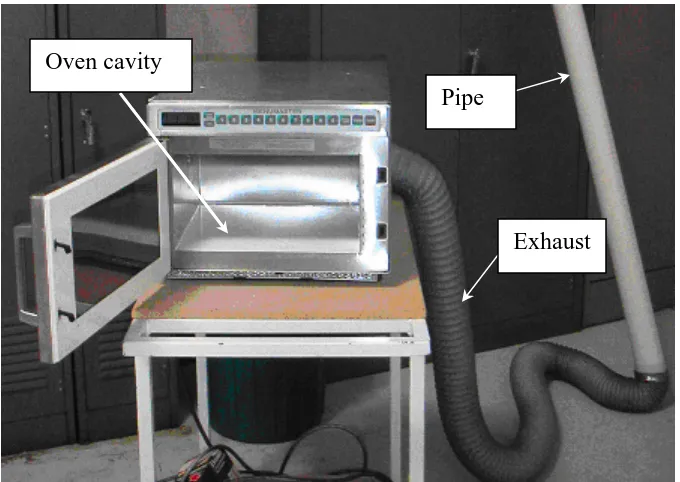
The microwave facility used in this project is shown in Figure 3.
Latin Square is used to establish the required sample size for each type of microwave
treatment and the sample size chosen was the same as in the previous study [8, 9, 14].
In this project, in addition to exposing samples to 10, 15 and 20 seconds respectively
to microwave power of 540 W, the composite was also exposed to microwave
irradiation of 180 and 360 W. The duration of exposure for both power levels was 30,
Energy consumed in breaking the samples
Comparison of average energy used to initiate the crack can provide good indication
on the initial failure of the specimens among these groups. Table 1 shows the results
of average energy used to initiate the crack between the specimens cured under
microwave conditions with a power level of 540 Watts. Samples cured with
microwaves for 10 seconds tended to require less energy to initiate the crack. It
requires 0.57 joules of energy less than those cured under ambient condition (Table 2)
[8]. In addition, the spread of this group was largest as compared with others. From
specimens cured with microwaves for 15 seconds, the average energy required to
initiate the crack was 0.36 joules less than those cured for 10 seconds. The amount of
energy required to initiate crack for specimens cured with microwaves for 20 seconds
was very low. It was 4.56 joules less than those cured for 10 seconds. This may be
due to a lot of pores inside the samples. From Table 2, it can be found that the energy
required to initiate crack for samples exposed to microwaves of 30 and 35 seconds
were higher than that cured under ambient conditions. By investigating Table 3, it
can be argued that the samples cured by microwave power of 360 W were the
toughest. In order to study the fracture behavior of the specimens, some samples were
carefully investigated with the aid of scanning electron microscope (SEM).
Scanning electron microscope (SEM)
The Scanning Electron Microscope (SEM) is a microscope that uses electrons rather
light microscope. The SEM has a large depth of field, which allows a large amount of
the sample to be in focus at one time. The SEM also produces images of high
resolution, which means that closely spaced features can be examined at a high
magnification. SEM requires conductive samples and Figure 4 shows the Scanning
Electron Microscope (SEM). The combination of higher magnification, larger depth
of focus, greater resolution, and ease of sample observation makes the SEM one of the
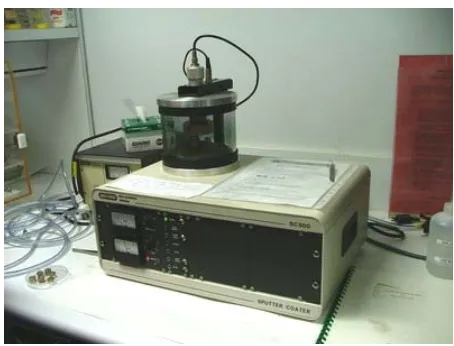
most heavily used instruments in research areas today. The sputter coater is used to
coat non-metallic samples with a thin layer of gold and it is shown in the Figure 5.
Since the composite samples were non-conductive, it was necessary for them to be
coated with a thin layer of gold. Figure 6 illustrates that a sample is being coated with
a thin layer of gold. The surface will look like Figure 7 after being coated with a thin
layer of gold. This makes them conductive and ready to be viewed under SEM.
When the electron beam strikes the sample, both proton and electron signals are
emitted. Figure 8 shows the electron and specimen interaction. While all these signals
are present in the SEM, not all of them are detected and used for gathering images.
The signals most commonly used are the secondary electrons, the backscattered
electrons and X-rays. When an SEM is used, the column must always be at a vacuum. There are many reasons for this. If the sample is in a gas filled environment,
an electron beam cannot be generated or maintained because of a high instability in
the beam. Gases could react with the electron source, causing it to burn out, or cause
electrons in the beam to ionize, which produces random discharges and leads to
instability in the beam. The transmission of the beam through the electron optic
column would also be hindered by the presence of other molecules. Those other
compounds and condense on the sample. This would lower the contrast and obscure
detail in the image. A vacuum environment is also necessary in part of the sample
preparation. One such example is the sputter coater. If the chamber is not at vacuum
before the sample is coated, gas molecules would get in the way of the argon and
gold. This could lead to uneven coating, or no coating at all. Figure 9 illustrates a
prepared sample mounted on a specimen stub and placed on the stage.
Results and Discussions
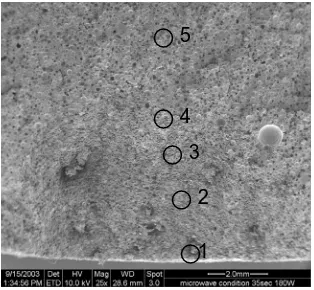
Figure 10 shows the 5 points chosen to be investigated on specimens cured under
microwave conditions with a power level 180 Watts, exposure time of 40 seconds.
Figure 11 shows the 5 points chosen to be investigated on specimens cured under
microwave conditions with power level 540 Watts and exposure time of 10 seconds.
Figures 12 and 13 show the five locations studied under SEM for ambient cured and
microwave cured (180 W and 35 seconds) samples respectively. The reason for
choosing these 5 points was because these points showed the crushed zone and
fracture propagation zone of these four specimens.
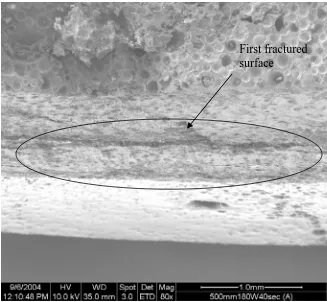
Figure 14 illustrates area 1 of Figure 10 (microwave cured, power = 180 W and time
= 40 seconds); it shows a big crushed on the top surface (curving area) of the
specimen. Figure 15 depicts area 2 of Figure 10; it illustrates the start of the fractured
surface; a small hole was also found when the magnification was increased to 300
times. Figure 16 shows area 3 of Figure 10; it illustrates 50 % of the crushed zone; 50
10; it also shows secondary cracking; 90 % of fractured propagation zone and 10 % of
crushed zone were found. Figure 18 illustrates area 5 of Figure 10; it shows small
pieces of debris on the cracked surface; the direction of crack growth was towards the
left. Figure 19 also illustrates area 5 of Figure 10. The magnification was 5,000
times and brittle fractured surface was found.
Figure 20 illustrates area 1 of Figure 11 (microwave cured, power = 540 W and time
= 10 seconds); it shows a big crushed on the top surface. Figure 21 depicts area 2 of
Figure 11; it illustrates longer fractured surface. Figure 22 shows area 3 of Figure 11;
it depicts 70 % of crushed zone and 30 % of fractured propagation zone. Figure 23
also shows area 3 of Figure 11 but with a magnification of 2,500 times; small pieces
of debris were found on the cracked surface. Figure 24 shows area 4 of Figure 11; it
shows small pieces of debris and brittle fracture; in addition, crack was also found
propagating through fly ash particle. Figure 25 illustrates area 5 of Figure 11; it
shows much of the brittle fracture was on crack propagation zone.
Figures 12 and 13 show the five locations studied under SEM for ambient cured and
microwave cured (180 W and 35 seconds) samples respectively. Figures 26 and 27
illustrate area 1 of ambient cured and microwave cured (180 W, 35 s) samples
respectively. The magnification for both locations is 1000 times. It is observed that
there is more powder in the crushed zone of sample cured under microwave
conditions. Otherwise, the difference between the two figures was not much. Figures
28 and 29 illustrate area 2 of ambient cured and microwave cured samples
respectively. More powder was also found in the crushed zone of microwave cured
shown in Figures 30 through 35 for ambient cured and microwave cured samples
respectively.
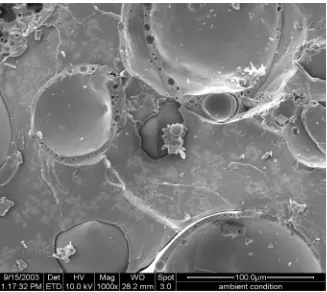
Figures 36 and 37 illustrate area 1 of ambient cured and microwave cured samples
respectively. The magnification for both locations is 16,000 times. Flake of powder
can be found in Figure 37 but not in Figure 36. By and large, under the magnification
of 1000 times (Figures 30 through 35), the results obtained for specimens cured under
microwave conditions showed not much difference with those cured under ambient
condition.
From Table 1, it was found that the energy required to initiate crack for sample of 540
W and 10 seconds was 8.27 joules. Table 3 shows that the energy required to initiate
crack for samples of 180 W and 40 seconds and of 180 W and 35 seconds were 8.66
and 8.81 joules respectively. This means that sample of 540 W and 10 seconds was
the most brittle specimen and followed by sample of 180 W and 40 seconds. Figures
25 (540 W, 10s), 18 (180 W, 40s) and 35 (180 W, 35 s) were the micrographs of the
above 3 samples respectively. Figure 18 shows the most severe brittle fracture and
is followed by Figure 25. Figure 35 is the most ductile as no brittle cleavage
appearance can be identified. From Table 2, it can be found that the energy required
to initiate crack in this group of samples were higher than those found in Tables 1 and
2. It seems that the micrographs of the samples in Table 2 would show more eminent
ductile failure than their counterparts. In general, the displacements at peak force for
samples in Table 2 were also higher than the other groups in Tables 1 and 3. From
fractured composite, it is possible to predict whether the composite samples are tough
or not.
References
1. Clarke, J L (Editor), Structural design of polymer composites, E & FN Spon, 1996,
pp.59-62, 343-5, 357, U.K.
2. Matthews, F L and Rawlings, R.D, Composite Materials: Engineering and Science,
1st edition, Chapman and Hall, 1994, pp.171-3, U.K.
3. Mulder, D, Investigation of Impact Loading on Particulate Filled Resins, BEng
Thesis, 2002, University of Southern Queensland, Australia.
4. Ku, H S, Van Erp, G, Ball, J A R and Ayers, S, Shrinkage Reduction of Thermoset
Fibre Composites during Hardening using Microwaves Irradiation for Curing,
Proceedings, Second World Engineering Congress, Kuching, Malaysia, 22-25
July,2002, pp. 177-182.
5. Ku, H S, Risks involved in curing vinyl ester resins using microwaves irradiation,
Journal of Material Synthesis and Processing, Vol. 10, No. 2, 2002, pp. 97 -106.
6. Ku, S H, Curing vinyl ester particle reinforced composites using microwaves,
7. Ku, S H and Siores, E, Shrinkage reduction of thermoset matrix particle reinforced
composites during hardening using microwaves irradiation, Transactions, Hong Kong
Institution of Engineers, Vol. 11, No. 3, 2003, pp. 29-34.
8. Cheng, Y M, Ku, H, Snook, C and Baddeley, D, Impact Strength of Vinyl Ester
Composites Cured by Microwave Irradiation: Preliminary Results, Proceedings of the
IMechE, Part L, Journal of Materials: Design and Applications, 2004 (accepted for
publication).
9. Ku, H, Cheng, Y M, Baddeley, D and Snook, C, Drop Weight Impact Test Fracture
of Vinyl Ester Composites: Micrographs of Pilot Study, Journal of Composite
Materials, 2004 (accepted for publication).
10. ASTM, Standard test method for impact resistance of plastic and electrical
insulating materials, ASTM D256-288, 1990, U.S.A.
11. Astrom, B T (1997), Manufacturing of polymer composites, Chapman and Hall,
pp.74-83, 432-4, U.K.
12. Cooper, M G, To Study the Effects of Impact on Particulate Reinforced Polymer
Materials, BEng Thesis, 2000, University of Southern Queensland, Australia.
13. Metaxas, A C. and Meredith, R J (1983), Industrial microwave heating, Peter
14. Denes, J and Keedwell, A D, Latin Squares and their Applications, English
Side cutting
Figure 1: The mould
Figure 2: The drop weight tower
Pipe Oven cavity
Exhaust
Figure 3: The microwave facility
[image:15.595.147.487.70.311.2]
[image:16.595.142.442.461.657.2]
Figure 5: The sputter coater
Figure 6: The sputter coaster is coating a thin layer of gold on the specimen’s surface
Figure 8: Electron and Specimen Interaction
[image:17.595.189.433.257.410.2]
5
4
3
2
[image:18.595.170.472.70.347.2]1
Figure 10: Microwave conditions with 180W and expose time of 40 seconds
1
5
3
2
4
[image:18.595.157.460.397.674.2]
5
4
3
2
[image:19.595.149.461.72.360.2]1
Figure 12: Five points chosen to be investigated with specimens cured under ambient condition
5
4
3
2
1
[image:19.595.146.460.404.694.2]
First fractured surface
Figure 14: Area 1, 180 W & 40 s, magnified by 80 times, first fractured surface
Empty hole
[image:20.595.146.473.70.372.2]
Secondary Cracking
Figure 16: Area 3 180 W & 40s, magnified by 300 times, secondary cracking
Secondary Cracking
Direction of crack growth
Small pieces of debris
Figure 18: Area 5, 180 W & 40s, magnified by 600 times, direction of crack
Appearance of brittle fracture
First fracture surface
Figure 20: Area 1, 540 W & 10 s, magnified by 80 times, brittle fracture
Longer fracture surface
Crushed Zone
Figure 22: Area 3, 540 W & 10 s, magnified by 300 times, crushed zone
Appearance of brittle fracture
Secondary Cracking
Figure 24: Area 4, 540 W & 10 s, magnified by 80 times, secondary cracking
Appearance of brittle fracture
Small pieces of debris
Figure 26: Area 1, ambient cured, magnified by 1,000 times
Figure 28: Area 2, ambient cured, magnified by 1,000 times
Figure 30: Area 3, ambient cured, magnified by 1,000 times
Figure 32: Area 4, ambient cured, magnified by 1,000 times
[image:29.595.142.469.92.384.2]
Figure 34: Area 5, ambient cured, magnified by 1,000 times
Figure 36: Area 1, ambient cured, magnified by 16,000 times
Table 1: Average energy required to fracture specimens cured with a power level 540 Watts
Curing Condition Power Level of 540 Watts
Exposure time 10 seconds 15 seconds 20 seconds
Energy used to initiate the crack 8.27 joules 7.91 joules 3.71 joules
Energy used to propagate the crack 1.83 joules -2.77 joules 0.507 joules
Total Energy Dissipated 10.1 joules 7.91 joules 4.217 joules
[image:32.595.40.558.242.437.2]Displacement at peak force 0.0018 m 0.0017 m 0.0015 m
Table 2: Average energy required to fracture specimens cured with a power level 360 Watts
Curing Condition Microwave with power level of 360 Watts
Specimens Type Fractured Specimens
Specimens Materials VE/FLYASH (33%)
Exposure time Ambient Condition
(0 second)
30 seconds 35 seconds 40 seconds
Energy used to initiate the crack
8.84 joules 9.45 joules 9.02 joules 8.50 joules
Energy used to propagate
the crack
2.16 joules 1.03 joules 2.12 joules 2.53 joules
Total energy dissipated 11.00 joules 10.84 joules 11.14 joules 11.03 joules
Displacement at peak force 0.0018 m 0.0017 m 0.0018 m 0.0017 m
Table 3: Average energy required to fracture specimens cured with a power level 180 Watts
Curing Condition Power Level of 180 Watts
Exposure time 30 seconds 35 seconds 40 seconds
Energy used to initiate the crack 8.22 joules 8.81 joules 8.66 joules
Energy used to propagate the crack 2.62 joules 2.16 joules 2.16 joules
Total Energy Dissipated 10.84 joules 11.97 joules 10.82 joules
[image:32.595.86.524.480.583.2]