Nonlinear waves in disordered chains: Probing the limits of chaos and spreading
J. D. Bodyfelt,1T. V. Laptyeva,1Ch. Skokos,1,2,*D. O. Krimer,1,3and S. Flach1 1Max Planck Institute for the Physics of Complex Systems, N¨othnitzer Str. 38, D-01187 Dresden, Germany 2Center for Research and Applications of Nonlinear Systems, University of Patras, GR-26500 Patras, Greece
3Theoretische Physik, Universit¨at T¨ubingen, D-72076 T¨ubingen, Germany (Received 19 March 2011; published 11 July 2011)
We probe the limits of nonlinear wave spreading in disordered chains which are known to localize linear waves. We particularly extend recent studies on the regimes of strong and weak chaos during subdiffusive spreading of wave packets [Europhys. Lett. 91, 30001 (2010)] and consider strong disorder, which favors Anderson localization. We probe the limit of infinite disorder strength and study Fr¨ohlich-Spencer-Wayne models. We find that the assumption of chaotic wave packet dynamics and its impact on spreading is in accord with all studied cases. Spreading appears to be asymptotic, without any observable slowing down. We also consider chains with spatially inhomogeneous nonlinearity, which give further support to our findings and conclusions.
DOI:10.1103/PhysRevE.84.016205 PACS number(s): 05.45.−a, 05.60.Cd, 63.20.Pw
I. INTRODUCTION
Anderson localization [1] was discovered 50 years ago in disordered crystals as an accumulation of single-particle elec-tronic wave functions and can be interpreted as an interference effect between multiple scatterings of the electron by random defects of the potential. As a consequence eigenstates are no longer spatially extended but are exponentially localized. Anderson localization is a universal phenomenon of wave physics, unrestricted to quantum mechanics. Experimental observations were made in noninteracting Bose-Einstein con-densates (BEC) expanding in random optical potentials [2,3], light propagation in spatially random nonlinear optical media [4,5], and microwave cavities filled with randomly distributed scatterers [6]. Anderson localization is a linear wave effect, i.e., it is well established for wave equations which are linear in the wave amplitude. However, in many cases one is confronted with a nonlinear response of the wave-carrying medium; for instance, high light intensities induce a nonlinear response of the optical medium. Electron-electron and electron-phonon interactions also result in substantial deviations from Anderson localization in solids. In experiments of Bose-Einstein conden-sates the interatomic interactions are always present, although they can be diminished by either decreasing atomic densities or by exploiting magnetically tunable Feshbach resonances.
From a mathematical perspective, a linear wave equation is integrable, with each normal mode evolving independently in time. A localized wave packet in the presence of Anderson localization will therefore stay localized as time evolves. Non-linearity will usually destroy the integrability of a system and induce mode-mode interactions. It was observed numerically that wave packets in such nonlinear disordered wave equations delocalize in time without respecting Anderson localization limits [7–11]. Thus, there are several intriguing questions which have attracted much attention during the last few years: (i) Will Anderson localization be destroyed by arbitrary small strength of nonlinearity or is there a threshold below which the localization is restored? (ii) Will wave packet spreading, if
observed, last forever or will it stop at certain (though probably very large) time? (iii) Is the shape of the initial wave packet crucial for the details of spreading? We will mainly address question (ii) here.
Johansson et al. [12] conjectured that spreading must eventually stop and dynamics will become close to regular, assuming that in these limits the Kolmogorov-Arnold-Moser (KAM) theorem is applicable, i.e., that for small wave density regular nonergodic phase space structures predominate and the dynamics develops along KAM tori. Other attempts consist in a numerical scaling analysis, in order to predict and extend results beyond computational ability [13]. Analytical studies perform perturbation theory to higher order by treating the strength of nonlinearity as a small parameter [14], conflicting with the explosive growth of secular terms in higher orders of perturbation theory. This theory states that for the disor-dered discrete nonlinear Schr¨odinger model with nonlinearity strength exceeding a finite threshold, any initial localized wave packet cannot fully spread to zero amplitudes at infinite time. In this case, a part of the excitation is self-trapped as a result of nonlinearity-induced frequency shifts, which tune a localized excitation out of resonance with its surrounding nonexcited linear modes. However, even in the case of strong nonlinearity, subdiffusion of the non-self-trapped part is observed [9]. When strong nonlinearities are avoided numerical studies showed a rather universal asymptotic subdiffusive spreading of initial single-site excitations [8,9,15], which is characterized by a growth of the second moment of the wave packet as tα, withα <1 [9,15]. The self-trapping theorem [16] holds
irrespective of the strength of disorder; therefore it is reflecting the properties of a strongly nonlinear lattice wave equation, rather than peculiarities of waves propagating in disordered media. Also the self-trapping theorem crucially depends on the presence of at least two integrals of motion, and it fails for most nonlinear wave equations with only one integral of motion.
mode-mode interactions [17]. A generalization to higher di-mensionsDand different nonlinearity powers was performed. This led to a quantitative prediction for the subdiffusive wave packet spreading characteristicα [9]. Its validity was confirmed numerically in [9,15,18]. Recently, it has been pre-dicted theoretically [19,20] and verified numerically [19] that a potentially long-lasting strong chaos regime induces faster (though still subdiffusive) spreading, which is followed by the asymptotic and slower weak chaos subdiffusive spreading. Notably, published numerical data did not reveal a further slowing down of spreading, when starting from the weak chaos regime.
In this paper we present results of extensive numerical studies of wave packet spreading in various models of disordered nonlinear one-dimensional lattices. In particular, we consider different initial excitations and scan the parameter space of disorder strength and nonlinearity over a wide region. The main aim is to test the applicability of previously derived spreading laws and to search for indications of a continuation of the weak chaos spreading, or for indications of a slowing down, as conjectured by others.
II. MODELS
A. Discrete nonlinear Schr¨odinger and Klein-Gordon chains In our study we consider various one-dimensional lattice models. The first one is the disordered discrete nonlinear Schr¨odinger equation (DNLS) described by the Hamiltonian function
HD =
l
l|ψl|2+
β 2|ψl|
4−(ψ
l+1ψl∗+ψl∗+1ψl), (1)
in whichψlare complex variables,lare the lattice site indices,
andβ 0 is the nonlinearity strength. The random on-site energiesl are chosen uniformly from the interval [−W2,W2],
with W denoting the disorder strength. The equations of motion are generated by ˙ψl=∂HD/∂(iψl):
iψ˙l=lψl+β|ψl|2ψl−ψl+1−ψl−1. (2)
This set of equations conserves both the energy of Eq. (1) and the normS=l|ψl|2.
The second model we consider is the quartic Klein-Gordon (KG) lattice, given as
HK =
l
p2
l
2 + ˜ l
2u 2
l +
1 4u
4
l +
1
2W(ul+1−ul) 2, (3)
whereulandplare, respectively, the generalized coordinates
and momenta on sitel, and ˜lare chosen uniformly from the
interval [12,32]. The equations of motion are ¨ul= −∂HK/∂ul
and yield
¨
ul= −˜lul−u3l +
1
W(ul+1+ul−1−2ul). (4)
This set of equations only conserves the energy of Eq. (3). The scalar measure of energy resulting from Eq. (3) we shall henceforth label asH. This scalar value H0 serves as a control parameter of nonlinearity, similar toβ for the DNLS case.
Forβ=0 andψl =Alexp(−iλt), Eq. (2) reduces to the
linear eigenvalue problem
λAl =lAl−Al−1−Al+1. (5)
The normalized eigenvectors Aν,l (
lA2ν,l =1) are the
corresponding normal modes (NMs), and the eigenvalues λν are the frequencies of these NMs. The width of the
eigenfrequency spectrum λν in Eq. (5) isD =W+4 with
λν ∈[−2−W2,2+W2]. The coefficient 1/(2W) in Eq. (3) was
chosen so that the linear parts of the Hamiltonians Eqs. (1) and (3) would correspond to the same eigenvalue problem. In the limit H→0 (in practice by neglecting the nonlinear term u4
l/4) the KG model of Eq. (3)—with ul=Alexp(iωt)—is
reduced to the same linear eigenvalue problem of Eq. (5), under the substitutionsλ=W ω2−W−2 andl =W( ˜l−1). The
width of the squared frequencyω2
ν spectrum isK =1+W4
withω2
ν∈[12, 3 2 +
4
W]. Note thatD =W K. As in the case
of DNLS,Wdetermines the disorder strength.
The asymptotic spatial decay of an eigenvector is given byAν,l∼e−l/ξ(λν), whereξ(λν) is the localization length. In
the case of weak disorder, W →0, the localization length is approximated [17,21] asξ(λν)ξ(0)≈100/W2. The NM
participation numberpν=1/
lA4ν,lcharacterizes the spatial
extend of the NM. An average measure of this extent is the localization volume V, which is of the order of 3.3ξ(0)≈ 330/W2 for weak disorder and unity in the limit of strong disorder,W → ∞[17]. The average spacing of eigenvalues of NMs within the range of a localization volume is then d ≈/V, with being the spectrum width. The two frequency scalesd determine the packet evolution details in the presence of nonlinearity.
In order to write the equations of motion of Hamiltonian (1) in the normal mode space of the system we insertψl=
νAν,lφν in (2), with |φν|2 denoting the time-dependent
amplitude of the νth NM. Then, using Eq. (5) and the orthogonality of NMs the equations of motion (2) read
iφ˙ν =λνφν+β
ν1,ν2,ν3
Iν,ν1,ν2,ν3φν∗1φν2φν3 (6)
with the overlap integral
Iν,ν1,ν2,ν3=
l
Aν,lAν1,lAν2,lAν3,l. (7)
The frequency shift of a single-site oscillator induced by the nonlinearity is δl=β|ψl|2 for the DNLS model. The
squared frequency shift of a single-site oscillator induced by the nonlinearity for the KG system is δl =(3El)/(2 ˜l),
withEl being the energy of the oscillator. Since all NMs are
exponentially localized in space, each effectively couples to a finite number of neighbor modes. The nonlinear interactions are thus of finite range; however, the strength of this coupling is proportional to the norm (energy) density for the DNLS (KG) model. If the packet spreads far enough, we can generally define two norm (energy) densities: one in real space,nl= |ψl|2(El), and the other in NM space,nν = |φν|2
(Eν). By averaging over realizations, no strong difference is
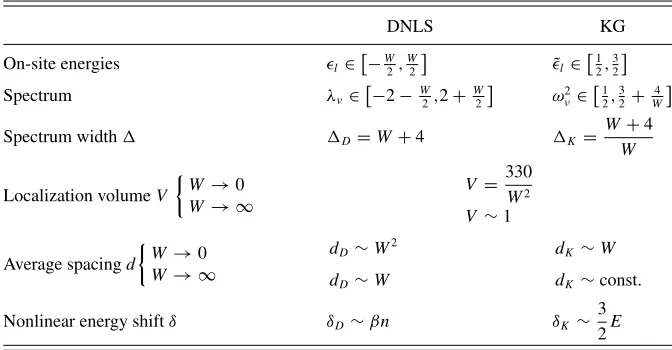
TABLE I. Characteristic quantities of the DNLS (1) and the KG (3) models. The dependence on the strength of disorder W of both the localization volumeV and of the average spacingdof NM eigenvalues within the range ofV is given for the limiting cases of weakW→0 and strong disorderW→ ∞. Note thatn(E) represents a general characteristic norm (energy) of wave packets of the DNLS (KG) model.
DNLS KG
On-site energies l∈
−W
2,
W
2
˜ l ∈
1
2, 3 2
Spectrum λν ∈
−2− W2,2+ W2 ω2
ν ∈ 1
2, 3 2 +
4
W
Spectrum width D=W+4 K =
W+4 W Localization volumeV
W→0 W→ ∞
V = 330 W2 V ∼1 Average spacingd
W→0 W→ ∞
dD∼W2
dD∼W
dK ∼W
dK ∼const.
Nonlinear energy shiftδ δD∼βn δK∼
3 2E
DNLS model, while the squared frequency shift isδK ∼3E/2
for the KG lattice. The basic characteristics of both models are summarized in TableI.
We order the NMs in space by increasing value of the center-of-norm coordinate Xν =
llA2ν,l [9,15,18,19]. For
DNLS we follow normalized norm density distributions zν ≡ |φν|2/
μ|φμ|2, while for KG we follow normalized
energy density distributions zν≡Eν/
μEμ with Eν =
˙ A2
ν/2+ων2A2ν/2, where Aν is the amplitude of theνth NM
andω2
νits squared frequency. We measure the second moment
m2=ν(ν−ν¯)2z
ν(with ¯ν=
ννzν), which quantifies the
wave packet’s spreading width; the participation number P =1/νzν2, i.e., the number of the strongest excited modes inzν; and the compactness indexζ =P2/m2, which quantifies
the inhomogeneity of a wave packet. Thermalized distributions haveζ ≈3, whileζ 3 indicates very inhomogeneous pack-ets, e.g., sparse (with many holes) or partially self-trapped ones (see [15] for more details). In addition, following Anderson’s definition of localization [1], we measure the fraction SV
(HV) of the wave packet norm (energy) in a localization
volume V around the initially excited state in real space. For a localized state this fraction asymptotically tends to a constant nonzero value, while it goes to zero in the case of delocalization.
B. Fr¨ohlich-Spencer-Wayne chain
In the limit of strong disorder (W → ∞) the DNLS and KG models suffer from increasing computational times needed to observe any nontrivial dynamics. This is because the eigenvectors tend to single-site profiles; i.e., the overlap integrals become very small. Fr¨ohlich, Spencer, and Wayne (FSW) suggested considering a modified Hamiltonian, which operates directly in normal mode space for the strong disorder limit, but considers artificial rescaled anharmonic
interactions between neighboring NMs in order to rescale time [22]:
H=
ν
p2ν 2 +
ν
2u 2
ν+
1
4(uν+1−uν)
4, (8)
where the NMs are equivalent to the single-site oscillators. The NM eigenvalues ν are considered to be uncorrelated,
also for nearest neighbors. This is different from the DNLS and KG models. Also the FSW chain has only pair interactions between NMs (sites). Note also that the nonlinear part of the FSW Hamiltonian is invariant under any shiftuν→uν+a,
as opposed to the KG model.
C. Models with spatially inhomogeneous nonlinearity We also consider two variants of DNLS and KG models with spatially inhomogeneous nonlinearity. The first type of lattice is composed of linear coupled oscillators except for a central region of length L where nonlinearities are present. We refer to this type as the LNL (linear-nonlinear-linear) model. The second type is called NLN (nonlinear-linear-nonlinear) and is the exact counterpart of the previous one, since the linear part of the lattice is located at the central Lsites.
III. WAVE PACKET EVOLUTION A. Theoretical predictions
1. DNLS and KG
cannot uniformly spread over the entire lattice. Consequently, a part of the wave packet will remain localized, although the theorem does not prove that the location of this inhomogeneity is constant in time.
If the nonlinear shiftδmoves the frequencies of some of the initially excited oscillators out of the linear spectrum, it tunes them out of resonance and part of the wave packet will be self-trapped. In our study we consider initial “block” wave packets, where L central oscillators of the lattice are excited having the same norm (energy). Since we consider many random disorder realizations (of the order of a few hundred) we expect that, on average, the linear frequencies of the initially excited lattice sitesl ( ˜l) cover the whole range of permitted values
[−W2,W2] ([12,32]). Thus, some of these frequencies are tuned out of resonance ifδD2 (δK 1/W). These conditions for
the possible appearance of self-trapping are less strict than the theoretically defined ones [15,16] and are, in general, in good agreement with numerical simulations. In particular, the self-trapping regime was numerically observed for single-site excitations [9,15,18] and for extended excitations [19], both for the DNLS and the KG models, despite the fact that the KG system conserves only the total energyH, and the self-trapping theorem cannot be applied there.
When self-trapping is avoided forδD <2 (δK 1/W), two
different spreading regimes were predicted, having different dynamical characteristics: an asymptotic weak chaos regime and a potential intermediate strong chaos one [20]. Numerical verifications of the existence of these two regimes were presented in [18,19]. In the weak chaos regime, for LV andδ < d most of the NMs are weakly interacting with each other. Then the subdiffusive spreading of the wave packet is characterized by m2∼t1/3. If the nonlinearity is weak enough to avoid self-trapping, yet strong enough to ensure δ > d, the strong chaos regime is realized. Wave packets in this regime initially spread faster than in the case of weak chaos, with m2∼t1/2. Since the norm density drops with further spreading,δis dropping in time as well, and eventually the wave packet enters the weak chaos regime, where its evolution is characterized by slower spreading withm2∼t1/3. The wave packet evolution in both the weak and the strong chaos spreading regimes is also expected to be characterized by an increase of the participation number asP ∼tα/2when m2∼tα.
Let as now discuss the spreading of wave packets when L < V. The packet will initially spread over the localization volume V during a time interval τin∼2π/d, even in the absence of nonlinearities [19,20]. The initial average norm (energy) densitynin(Ein) of the wave packet is then lowered ton(τin)≈ninL/V[E(τin)≈EinL/V]. The further spreading of the wave packet in the presence of nonlinearities is then determined by these reduced densities. Note that for single-site excitations (L=1), the strong chaos regime therefore completely disappears and the wave packet evolves either in the weak chaos or in the self-trapping regime [8,9,15,23].
2. FSW chain
There are no existing theoretical predictions for wave packet dynamics in the FSW chain. The FSW case can be considered as a strong disorder limit of the KG model,
emulating the dynamics of the latter in NM space. However, in the KG and DNLS case, triplet interactions between NMs are present and necessary in order to allow for finite (though small) resonance probabilities for small (but finite) energy and norm densities [17,20]. Pair interactions will cease to produce NM resonances for sufficiently small densities due to level repulsion within one localization volume [15,17,20]. The FSW chain keeps only pair interactions. At the same time, level repulsion between neighboring (interacting) NMs is absent in the FSW case. Therefore, a theoretical analysis similar to the DNLS and KG case [20] appears to be possible. Its details will be considered in a future publication. The width of the linear spectrum isFSW=1. The average spacing of nearest neighbor eigenvalues isdFSW∼FSW. Therefore, we expect that only the asymptotic regime of weak chaos and the regime of self-trapping can be expected.
3. LNL and NLN chains
The LNL chain can be expected to start in a chaotic wave packet spreading regime as long as the wave packet is confined mainly to the finite-size N (nonlinear) part. However, the more the wave packet spreads, the more it extends into the infinitely extended L (linear) parts. Resonances and chaos are therefore confined to the finite N part. Since distant NMs in the L part are exponentially weakly interacting with the chaotic NMs in the N part, their excitation—if present—will take times which increase exponentially with growing distance. Therefore, the wave packet will spread (if at all) slower than any power law. Thus, the LNL model is the only model we consider here, where almost trivial slowing down of spreading is expected.
Recently, the dynamics of a similar system was theoret-ically investigated in [24], where a disordered subsystem of coupled anharmonic oscillators, linearly coupled to an infinite harmonic system, was considered. In this work the conditions which permit the persistence of the discrete breather of the isolated anharmonic system for small but nonvanishing couplings to the harmonic lattice were derived, and cases characterized by energy transfer to the harmonic system were also discussed.
The NLN chain is expected to behave differently. As long as the wave packet is confined mainly to the L region, the dynamics is regular, and no spreading should occur. For large enough time, some part of the packet will leak out into the N regions. Therefore, spreading of the wave packet should finally occur.
B. Numerical results 1. Methods
We consider compact DNLS wave packets att=0 span-ning a widthLcentered in the lattice, such that withinLthere is a constant initial norm of nin=1 and a random phase at each site, while outside the widthLthe norm density is zero. In the KG case, we excite each site in the width Lwith the same energy,E=H /L, i.e., initial momenta ofpl = ±
√ 2E with randomly assigned signs.
2 3 4 5
log
10
m
〈
〉
〈
〉
〈
〉
〈
〉
2
1.5 2
log
10
P
1 2 3 4
0 2 4 6
log
10t
0 0.2 0.4 0.6 0.8
α
m0 2 4 6
log
10t
0 0.05 0.1 0.15 0.2 0.25
α
P0 2 4 6
log
10t
0 0.2 0.4 0.6 0.8
S
Vr b
g br m
bl r b g br
bl m r
b
g
br
bl
m r b
g
br
bl m
bl
m
r
b g br
bl m
r b
g br
(a)
(b)
(c)
(f)
(e)
(d)
FIG. 1. (Color online) DNLS,W=4: Evolution of (a)log10m2(t), (b)log10P(t), (c)ζ(t), (d) finite-difference derivativeαm(t) for
the smoothedm2data of panel (a), (e) finite-difference derivativeαP(t) for the smoothedP data of panel (b), and (f)SV(t)for the spreading
of wave packets with initial widthL=21 andβ=0.012,0.04,0.18,0.72,3.6,8.4 [(bl) black; (m) magenta; (r) red; (b) blue; (g) green; (br) brown]. In panels (a), (b), (d), and (e) straight lines correspond to theoretically predicted power lawsm2∼tα,P ∼tα/2withα=1/3 (dashed lines) andα=1/2 (dash-dotted lines). Error bars in panels (a) and (b) denote representative one-standard-deviation errors.
model is described in the Appendix. The number of lattice sites, N, and the integration time step τ varied between N =1000 to N =2000 andτ =0.01 to τ =0.1, in order to exclude finite-size effects in the wave packet evolution, and in order to reach long integration times up to 107–109 time units with feasible CPU times. In all our simulations, the relative energy and norm errors are kept smaller than 10−3. For each parameter set we averaged our data over 1000 different disorder realizations, unless otherwise stated, and denote this by. . .. In particular, we computem2andP, and we smooth log10m2 andlog10P with a locally weighted regression algorithm [27], and then apply a central finite difference to calculate the local derivatives
αm=
dlog10m2
dlog10t , αP =
dlog10P
dlog10t . (9)
2. Weak disorder
In this section we considerably extend the reports on the observation of weak chaos, strong chaos, the crossover between both and the self-trapping regime in Ref. [19]. In Fig. 1 we show results for the DNLS model with W =4 andL=V =21, for six different values of the nonlinearity strengthβ. The time evolution oflog10m2(t)andlog10P(t) is plotted in Figs.1(a)and1(b), respectively. The evolution of the compactness indexζ(t) is shown in Fig.1(c). In Figs.
1(d)and1(e)we plot the time dependence of the numerically computed derivativesαm(t) andαP(t) (9) obtained from the
smoothed curves of Figs.1(a)and1(b), respectively. Finally, in Fig.1(f)the values ofSV(t)are plotted.
The weak chaos dynamics is observed in Fig. 1 for β= 0.012 (black curves) andβ =0.04 (magenta curves). Initially, the wave packets remain localized and all quantities of Fig.1
are constant withαm,αP being practically zero. After some
detrapping time td the wave packets start to subdiffusively
spread withm2 ∼t1/3andP ∼t1/6[Figs.1(a), 1(b), 1(d), and 1(e)]. In addition, the compactness indexζ ≈3 [Fig.1(c)], indicating that wave packets are well thermalized inside. The tendency toward complete delocalization of wave packets is clearly depicted in the evolution of the averaged norm fraction SV, which remains at the L=21 initially excited sites
[Fig. 1(f)]. After the detrapping time td SV decreases
continuously up to the final integration timet =107.
By increasing the value toβ=0.18, the initial spreading dynamics enters the crossover between weak and strong chaos, and a faster spreading is observed. Spreading sets in earlier, the compactness index again indicates thermalized wave packets, and the local derivativesαmandαPincrease up to 0.4 and 0.2,
respectively, with a possibly very slow decrease at even larger times.SV again continuously decreases to zero, indicating
complete delocalization.
Forβ=0.72, we fully enter the strong chaos regime. Most importantly we observe a saturation of the local exponentαm
around the theoretical value 1/2, with a subsequent decay, again as predicted by theory [20] and first observed in [19].
[image:5.608.59.555.74.322.2]FIG. 2. (Color online) DNLS,W=4: Time evolution of average norm density distributionszlin real space for (a)β=0.04, (b)β=0.72,
and (c)β=3.6. The color scales shown on top of panels (a)–(c) are used for coloring each lattice site according to its log10zlvalue.
For larger timeαmdecreases below 1/2. The evolution appears
to be rather complex and is not captured by the theoretical considerations in [20]. The large values ofαmmay be due to
temporal trapping and detrapping processes in this strongly nonequilibrium dynamics of the wave packet, with a final trapped packet fraction remaining. Therefore, we observe that log10Pstarts to level off [Fig.1(b)],αP tends to very small
values [Fig.1(e)], andζtends to zero [Fig.1(c)]. In Fig.1(f), we observe that the values ofSV saturate to higher values
forβ=8.4.
For these typical cases of weak chaos (β =0.04), strong chaos (β=0.72), and self-trapping (β =3.6) we present in Figs.2(a)–2(c) the time evolution of the averaged norm density distributions zl in real space. All simulations presented in
Fig.2 started from the same initial profile with sizeL=V; therefore the width of the localization volume set by the linear case is the width of the distributions at the shortest times in the plots. In the weak chaos regime [Fig.2(a)], the wave packets remain close to their initial configuration for some times, as the highzlvalues in the region of the initial excitation indicate,
followed by delocalization at larger times. Thus, att =107 the averaged wave packet has spread to about 100 sites with zl>10−5. Therefore, the wave packet spreads continuously
over distances which are an order of magnitude larger than the limits set by the linear theory and destroy Anderson localization. In the case of strong chaos [Fig.2(b)], spreading is even faster, leading to more extended profiles att=107: there are about 400 sites withzl>10−5. In the self-trapping
regime [Fig.2(c)], the spreading part of the wave packet covers 700 sites, with another clearly visible part staying self-trapped at the initial excitation region. The curved fronts in the density plots in Fig.2follow from the theoretical predictionm2∼tα, which leads to a packet widthN ∼√m2andN ∼e(αlog10t)/2. For the KG model (3) withW =4 we present in Fig. 3
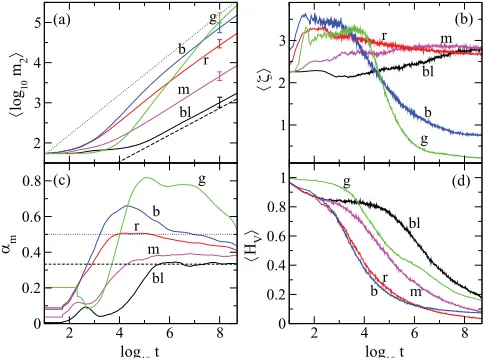
similar results to the ones for the DNLS model. For small values of the initial energy density E=0.01, the charac-teristics of the weak chaos regime are observed: m2∼t1/3 [black curve in Fig. 3(a)] after a detrapping time td ≈105,
wave packets remain compact as they spread since ζ ≈3 [Fig.3(b)], and the fractionHVof the energy of the initially
L=21 excited sites decreases [Fig. 3(d)]. For E=0.04 we enter the crossover region between the weak and the strong chaos regimes, with characteristics similar to the DNLS case. For E=0.2 (red curves in Fig. 3) we observe the typical behavior of the strong chaos scenario: spreading is characterized by a saturated αm≈1/2 [Fig.3(c)] for about
two decades (log10t ≈3.5–5.5), followed by a crossover to the weak chaos dynamics withαmdecreasing. Getting closer
to the self-trapping regime forE=0.75 (blue curves in Fig.3), or being deep inside it forE=3 (green curves in Fig.3) the
2 3 4 5
log
10
m
2
1 2 3
2 4 6 8
log10 t
0 0.2 0.4 0.6 0.8
αm
2 4 6 8
log10 t
0 0.2 0.4 0.6 0.8 1
H
V
g m
r b
b r
(a) (b)
(c) (d)
m bl
g b r
bl
m bl
g
b g
r m bl
〈
〉
〈
〉
〈
〉
[image:6.608.53.553.71.265.2] [image:6.608.315.557.475.654.2]characteristics of the self-trapping behavior appear, sinceζ decreases [Fig.3(b)], andHVtends to stabilize to nonzero
small values [Fig.3(d)]. Similar to theβ =3.6 andβ=8.4 cases of the DNLS model, the evolution of m2 [Fig. 3(a)] shows an initial phase of fast growth withαm>1/2 [Fig.3(c)]
followed by a lowering in the values ofαm.
Our numerical results are in accord with the predictions of weak and strong chaos regimes, as well as of the crossover from strong to weak chaos. Self-trapping is observed as well, with less understood strongly nonequilibrium dynamics of the trapped and spreading packet parts. We vehemently stress that in all our simulations we never observed any evidence of a wave packet transition from the weak chaos regime, characterized by αm=1/3, to a subsequent slowing down
of spreading, which would lead toαm<1/3.
3. Strong disorder
To search for potential deviations from the predicted spreading laws, we turn to large values ofW for the DNLS system. In all our simulations we hadLV. In particular, we set L=10 and considered the cases with W =15 and W =40. For large values of W we expect only the weak chaos and the self-trapping dynamical regimes to be observed [19]. For each value ofW three different values of β were considered, one being in the weak chaos regime and the other two in the self-trapping regime. In particular, we considered β=0.5,β=9,andβ =30 forW =15 andβ=1,β =25, andβ=100 forW =40. The obtained results are shown in Fig.4forW =15 and in Fig.5forW =40.
For largeW, the localization volumeV decreases drasti-cally, so that eventually the overlap integrals become small as well. Therefore, the values ofβ at which spreading becomes visible will increase. In the weak chaos spreading regime the detrapping timetd becomes large and we start observing
1 1.5 2 2.5
log
10
m
2
2 4 6 8
0 2 4 6
log10 t
0 0.1 0.2 0.3 0.4 0.5
αm
0 2 4 6
log10 t
0 0.2 0.4 0.6 0.8
SL
(a)
m
(c)
(b)
(d)
m
m
m g
g
g
g br br
br
br
〈
〉
〈
〉
〈
〉
FIG. 4. (Color online) DNLS, W=15: Evolution of (a) log10m2(t), (b)ζ(t), (c)αm(t), and (d)SL(t)vs log10tfor the spreading of initially compact wave packets of widthL=10 with β=0.5,9,30 [(m) magenta; (g) green; (br) brown]. Mean values are averaged quantities over 100 disorder realizations. In panels (a) and (c) straight lines correspond to theoretically predicted weak chaos behaviorm2∼t1/3.
spreading after long time intervals. ForW =15 andβ =0.5 we findtd ≈103[Fig.4(a)]. The local derivativeαmincreases
from zero, showing a tendency to approach the theoretically predicted valueα=1/3 [Fig.4(c)], and bothζ[Fig.4(b)] andSL[Fig.4(d)] start to decrease. We note that sinceV ∼1
for largeW, we measure the time evolution of the fractionSL(t)
of the norm density of theL=10 initially excited sites. The detrapping time td increases asW increases. This is
seen from the results forW =40,β =1 (magenta curves in Fig.5). In this case, we have to wait at least up totd =105
in order to get some evidence that spreading starts, since after that timelog10m2starts to slightly grow [Fig.5(a)], whileζ [Fig.5(b)] andSL[Fig.5(d)] start to decrease. This increase
oftd happens despite the fact that the nonlinearity strengthβ
also increased by a factor of 2 as compared to theW =15 case. Nevertheless, even in this case of largeW =40 we are able to numerically observe the onset of spreading in the weak chaos regime. IncreasingW to even higher values pushestd
to values larger than the final integration timet =107used in our simulations.
With increasingβ we observe self-trapping, but a part of the wave packet spreads andm2 increases [green and brown curves in Figs.4(a)and5(a)]. The average compactness index ζdecreases, which is a clear indication that a part of the wave packet remains localized, and reaches smaller final values for largerβ [Figs.4(b)and5(b)]. The self-trapping of the wave packets is also clearly seen from the evolution of SL. In
Fig.4(d) we see that forW =15,β=9 (green curve) and β =30 (brown curve) SL decreases due to the spreading
of a part of wave packets, while, finally, it shows a tendency to level off to a positive value, indicating that part of the wave packets remains localized. Similar behaviors ofSLare
observed in Fig.5(d)for theW =40 case withβ =25 (green curve) andβ =100 (brown curve), although the plateauing of
1 1.2 1.4 1.6 1.8
log
10
m
2
2 4 6 8 10
0 2 4 6
log10 t
0 0.1 0.2 0.3 0.4
αm
0 2 4 6
log10 t
0.4 0.5 0.6 0.7 0.8 0.9
SL
(a)
(b)
(c)
(d)
m
br
g m
br g
m
br
g m
br
g
〈
〉
〈
〉
〈
〉
[image:7.608.313.556.485.669.2] [image:7.608.51.293.486.668.2]1 2 3
log
10
P, m
2
3 4 5 6
2 4 6 8
log10 t
0 0.1 0.2 0.3
αp
,
αm
2 4 6 8
log10 t
0 0.2 0.4 0.6 0.8 1
H
L
b r
r b
(a) (b)
(c) (d)
〈
〉
〈
〉
〈
〉
FIG. 6. (Color online) FSW: Evolution of (a)log10m2(t)[(r) red curve] andlog10P(t)[(b) blue curve], (b)ζ(t), (c)αm(t) [(r)
red curve] andαP(t) [(b) blue curve], and (d)HL(t)vs log10tfor initially compact wave packets of widthL=21 withE=0.05.
SLis not as clear as in Fig.4(d). The numerically computed
exponentsαmexhibit the typical behavior of self-trapping seen
in Fig.1(d). ForW =15 they increase, reaching values larger than 1/3,and afterward decrease towardαm=1/3 [Fig.4(c)].
ForW =40 a similar behavior is observed forβ =100, while forβ=25αm seems to approach the theoretically predicted
value 1/3 from below.
Therefore, even for strong disorder, the dynamics of wave packets evolves according to the theoretical predictions. Most importantly, we do not observe a slowing down of the wave packet below the limits set by the weak chaos regime.
4. FSW model
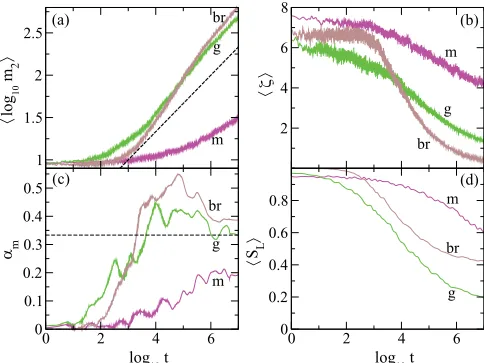
To further probe a possible slowing down of wave packet spreading beyond the limits of weak chaos, we turn to the FSW model (8). In Fig. 6 we present results with initial compact wave packets of widthL=21, with energy density E=0.05, similarly to the KG model (3). We observe that also for this model subdiffusive spreading occurs, because the second moment and the participation number [red and blue curves, respectively, in Fig.6(a)] increase continuously, and the corresponding exponents αm andαP [Fig. 6(c)] tend to
eventual constant nonzero values. The fractionHLof energy
remaining in the L=21 initially excited sites [Fig. 6(d)] decreases as time increases, indicating the delocalization of the wave packets. The compactness index [Fig. 6(b)] has a different behavior with respect to what we have seen in the rest of our simulations, as it decreases slowly up tot≈107, with a subsequent increase. Therefore, the wave packet is highly inhomogeneous for almost all the integration time, violating the assumptions which are used in the theoretical considerations of weak chaos [20]. The observed subdiffusive spreading may still not be in its final asymptotic range. Still, we again do not see any signature of a slowing down of this subdiffusive process, as was reported in [28] where a similar model was considered. Clearly the FSW model calls for a thorough and independent study.
1.5 2 2.5 3 3.5
log
10
m
2
1.25 1.5 1.75 2
log
10
P
2 3 4 5
2 4 6 8
log
10t
0 0.1 0.2 0.3 0.4 0.5
α
m2 4 6 8
log
10t
0 0.05 0.1 0.15 0.2 0.25
α
P2 4 6 8
log
10t
H
V
0 0.2 0.4 0.6 0.8 1
m m
m m
m
m
r r
g
r
r
r
r
g g
g g
g
(a) (b) (c)
(f) (e)
(d)
〈
〉
〈
〉
〈
〉
〈
〉
[image:8.608.53.294.70.250.2] [image:8.608.54.553.445.693.2]5. LNL and NLN models
In Fig.7 we present results for the KG, LNL, and NLN models forW =4,L=21,andE=0.02. For comparison we also include the results for the KG model (3) (magenta curves) withE=0.02, for which subdiffusive spreading in the weak chaos regime is observed. The NLN KG model (green curves in Fig.7) exhibits a similar behavior, since both the second moment [Fig.7(a)] and the participation number [Fig.7(b)] start to grow after some detrapping timetd ≈105. This time
is larger than the detrapping time of the KG model (td ≈104),
because a wave packet in the NLN KG model initially evolves in an almost linear system and only after some large time, when it has spread significantly to the nonlinear part of the lattice, does spreading takes on characteristics of the purely nonlinear model.
On the other hand the evolution of all quantities of Fig.7
for the LNL KG system (red curves) follows the KG model untilt≈104, because initially the wave packets evolve in the same nonlinear system. Later on the wave packet enters the L (linear) parts of the system. Thus, spreading starts to retard, and bothlog10m2(t)[Fig.7(a)] andlog10P(t)[Fig.7(b)] show a characteristic slowing down in the exponentsαm[Fig.7(d)]
andαP [Fig.7(e)]. In addition,SV [Fig.7(f)] saturates at
finite nonzero values, indicating that wave packets tend to localize again. For all three KG models, the values of ζ [Fig.7(c)] show that wave packets do not become sparse and inhomogeneous in the course of time. We obtained similar results for the LNL and NLN DNLS models forW =4,L= 21,andβ=0.04.
Thus, spreading is also observed for the LNL and NLN models, and only in the case of the LNL models have we observed a slowing down of the spreading, as expected.
IV. SUMMARY AND CONCLUSIONS
We considered several models of disordered nonlinear one-dimensional lattices and performed extensive numerical simulations of norm (energy) propagations. Since we focused on the dynamical spreading of fronts, we prepared initial block wave packet profiles, having widths equal to or larger than the average localization volume defined by the linear problem. We would expect similar behaviors for initial Gaussian profiles (although calculations were not performed), again where the width (for Gaussians, say the standard deviation) is on par with the average localization volume.
We carefully studied statistical properties of the dynamics, by varying the values of disorder and nonlinearity strengths over a wide interval, and by averaging results over many disorder realizations. Our results agree quite well with our theoretical expectations for the existence of the weak and strong chaos regimes.
The main outcome of our study is that in the presence of nonlinearities we always observe subdiffusive spreading, so that the second moment grows initially asm2 ∼tαwithα <1, showing signs of a crossover to the asymptoticm2∼t1/3law at larger times. Remarkably, subdiffusive spreading is also observed for large disorder strengths, when the localization volume (which defines the number of interacting partner modes) tends to one. Fr¨ohlich-Spencer-Wayne models, which
take the disorder strength to its infinite limits, are also showing subdiffusive growth. Most remarkably, in none of our studies (except the artificial LNL case) did we encounter a slowing down of spreading beyond the limits set by the weak chaos predictions. Therefore, our numerical data support the conjecture that the wave packets, once they spread, will do so up to infinite times in a subdiffusive way, bypassing Anderson localization of the linear wave equations.
The only cases where spreading shows a tendency to stop are the LNL models, for which nonlinearities are absent everywhere except inside a finite-size central region where the initial wave packet is launched. In these models, when wave packets have spread substantially, their chaotic component in the central region of the lattice becomes weak, and distant normal modes in the linear parts of the system are exponentially weakly coupled to the central nonlinear region. When the nonlinearity strength tends to smaller values, waiting (detrapping) times for wave packet spreading of compact initial excitations increase beyond the detection capabilities of our computational tools. The corresponding question of whether a KAM regime can be entered at finite nonlinearity strength was addressed in [12] and is analyzed in detail in a forthcoming work [29].
ACKNOWLEDGMENTS
We thank S. Aubry, S. Fishman, M. Mulansky, A. Pikovsky, R. Schilling, and D. Shepelyansky for useful discussions. Ch.S. was partly supported by the European research project “Com-plex Matter,” funded by the GSRT of the Ministry Education of Greece under the ERA-Network Complexity Program.
APPENDIX: SYMPLECTIC INTEGRATION OF THE DNLS EQUATIONS
We discuss a novel method which we designed to integrate the DNLS equations locally, which we shall call the ‘PQ’ method. Previously used methods employ a transformation of the wave function from real into Fourier space and back, at each integration step. These transformations induce small but observable corrections in the tails of the wave packet, which slowly but steadily grow in time. In such a case we will have to stop the integration once this noisy background reaches a substantial level. The PQ method avoids the generation of this background by simply not performing the Fourier transformation. Instead the PQ method integrates the DNLS equations in real space.
The canonical transformation
ψl=
1 √
2(ql+ipl) (A1) of the complex variableψlin Eq. (1) transforms (1) into
HD=
l
l
2
ql2+pl2+β 8
ql2+p2l2−(ql+1ql+pl+1pl), (A2)
where ql and pl are generalized coordinates and momenta,
respectively.
of the DNLS Hamiltonian (A2) into two separate Hamiltonian functionsAandBis
A=
l
l
2
ql2+p2l+β 8
ql2+p2l2,
(A3)
B = −
l
(ql+1ql+pl+1pl).
Hamiltonian A is integrable and the operator eτ LA which propagates the set of initial conditions (ql,pl) at time t to
their final values (ql,pl) at timet+τ is
eτ LA:
q
l =qlcos(αlτ)+plsin(αlτ),
pl=plcos(αlτ)−qlsin(αlτ),
(A4)
withαl=l+β(ql2+p2l)/2. HamiltonianB of Eq. (A3) is
not integrable, and thus the operatoreτ LB cannot be written explicitly. If we considerBas a separate Hamiltonian function and again split it asB=P +Q, the component parts
P = −
l
pl+1pl, Q= −
l
ql+1ql (A5)
are integrable, under the corresponding operators
eτ LP:
pl=pl,
ql =ql−(pl−1+pl+1)τ
(A6) and
eτ LQ:
q
l =ql,
pl=pl+(ql−1+ql+1)τ.
(A7)
This technique of splitting the Hamiltonian into multiple parts has been used in different applications of symplectic integrators (see, for example [30]).
In our simulations we successively apply the SBAB2 symplectic integrator [15,25,26] twice: first for the split (HD=A+B) of the DNLS Hamiltonian Eq. (A2) and
second for the split B=P +Q in Eq. (A3). The so-lution for the equations of motion from the Hamilto-nian Eq. (A2) is thus approximated by the application of 13 simple operators on an initial condition (ql,pl),
since
eτHD =eτ(A+B)≈ed1τ LAec2τ LBed2τ LAec2τ LBed1τ LA
≈ed1τ LAed1c2τ LPec22τ LQec2d2τ LPec22τ LQed1c2τ LPed2τ LA
×ed1c2τ LPec22τ LQec2d2τ LPec22τ LQed1c2τ LPed1τ LA, (A8)
with the SBAB2coefficients [25] ofd1 =1/6,d2 =2/3,and c2=1/2.
[1] P. W. Anderson,Phys. Rev.109, 1492 (1958).
[2] J. Billy, V. Josse, Z. Zuo, A. Bernard, B. Hambrecht, P. Lugan, D. Cl´ement, L. Sanchez-Palencia, P. Bouyer, and A. Aspect, Nature (London)453, 891 (2008).
[3] G. Roati, C. D’Errico, L. Fallani, M. Fattori, C. Fort, M. Zaccanti, G. Modugno, M. Modugno, and M. Inguscio,Nature (London) 453, 895 (2008).
[4] T. Schwartz, G. Bartal, S. Fishman, and M. Segev, Nature (London)446, 52 (2007).
[5] Y. Lahini, A. Avidan, F. Pozzi, M. Sorel, R. Morandotti, D. N. Christodoulides, and Y. Silberberg,Phys. Rev. Lett.100, 013906 (2008).
[6] R. Dalichaouch, J. P. Armstrong, S. Schultz, P. M. Platzman, and S. L. Mccall,Nature (London)354, 53 (1991);C. Dembowski, H.-D. Gr¨af, R. Hofferbert, H. Rehfeld, A. Richter, and T. Weiland,Phys. Rev. E60, 3942 (1999);J. D. Bodyfelt, M. C. Zheng, T. Kottos, U. Kuhl, and H.-J. St¨ockmann,Phys. Rev. Lett.102, 253901 (2009).
[7] M. I. Molina,Phys. Rev. B58, 12547 (1998).
[8] A. S. Pikovsky and D. L. Shepelyansky,Phys. Rev. Lett.100, 094101 (2008).
[9] S. Flach, D. O. Krimer, and Ch. Skokos,Phys. Rev. Lett.102, 024101 (2009).
[10] D. M. Basko, Ann. Phys.36, 1577 (2011).
[11] I. Bˇrezinov´a, L. A. Collins, K. Ludwig, B. I. Schneider, and J. Burgd¨orfer,Phys. Rev. A83, 043611 (2011).
[12] M. Johansson, G. Kopidakis, and S. Aubry,Europhys. Lett.91, 50001 (2010).
[13] A. Pikovsky and S. Fishman,Phys. Rev. E83, 025201(R) (2011).
[14] S. Fishman, Y. Krivolapov, and A. Soffer,Nonlinearity22, 2861 (2009).
[15] Ch. Skokos, D. O. Krimer, S. Komineas, and S. Flach,Phys. Rev. E79, 056211 (2009).
[16] G. Kopidakis, S. Komineas, S. Flach, and S. Aubry,Phys. Rev. Lett.100, 084103 (2008).
[17] D. O. Krimer and S. Flach, Phys. Rev. E 82, 046221 (2010).
[18] Ch. Skokos and S. Flach,Phys. Rev. E82, 016208 (2010). [19] T. V. Laptyeva, J. D. Bodyfelt, D. O. Krimer, Ch. Skokos, and
S. Flach,Europhys. Lett.91, 30001 (2010). [20] S. Flach,Chem. Phys.375, 548 (2010).
[21] B. Kramer and A. MacKinnon, Rep. Prog. Phys. 56, 1469 (1993).
[22] J. Fr¨ohlich, T. Spencer, and C. E. Wayne,J. Stat. Phys.42, 247 (1986).
[23] H. Veksler, Y. Krivolapov, and S. Fishman,Phys. Rev. E80, 037201 (2009).
[24] S. Aubry and R. Schilling,Physica D283, 2045 (2009). [25] J. Laskar and P. Robutel,Celest. Mech. Dyn. Astron. 80, 39
(2001).
[26] Ch. Skokos and E. Gerlach,Phys. Rev. E82, 036704 (2010). [27] W. S. Cleveland and S. J. Devlin,J. Am. Stat. Assoc.83, 596
(1988).
[28] M. Mulansky, K. Ahnert, and A. Pikovsky,Phys. Rev. E83, 026205 (2011).
[29] M. V. Ivanchenko, T. V. Laptyeva, and S. Flach (in preparation). [30] K. Go´zdziewski, S. Breiter, and W. Borczyk, Mon. Not. R.
MASSEY RESEARCH ONLINE
http://mro.massey.ac.nz/
Massey Documents by Type Journal Articles
![FIG. 1. (Color online) DNLS, Wlines) andthe smoothedof wave packets with initial widthbrown]](https://thumb-us.123doks.com/thumbv2/123dok_us/8499998.347220/5.608.59.555.74.322/color-online-wlines-andthe-smoothedof-packets-initial-widthbrown.webp)
![FIG. 6. (Color online) FSW: Evolution of (a) ⟨initially compact wave packets of widthred curve] andred curve] andlog10 m2(t)⟩ [(r) ⟨log10 P(t)⟩ [(b) blue curve], (b) ⟨ζ(t)⟩, (c) αm(t) [(r) αP (t) [(b) blue curve], and (d) ⟨HL(t)⟩ vs log10 t for L = 21 with E = 0.05.](https://thumb-us.123doks.com/thumbv2/123dok_us/8499998.347220/8.608.54.553.445.693/online-evolution-initially-compact-packets-widthred-andred-andlog.webp)
