Greenfield tunnelling in sands: the effects of soil density
and relative depth
A. FRANZA, A. M. MARSHALL†and B. ZHOU‡
Tunnel construction is vital for the development of urban infrastructure systems throughout the world. An understanding of tunnelling-induced displacements is needed to evaluate the impact of tunnel construction on existing structures. Recent research has provided insight into the complex mechanisms that control tunnelling-induced ground movements in sands; however, the combined influence of relative tunnel depth and soil density has not been described. This paper presents data from a series of 15 plane-strain centrifuge tests in dry sand. The cover-to-diameter ratio,C/D, of the tunnels ranges between 1·3 and 6·3, thereby including relatively shallow and deep tunnels. The sand relative density varies between 30 and 90%, corresponding to loose and dense soils. The effects ofC/D, soil density and volume loss on vertical and horizontal soil movements, shear strains and ground reaction curves are discussed. Analysis of surface and subsurface settlement trough characteristics shows that the mechanisms are non-linear and the effects of soil relative density and volume loss on deformation patterns are highly dependent onC/D. The role of soil arching in the definition of the displacement mechanisms and a discussion of the implications of the results to the assessment of damage to existing structures are also provided.
KEYWORDS: centrifuge modelling; sands; settlement; tunnels & tunnelling
INTRODUCTION
Current needs for infrastructure development in urban areas require the construction of new tunnels. Because the exca-vation of new tunnels results in ground movements that affect existing surface and buried structural systems, engineers need to estimate the magnitude and distribution of greenfield displacements. In particular, prediction of the settlement trough shape is necessary because of the potential to induce differential settlements on structures; for instance, a narrow settlement trough (high curvature) with large maximum settle-ment has a significant potential to cause structural damage.
Ground movements due to greenfield tunnelling in undrained clay are generally well understood (Mairet al., 1993; Mair & Taylor, 1997; Grant & Taylor, 2000). However, the available data for ground movements above tunnels in coarse-grained soils from case studies (Dyer et al., 1996; Sagaseta et al., 1999; Fargnoli et al., 2013) and centrifuge tests (Vorsteret al., 2005; Marshall et al., 2012) are rather limited. A greater variability of the characteristics of settlement troughs above tunnels in sands has been noted within the literature (e.g. Mair & Taylor (1997), who reported a typical range of surface settlement trough width parameter of 0·25–0·45, but values as high as 1·0 were also provided). The causes for this variability are not well known; this is one of the motivations behind the research presented here.
There have been numerous investigations of tunnelling effects on pipelines and buildings that have incorporated data related to sandy soils (Klaret al., 2007, 2015; Farrellet al., 2014; Giardinaet al., 2015; Franza & Marshall, 2017; Ritter et al., 2017). A critical component to these interaction analyses is the greenfield input; however, there remains a lack of understanding of the impact of soil density and relative tunnel depth on greenfield ground displacements for tunnels constructed in drained sandy ground.
The aim of this paper is to address these shortcomings by examining data obtained from 15 geotechnical centrifuge tests of tunnel construction in sand. The paper is structured as follows. Available empirical methods for the prediction of settlement trough shape are first summarised. An overview of the centrifuge test programme is then presented. Experimental data are used to demonstrate the main effects of cover-to-diameter ratio (C/D), soil relative density (Id) and tunnel volume loss (Vl,t) on greenfield ground movements. In particular, ground reaction curves (i.e. the change of internal tunnel pressure with tunnel volume loss) as well as ground displacements and strains around the tunnel are presented. The influence of soil arching on the displacement mechanism and volumetric strains is also discussed. Subsequently, empirical expressions are fitted to surface and subsurface settlement through data so that the charac-teristics of the settlement trough profiles can be analysed. Finally, the implications of results to the assessment of damage to existing surface and buried structures are provided.
EMPIRICAL METHODS
Tunnelling-induced ground movements are often described at a given depth by empirical formulas and ground loss parameters. Considering plane-strain conditions transverse to the tunnel direction, the magnitude of ground loss is commonly expressed with two parameters: tunnel volume loss,Vl,t, and soil volume loss,Vl,s. The concept of ground loss is illustrated in Fig. 1(a). Soil volume loss is defined asVl,s¼Vs/V0100, whereVsis the volume of the
Department of Engineering, University of Cambridge, UK;
Formerly, Faculty of Engineering, University of Nottingham, UK (Orcid:0000-0002-8510-0355).
†Faculty of Engineering, University of Nottingham, UK (Orcid:0000-0003-1583-1619).
‡Formerly, Faculty of Engineering, University of Nottingham; now Shanghai Civil Engineering Co., Ltd of China Railway Group Ltd, Shanghai, P. R. China.
Manuscript received 6 April 2017; revised manuscript accepted 21 May 2018.
Discussion on this paper is welcomed by the editor.
settlement trough per unit length of tunnel and V0 is the notional final area of the tunnel cross-section. In experi-mental, analytical and numerical studies, the ground loss is modelled through the tunnel volume loss, Vl,t¼ΔV/V0100; the ratio between the ground loss at the tunnel periphery,ΔV, andV0, expressed as a percentage.Vsis generally based on surface settlements because of their relative ease of measurement. In field studies, the true value of Vl,t is unknown. However, for tunnels constructed in clayey ground under undrained (constant volume) con-ditions,Vl,t¼Vl,s, so surface measurements can be used to evaluate volume loss at any depth. This is not the case for tunnels in drained granular soil where Vl,t=Vl,s; the relationship between the two is affected by soil volumetric strains, which depend on ground conditions, the magnitude of shear strains and confining stress (Marshallet al., 2012). Finally, it should be noted that, for shallow tunnels, previous work has demonstrated that very little ground movement occurs below the tunnel invert; ground loss is distributed according to a roughly elliptical shape in clays (Rowe & Kack, 1983; Loganathan & Poulos, 1998) and is concen-trated at the tunnel crown in sands (Zhou, 2014; Marshall & Franza, 2017) (see Fig. 1(b)).
The focus of this paper is on ground settlements (i.e. vertical movements). In clays, ground settlements, uz,
generally conform to a standard Gaussian curve, with the maximum settlement,uz,max, and the horizontal distance of the inflection point,i, defining the curve
uz¼uz;maxexp x2 2i2
ð1Þ
The value ofiwas found to be proportional to the vertical distance between the tunnel axis depth,zt, and the depth of interest,z, through the width parameterK
i¼K zð tzÞ ð2Þ
where the parameterKwas defined in relation to the relative depthz/zt(Mairet al., 1993)
K¼050325ðz=ztÞ
1z=zt ð
3Þ
It is worth noting that Jones (2010) showed that the Mair et al. (1993) expression can overestimate the value ofK for deep tunnels. Based on field data measurements, Jones proposed a logarithmic formula for the prediction of K which depends on the height above the tunnel ztzrather than the relative depthz/zt. This results in a decrease ofKat the surface asztis increased.
In sandy soils, the use of the modified Gaussian curve rather than a standard Gaussian curve was suggested by Vorster et al. (2005) to obtain a better fit to settlements induced by shallow tunnels:
uz ¼uz;max
n
n1
ð Þ þexphαðx=iÞ2i
n¼eα2α1 2αþ1þ1
ð4Þ
whereα is a fitting parameter. In particular, the additional degree of freedom represented byαallows for more effective curve fitting for narrow settlement troughs. Several studies have highlighted that, in sandy soils, the width parameteri increases with the cover-to-diameter ratio, C/D, and de-creases with the magnitude of volume loss,Vl,t (Sugiyama et al., 1999; Marshallet al., 2012; Zhouet al., 2014).
EXPERIMENTAL PROGRAMME
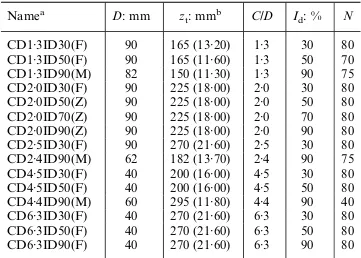
To investigate the combined effect of the cover-to-diameter ratio,C/D, and the relative density,Id, a series of plane-strain tunnelling centrifuge tests was performed using a dry silica sand. The value ofC/Dranged between 1·3 and 6·3, thereby including relatively shallow and deep tunnels. Tests were performed on uniform loose (Id¼0·3), medium-dense (Id¼0·5 and 0·7) and dense (Id¼0·9) sands. Tests are labelled according to theirC/Dratio andId(i.e. a test with C/D= 6·3 andId= 0·9 is labelled CD6·3ID90). Most analyses in this paper are limited to the volume loss rangeVl,t= 0–5% (with the exception of data relating to tunnel inner pressure and ground losses); therefore collapse conditions were not necessarily reached.Vl,t= 1, 2, 3 and 5% are referred to as low, medium, high and extremely high volume losses, respectively. Note that this dataset includes newly collected data from Franza (2016) and Zhou (2014) using the University of Nottingham centrifuge (groups F and Z), as well as results from Marshallet al. (2012) obtained using the Cambridge University centrifuge (group M –see Table 1). Groups F, Z and M were performed with the same soil and equivalent tunnel modelling techniques. Further details on the centrifuge equipment are provided in the next section.
It should be noted that this dataset does not account for the effects of confining stress because the tunnel depth is represented in normalised form asC/D. For instance, a tunnel withD¼3 m andC¼9 m has the sameC/Das a tunnel with D¼6 m andC¼18 m. The levels of soil dilation around the deeper tunnel would be less than for the shallow tunnel, which would affect the characteristics of the settlement troughs above the tunnel. However, as the problem is limited to a reasonable domain (C/D,6·3 and prototypezt,20 m), the effects of stress level should be secondary.
EXPERIMENTAL SET-UP AND SPIN-UP EFFECTS The centrifuge tests were performed in plane-strain conditions with a model tunnel buried at varying depths
ΔV: Idealised
tunnel ground loss Inflection
point
Vs: Soil
ground loss zt
i Centreline
Springline
Invert Crown
Tunnel
(a)
(b)
In clays In sands
uz,max
z, uz x, ux
C
D
Fig. 1. (a) Illustration of soil and tunnel ground losses; (b) typical tunnel ground loss distributions for shallow tunnels
to achieve a target value of C/D. The adopted Nglevel of each test is reported in Table 1, where N is the centrifuge acceleration scale factor. The centrifuge package includes a strong box, soil, a model tunnel and a tunnel volume control system (refer to Marshall (2009), Zhou (2014) and Franza (2016) for full details). A dry silica sand known as Leighton Buzzard fraction E was used for testing. The model tunnel consisted of a cylinder with enlarged ends covered by a sealed latex sleeve. The annular gap between the sleeve and cylinder was filled with water. The tunnelling process (i.e. Vl,t) was simulated by extracting water from the annular gap using a volume control system. The centrifuge strongbox consisted of a U-channel, a poly(methyl methacrylate) (PMMA) front wall and a metallic back wall; front and back walls were designed to ensure plane-strain conditions along the tunnel direction and minimise out-of-plane deformations. The transparent PMMA wall allowed for digital images to be taken at each increment ofVl,tfor subsequent analysis using GeoPIV (Whiteet al., 2003) to determine subsurface ground movements.
During the spin-up of the model, ground movements at the tunnel periphery are induced by the stress imbalance between the model tunnel and the surrounding soil (Ritter et al., 2018). This results in the ovalisation and buoyancy of the model tunnel during the spin-up phase, as well as soil densification and a variation of the soil relative density,ΔId (Zhou, 2014). The overall impact of these issues on greenfield test outcomes was deemed to be minimal; for instance, for test CD2·0ID50 (medium-dense sand), Zhou (2014) reported an average soil densification ofΔId þ1% at the surface and a maximumΔId þ5% at the tunnel crown.
GROUND REACTION CURVES
Atkinson & Potts (1977) provided a thorough evaluation of tunnel support pressure corresponding to the state of soil failure and proposed upper and lower bound solutions for its prediction. The pre-collapse transition of tunnel pressure with volume loss (i.e. the ground reaction curve (GRC)) is also of interest. GRCs for tunnels in cohesionless soils were suggested and compared against numerical analyses by Wong & Kaiser (1991), whereas Dewoolkaret al. (2007) and Iglesia et al. (2014) conducted investigations based on centrifuge modelling of a trapdoor. There have not been extensive centrifuge test investigations of the GRC for tunnels in
cohesionless soils. The data presented here give a unique illustration of the effect of tunnelC/Dratio and soil relative density on the GRC based on centrifuge test results.
Figure 2(a) shows the variation of σnorm, the normalised (to account for the differences of soil density and tunnel diameter between tests) model tunnel pressureσtat the tunnel axis level
σnorm¼ σ
t
ρgND ð5Þ
where ρ is the density of the soil; g is acceleration due to gravity; andDis the model tunnel diameter. In Fig. 2(b),σtis normalised by the initial tunnel pressure,σt,0, to evaluate the relative reduction of the initial pressure. The reaction curve of test CD4·4ID90 was omitted because of an anomalous trend.
These reaction curves are, at least partially, the conse-quence of soil arching (i.e. the mobilisation of shearing resistance of the soil). The general trend of the reaction curves may be interpreted using the evolution of arch mechanisms postulated by Iglesiaet al. (2014) and illustrated in Fig. 3. Because the load on the tunnel is mostly due to the weight of the soil beneath the arch, the formation of the initial curved configuration allows for a drop of tunnel pressure. Then, the transition to a triangular arch and, possibly, to a rectangular mechanism for shallow tunnels results in the increase of tunnel pressure because more of the ground is without support (i.e. beneath the arch).
Figure 2(a) shows that, overall,σnormincreases withC/D and reduces with soil density for a givenVl,t. The reaction curve shape is shown to be influenced by the soil relative
Table 1. Summary of centrifuge tests for greenfield tunnelling in model scale dimensions
Namea D: mm z
t: mmb C/D Id: % N
CD1·3ID30(F) 90 165 (13·20) 1·3 30 80
CD1·3ID50(F) 90 165 (11·60) 1·3 50 70
CD1·3ID90(M) 82 150 (11·30) 1·3 90 75
CD2·0ID30(F) 90 225 (18·00) 2·0 30 80
CD2·0ID50(Z) 90 225 (18·00) 2·0 50 80
CD2·0ID70(Z) 90 225 (18·00) 2·0 70 80
CD2·0ID90(Z) 90 225 (18·00) 2·0 90 80
CD2·5ID30(F) 90 270 (21·60) 2·5 30 80
CD2·4ID90(M) 62 182 (13·70) 2·4 90 75
CD4·5ID30(F) 40 200 (16·00) 4·5 30 80
CD4·5ID50(F) 40 200 (16·00) 4·5 50 80
CD4·4ID90(M) 60 295 (11·80) 4·4 90 40
CD6·3ID30(F) 40 270 (21·60) 6·3 30 80
CD6·3ID50(F) 40 270 (21·60) 6·3 50 80
CD6·3ID90(F) 40 270 (21·60) 6·3 90 80
a
Group in brackets. F: Franza (2016); Z: Zhou (2014); M: Marshall
et al. (2012).
b
Prototype scale dimension in brackets.
0 1 2 3 4 5 6 7 8 0
1 2 3 4 5 6 7 8
(a)
σt
/(
ρ
g
ND
)
Vl,t: %
0 1 2 3 4 5 6 7 8
Vl,t: %
CD1·3 CD2·0 CD2·4 CD4·4 CD6·3 Marker
0 0·2 0·4 0·6 0·8 1·0
(b)
σt
/
σt,0
Id = 0·3
Id= 0·9 Line style
Fig. 2. (a) Normalised tunnel pressure and (b) relative tunnel pressure with tunnel volume loss
Effective width,
B
Trapdoor
Overb
urd
en dep
th,
H
2
1 3
1 Curved arch
2
3
Triangular arch
Rectangular mechanism
Φ
Average pressure, p
Displacement, δ
Φ Friction angle
Fig. 3. Qualitative arching mechanisms above a trapdoor at (1) relatively small, (2) intermediate and (3) large displacements, as postulated by Iglesiaet al. (2014)
density in Fig. 2(b); loose soils show a more gradual decline of pressure up to high volume losses, whereas dense soils induce a steep drop of tunnel pressure within low–medium volume losses (1–2%, depending on C/D), followed by reasonably stable values under further increases of Vl,t. These results are consistent with the arch mechanism displayed in Fig. 3; the greater the density, the greater the peak friction angle and, thus, the smaller the initial arch (zone 1). The trends can also be inferred from the known stress–strain response of cohesionless soils; highIdvalues are associated with a stiff shear response to peak strength and subsequent strain softening, whereas lowIdsoils have lower stiffness and exhibit strain hardening. Additionally, the minimum pressure occurs at different volume loss values depending onIdandC/D(the greaterC/Dand/or the looser the soil, the higher theVl,t corresponding to the minimum pressure). Finally, the data in Fig. 2(b) illustrate that collapse, which results in a load recovery stage (increase of σt), is initiated after 5% volume loss for shallow tunnels in dense sand (C/D¼1·3; Id¼0·9), whereas no load recovery was observed forC/D2·4 within the investigated range ofVl,t. The tunnel pressures at extremely high volume losses (Vl,t.5%) can be compared against the upper and lower bound theorem predictions of Atkinson & Potts (1977). Using these solutions with friction angles of 32° (critical state) and 45° (peak) provides ultimate upper bounds
σnorm= 0·18 and 0·08, respectively, and lower bounds
σnorm= 0·34 and 0·18, respectively. Atkinson & Potts (1977) showed that these predictions bounded their experimental data obtained using an air-filled model tunnel and dense sand. Many of the ultimate pressures in Fig. 2(a) fall outside these bounds; however, there are some important distinctions between the tests described here and those used by Atkinson & Potts (1977). First, the use of water within the model tunnel (which enables an accurate determination of tunnel volume loss) imposes a hydrostatic pressure distribution on the tunnel lining; hence the tunnel pressure at the crown is lower than at the axis depth (as plotted in Fig. 2(a)). This feature, as well as the constant-volume condition of the water inside the model tunnel, will have an impact on how and where failure occurs within the soil around the tunnel. In addition, for the loose soil, the strain levels required to mobilise ultimate strengths are considerable and the failure state relevant to the bound theorem predictions would not have been reached at the volume losses plotted in Fig. 2.
With respect to the trapdoor-based findings of Dewoolkar et al. (2007) and Iglesia et al. (2014), the results in Fig. 2 confirm that minimum relative loadings (σt,min/σt,0) decrease with the increase of C/D and that σt,min slightly decreases with the increase in Id. However, it is not true that in tunnelling a higher arch efficiency, associated with the minimum loadingσt,min, is mobilised at a constant value of Vl,tregardless ofIdandC/D. The relationship betweenVl,t and σt,min suggests that a higher Vl,t is required to fully mobilise the arch (if the arch can form) for (i) relatively deep tunnels compared to shallow ones and (ii) looser soils. Additional evidence of the importance of soil arching during tunnelling in sands is provided in subsequent sections.
DISPLACEMENT AND STRAIN MECHANISMS In this section, tunnelling-induced soil movements and strains (engineering shear strain,γ, and volumetric strain,εv) are presented and related to the previously mentioned arching mechanisms. The term ‘shear strain’ refers to engineering shear strain. Contractive volumetric strains are defined as positive in this paper (i.e. εv.0 is contraction;
εv,0 is dilation) and positive horizontal displacements are oriented towards the tunnel centreline. The GeoPIV
measurements of displacements were used to determine strains assuming plane-strain conditions. As statistically quantified by Marshall & Mair (2011) for test CD2·4ID90, this procedure results in calculated strain values being sensitive to small errors in the GeoPIV displacement data. They showed that for normally distributed horizontal and vertical displacement data with standard deviations in precision of 2·8μm and 5·6μm, respectively (based on particle image velocimetry (PIV) data), a standard deviation of 0·09% and 0·08% was obtained for shear and volumetric strains, respectively. They suggested that one standard deviation was an appropriate level of error to consider for the calculated strains.
In the plots of ground movements and strains, vertical settlements and spatial coordinates are normalised, respect-ively, byVl,tDandzt. Normalising settlements in this way enables comparison of the magnitude and distribution of ground movements between tests with different tunnel sizes and at different values ofVl,t. Measurements greater or lower than the indicated contour thresholds were set equal to the closer limit value. In the regions where data were not available, the displacement and strain values were set equal to zero (e.g. around the tunnel). Based on the outcomes of Marshall & Mair (2011) and the level of scatter in the strain data, values between0·1% and +0·1% were also set equal to zero.
The effects of cover-to-diameter ratio
Figure 4 presents horizontal (left) and vertical (right) displacement data for C/D = 1·3–4·4 and Id¼0·9 (dense sand) atVl,t¼3%, while Fig. 5 plots the resulting shear and
z/
zt
z/
zt
z/
zt
x/zt x/zt
ux/(Vl,t D): % uz/(Vl,t D): %
Vl,t = 3·0%
0 0·5 1·0 1·5 0
0·5
1·0
1·5
0
0·5
1·0
1·5
0
0·5
1·0
1·5
0 0·02 0·06 0·10
Vl,tVl,t =3·0%= 3·0%
0 0·5 1·0 1·5
0 0·5 1·0
1·5 0 0·5 1·0 1·5
0 0·5 1·0
1·5 0 0·5 1·0 1·5
0 0·1 0·3 0·5
C/D = 1·3
Id= 0·9
C/D = 2·4
Id= 0·9
C/D = 4·4
Id= 0·9
Vl,t = 3·0% Vl,t = 3·0%
Vl,t = 3·0% Vl,t = 3·0%
Fig. 4. Normalised horizontal (left) and vertical (right) displacements atVl,t= 3% forId= 0·9 and varyingC/D
volumetric strains (readers may also refer to Figs S2 and S3 in the online supplementary data for results relating to low and high volume losses). The effect of C/D for dense soil was largely covered by Marshall et al. (2012), and can be summarised as follows. (i) The lower the value ofC/D, the greater the size of the region exhibiting large normalised settlements and shear strains. (ii) Vertical displacements for shallow tunnels are localised near the tunnel centreline, whereas they are more spread out for deep tunnels; this results in wider settlement troughs and a decrease of the normalised settlement magnitude for deeper tunnels. (iii) The deformation pattern becomes narrower with volume loss (i.e. more concentrated near the tunnel centreline). (iv) At low Vl,t, the dense soil undergoes overall contraction because of the low magnitudes of shear strains, whereas at highVl,t, the region of soil around the tunnel crown is characterised by high shear strains which, because of the high relative density, results in dilative strains for an increment ofVl,t(this feature is also highlighted later in Fig. 9 where soil volume loss is plotted against tunnel volume loss).
The effects of soil relative density
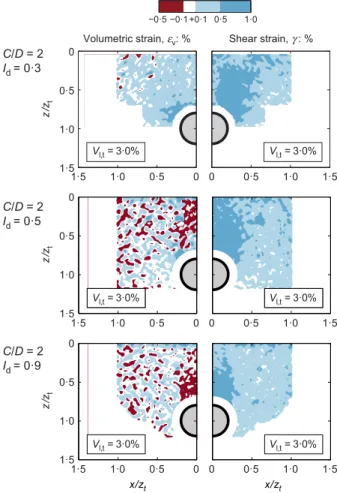
Previous studies have not explicitly considered the effect of soil relative density on ground deformations caused by tunnelling. Data from centrifuge tests with varying relative density (Id¼0·3, 0·5 and 0·9) at a constant C/D¼2·0 are plotted forVl,t¼3% in Figs 6 and 7 (readers may also refer to Figs S4 and S5 in the online supplementary data for results relating to low and high tunnel volume losses). Fig. 6 shows that, for a given value ofVl,t, larger settlements should be expected in looser sands. The settlement pattern is also affected by relative density. ForId¼0·9, the localised zone of large settlements is concentrated around the tunnel periphery
z/
zt
Volumetric strain, εv: %
Vl,t= 3·0% 0
0·5
1·0
1·5
−0·5 −0·1+0·1 0·5 1·0
Shear strain, γ: %
C/D = 1·3
Id= 0·9
z/
zt
z/
zt
x/zt x/zt
0·5
1·0
1·5
C/D = 2·4
Id= 0·9
C/D = 4·4
Id= 0·9
Vl,t=3·0%
0 0·5 1·0 1·5 0
0·5
1·0
1·5 0
Vl,t=3·0%
0 0·5 1·0 1·5
0 0·5 1·0
1·5 0 0·5 1·0 1·5
0 0·5 1·0
1·5 0 0·5 1·0 1·5
Vl,t= 3·0%
Vl,t= 3·0% Vl,t= 3·0%
Vl,t= 3·0% Vl,t= 3·0%
Fig. 5. Volumetric (left) and shear (right) strains at Vl,t= 3% for Id= 0·9 and varyingC/D
z
/
zt
ux/(Vl,tD): % uz/(Vl,tD): %
Vl,t= 3·0%
0 0·5 1·0 1·5 0
0·5
1·0
1·5
z
/
zt
z
/
zt
x/zt x/zt 0
0·5
1·0
1·5
0
0·5
1·0
1·5
0 0·02 0·06 0·10
Vl,t=3·0%
0 0·5 1·0 1·5
0 0·5 1·0
1·5 0 0·5 1·0 1·5
0 0·5 1·0
1·5 0 0·5 1·0 1·5
0 0·1 0·3 0·5
C/D = 2
Id= 0·3
C/D = 2
Id= 0·5
C/D = 2
Id= 0·9
Vl,t= 3·0%
Vl,t= 3·0% Vl,t= 3·0%
Vl,t= 3·0% Vl,t= 3·0%
Fig. 6. Normalised horizontal (left) and vertical (right) displacements atVl,t= 3% forC/D= 2·0 and varyingId
z/
zt
Volumetric strain, εv: %
Vl,t = 3·0%
0 0·5 1·0 1·5 0
0·5
1·0
1·5
z/
zt
0
0·5
1·0
1·5
z/
zt
0
0·5
1·0
1·5
−0·5 −0·1 +0·1 0·5 1·0
Shear strain, γ: %
0 0·5 1·0 1·5
0 0·5 1·0
1·5 0 0·5 1·0 1·5
0 0·5 1·0
1·5 0 0·5 1·0 1·5
C/D = 2 Id= 0·3
C/D = 2 Id= 0·5
C/D = 2 Id= 0·9
Vl,t=3·0% Vl,t=3·0%
x/zt x/zt
Vl,t = 3·0%
Vl,t = 3·0% Vl,t = 3·0%
Vl,t = 3·0% Vl,t = 3·0%
Fig. 7. Volumetric (left) and shear (right) strains at Vl,t= 3% for C/D= 2·0 and varyingId
(indicating the delineation of an arch) and a relatively narrow settlement profile extends to the surface, whereas forId¼0·5 a larger region of ground experiences large settlements (associated with a larger arch) and the expanse of settlements at the surface increases. For the loose soil (Id¼0·3), there is no clear evidence of an arch forming and the normalised settlements at the surface are wider than for the denser soil tests. A full statistical regression of settlement curves is provided in a later section.
The following observations can be made with respect to the variation of strain distribution with soil density (Fig. 7) and its relationship with ground settlements. (i) For the dense sand (CD2·0ID90), the soil arch becomes apparent at high volume loss, which reduces the tendency for tunnel volume loss to propagate to the surface. The zone of large shearing concentrated beneath the soil arch results in soil dilation (that decreases the ratioVl,s/Vl,t; discussed in detail later). (ii) For the medium dense sand (CD2·0ID50), the arching mechanism is similar to the dense sand test, although the zone of large shear strain is close to the surface at Vl,t¼3%, suggesting that the arch is close to failure. Its size is greater than for test CD2·0ID90 because of the lower peak soil strength associated with lower soil density, as postulated by Iglesiaet al. (2014). (iii) In the loose sand data (CD2·0ID30), the soil does not mobilise a closed arch and a mechanism with near-vertical ear-shaped shear bands at the tunnel shoulders is discernible. The soil above the tunnel moves downwards as a near-rigid body (there are no shear strains close to the tunnel centreline). The inability of the loose soil to form an arch results in a settlement field for Id¼0·3 that is qualitatively different than forId¼0·5 and 0·9. Wong & Kaiser (1991) identified a tunnelling-induced mode of behaviour for cohesionless soils (for at-rest stress ratios lower than unity) that is initiated by localised soil yielding at the tunnel shoulders and develops, for further stress relief withinthe tunnel, with either (i) ear-shaped shear bands intercepting the ground surface or (ii) yielding of the roof (i.e. soil above the tunnel crown). These two yielding mechanisms match well to the shear strain distributions measured in the centrifuge tests for loose and dense sands, respectively. However, Wong & Kaiser (1991) did not relate these mechanisms to the soil relative density.
Figure 6 (as well as Fig. S4 in the online supplementary data) also provides insight into the distribution of hori-zontal movements. For the medium dense and dense sands (Id= 0·5–0·9), normalised horizontal movements can be significant both near the surface and the tunnel shoulders (similar to the mechanism illustrated in Fig. 4). The online supplementary data also demonstrate that, as volume loss increases, normalised horizontal displacements either decrease or remain relatively constant near the surface, and increase above the tunnel crown. For Id¼0·3, the distribution of normalised horizontal movements is mostly induced near the surface. This difference can be related to the settlement mechanism; the onset of subsurface horizontal displacements corresponds to the concentration of settlements at the tunnel crown. Therefore, horizontal displacements near the tunnel shoulders should only be significant in medium dense/dense sands above medium-level volume losses (i.e.2%).
Summary of displacement mechanisms and soil arching The soil arching phenomenon plays a major role in the definition of tunnelling-induced displacement mech-anisms in sands. In particular, it can help to explain: (i) the transition from a narrow to a wide displacement field as C/D increases; (ii) the narrowing of the displacement field withVl,t; and (iii) the complex variation of settlement profile with soil density.
Arching mechanisms are summarised in Fig. 8. A closed arch can form in medium dense and dense sands. If an arch forms, movements caused by tunnel ground loss tend to propagate vertically within the zone below the arch, resulting in a region between the tunnel and the arch characterised by large movements/strains and narrow settlement troughs. Above the arch, ground movements propagate upwards and outwards towards the surface, resulting in wider settlement troughs. The lower the soil density, the larger the size of the soil arch and the amount of soil affected by narrowing. In the case of deep tunnels, the arch is localised near the tunnel crown and the soil deformation pattern is relatively wide. For shallow tunnels, the arching affects a proportionally large zone of soil above the tunnel, resulting in a chimney-like displacement field with narrow settlement troughs. With the increase ofVl,t, the localised downwards movement of the soil between the tunnel crown and the arch as well as the evolution of the soil arch postulated by Iglesiaet al. (2014) (displayed in Fig. 3) results in the narrowing of the displacement field. In loose sands, the arch does not form and two separate zones of shearing propagate from the tunnel shoulders towards the surface. If the soil arch cannot form (as for tests withId¼0·3), ground loss propagates from the tunnel towards the surface both vertically and laterally.
TUNNEL AND SOIL VOLUME LOSSES
In sands, Vl,s and Vl,t differ because of the contractive/dilative strains that occur. In particular, at a given depthz, due to the summation of volumetric strains of the soil mass below this depth, (i) values ofVl,sgreater/lower thanVl,tare associated with a cumulative contractive/dilative soil response during the tunnel ground loss process, and (ii) the first derivative of the Vl,s against Vl,t trend being greater/lower than unity indicates an average incremental contractive/dilative volumetric strain response for the given increment of tunnel volume loss ΔVl,t. Note that the volumetric–shear strain relationship is also affected by soil
C/D effects on shear strains and soil arching
Shallow tunnel
C/D = 1–1·5
Intermediate tunnel
C/D = 2–4
Deep tunnel
C/D > 4
Ideffects on shear strains and soil arching
Dense sands
Id= 90%
Medium dense
sands Id= 60%
Loose sands
Id= 30%
Low shear strains High shear strains
Soil arch Id
= 90%
C
/
D
= 2·0
Funnel-like mechanism
Chimney-like mechanism
Arch mechanism
Arch mechanism
Arch mechanism
Arch mechanism
Main direction of propagation of the soil ground loss
Tunnel ground loss
Fig. 8. Sketches of Id and C/D effects on soil strains, arching mechanism and ground loss propagation
confining stress level, which is not considered in the following discussion.
The full dataset of tunnel and soil volume losses atz/zt¼0 (solid lines) and 0·5 (dashed lines) is shown in Fig. 9, where C/Dincreases with the darkness of lines. The ratio Vl,s/Vl,t (i) increases with C/D due to a lower shear strain level associated with highC/Dand (ii) decreases withVl,tbecause of higher shear strains (and dilation) at high volume losses (as suggested by Marshallet al. (2012)). In addition, these new data illustrate the trend and enable quantification of the decrease ofVl,s/Vl,tasIdincreases (due to the greater dilation in denser sands). Fig. 9 demonstrates that the relative density has a significant influence on the variation ofVl,s/Vl,t. Some context to these results may be obtained by considering the work of Ritteret al. (2017), who provided centrifuge test data on the effects of overlying structures (increased vertical stresses and varying shear strains) on these outcomes. For the low-rise buildings considered, the variation inVl,s/Vl,twas lower than the influence ofIdmeasured in this study.
Figure 9 also illustrates the effect of relative depth,z/zt.Vl,s is greater atz/zt¼0 than at the subsurface levelz/zt¼0·5 for all tests (except CD1·3ID90 atVl,t.5). This indicates that the overall soil behaviour within the range z/zt= 0–0·5 is contractive, regardless of the initial soil density; this can be explained by the low levels of shear strains in this region. Most of the dilative soil response is concentrated nearer the tunnel,–that is, atz/zt.0·5 (as illustrated in Figs 5 and 7). It should be noted that Vl,s,Vl,t at high volume losses for the shallowest tunnels (C/D= 1·3–2·5) in loose sands, as displayed in Fig. 9(a). This is somewhat contradictory to the expected response, since shearing of loose soils should result in contractive volumetric strains. It must be that, for these shallow tunnel cases, the lower levels of confining stress
within the ground above the tunnel enabled dilation to occur at higher volume losses.
ANALYSIS OF SETTLEMENT TROUGHS
In this section, the variation of settlement trough shape and magnitude with the main physical variables of the problem are assessed. The GeoPIV data were interpolated in Matlab with modified Gaussian curves using a least-squares regression technique.
Maximum settlements
Predictions of maximum settlement are often used within preliminary assessments of the risk of tunnelling to existing structures or infrastructure. The normalised maximum settle-ments, uz,max/D, measured at z/zt¼0 and 0·5 are plotted againstVl,tin Fig. 10 forId= 0·3, 0·5 and 0·9. The adopted normalisation allows comparison of results obtained with tunnels of different size. The results show that the value of uz,max/D generally increases with Vl,t, decreases with C/D and reduces with Id both at the surface and subsurface levels. However, the variation ofuz,max/D withId andC/D are not monotonic; they are complicated by the combined effects of soil arching (associated with the narrowing of settlement troughs close to the tunnel crown) and the dilative/ contractive behaviour of the soil. For instance, the differences in the rate of variation with Vl,t between loose and dense samples are probably due to the higher efficiency of the dense soil to create and maintain an arch, whereasuz,max/D being lower in CD1·3ID30 than in test CD2·0ID30 may be due to the absence of the soil arch for shallow tunnels in loose sand and the overall state of contraction of the soil.
CD1·3 CD2·0
CD2·4 CD4·4
CD6·3
z/zt= 0
0 1 2 3 4 5 6 7 8 9 10
0 1 2 3 4 5 6 7 8 9 10
(a)
Vl,t: %
Vl,s
: %
Vl,t: % Vl,t: %
CD1·3 CD2·0
CD2·4
CD4·4
CD6·3
z/zt = 0·5
0 1 2 3 4 5 6 7 8 9 10
0 1 2 3 4 5 6 7 8 9 10
(b)
0 1 2 3 4 5 6 7 8 9 10
0 1 2 3 4 5 6 7 8 9 10
(c) 1:1 line
Id = 0·3 Id = 0·5 Id = 0·9
Fig. 9. Vl,splotted againstVl,tforz/zt= 0 and 0·5: (a)Id= 0·3; (b)Id= 0·5; (c)Id= 0·9
0 1 2 3 4 5
0 1 2
uz,m
a
x
/
D
: %
Vl,t: %
0 1 2 3 4 5
0 1 2
CD1·3 CD2·0
CD2·4
CD4·4 CD6·3
z/zt = 0·5
0 1 2
CD1·3 CD2·0
CD2·4 CD4·4
CD6·3
z/zt = 0
(a)
Vl,t: % (b)
0 1 2 3 4 5
Vl,t: % (c)
Id = 0·3 Id = 0·5 Id = 0·9
Fig. 10. Variation of normalised maximum settlement withVl,t: (a)Id= 0·3; (b)Id= 0·5; (c)Id= 0·9
Settlement trough shape
The influence of C/D and Id on the settlement trough shape is illustrated in Fig. 11 where settlements, normalised by the maximum settlement at the tunnel centreline, are fitted with modified Gaussian curves. Results indicate that: (i) the higher theC/D, the wider the surface and subsurface settlement trough; (ii) the influence of soil density on the settlement trough shape is modest for shallow tunnels (C/D¼2·0), whereas greater effects are induced for relatively deep tunnels (C/D4·5); and (iii) higher volume losses result in narrower settlement troughs.
A quantitative assessment of the trough shape can be obtained using the values of i (hence K¼i/(ztz)) from the fitted modified Gaussian curves. First,Ks(i.e. the value of Kat the surface) is plotted againstVl,tin Fig. 12. The results demonstrate: (i) decreasing values of Ks with Id and Vl,t; (ii) a gradual reduction of the rate of change ofKswithVl,t (resulting in a non-linear trend); and (iii) the greater the value ofC/D, the greater the impact ofId, with soil density having a negligible effect for shallow tunnels (C/D¼1·3). However, owing to the complex combination of arching mechanisms
and volumetric strains (previously discussed), the trend inKs withIdforC/D¼2·0 is not monotonic and the results do not fully agree with point (i).
Subsurface values ofKare shown in Fig. 13 forVl,t= 1, 3 and 5%,Id¼0·3 and 0·9 (loose and dense sands). The plotted data confirm that, for any depthz/zt: (i) the greater the value ofVl,t, the lower the width parameterK; and (ii) the effect of density on settlement trough width is significant for high cover-to-diameter ratios. In addition, Fig. 13 displays that K at a given tunnel volume loss is approximately constant with depth for the shallower tunnels, whereas the width parameter increases non-linearly with depth for the relatively deep tunnels.
IMPLICATIONS OF RESULTS–DAMAGE
ASSESSMENT OF SURFACE AND BURIED STRUCTURES
Greenfield displacements are often used as an input for soil–structure interaction analyses or for preliminary risk assessments. In addition, the data presented here will be of
0
0·5
1·0
0
0·5
1·0
0
0·5
1·0 0
0·5
1·0
0
0·5
1·0
0
0·5
1·0
uz /uz
,m
a
x
uz /uz
,m
a
x
C/D = 2·0 C/D = 2·0
Id = 0·3 Id = 0·5 Id = 0·9
0 0·5 1·0
(d)
1·5
x/zt
0 0·5 1·0
(e)
1·5
x/zt
0 0·5 1·0
(f)
(a) (b) (c)
1·5
x/zt
Style
Modified Gaussian curve
Experimental
Colour
z/zt = 0; Vl,t = 1·0%
z/zt = 0; Vl,t = 5·0%
z/zt = 0·6; Vl,t = 1·0%
z/zt = 0·6; Vl,t = 5·0%
C/D = 2·0 C/D = 2·0
C/D = 4·5 C/D = 4·5 C/D = 4·4
Fig. 11. Comparison of normalised settlement trough curves for C/D= 2·0 and 4·5 for different Id: (a), (d)Id= 0·3; (b), (e) Id= 0·5; (c), (f)Id= 0·9
0 1 2 3 4 5
0 0·25 0·50 0·75 1·00 1·25 1·50
(a)
Vl,t: %
0 1 2 3 4 5
(b)
Vl,t: %
0 1 2 3 4 5
(c)
Vl,t: %
0 1 2 3 4 5 5
(d)
Vl,t: %
0 1 2 3 4
(e)
Vl,t: %
Ks
Id= 0·3
Id = 0·5
Id = 0·9
C/D = 1·3 C/D = 2 C/D = 2·4 C/D = 4·4 C/D = 6·3
Fig. 12. Variation ofKswithVl,tfor differentId: (a)C/D= 1·3; (b)C/D= 2; (c)C/D= 2·4; (d)C/D= 4·4; (e)C/D= 6·3
interest to the various researchers that use dry silica sand within centrifuge tests for the study of tunnel–structure interaction problems (e.g. Vorsteret al., 2005; Farrellet al., 2014; Giardinaet al., 2015; Nget al., 2015). In this section, the measured settlement troughs in the context of the damage assessment of surface and buried structures are discussed.
The width parameter at the surface (Ks) plotted in Fig. 12 varies between about 0·25 and 1·25, which contrasts con-siderably against a reference range ofKs= 0·25–0·45 (Mair & Taylor, 1997). This variation of Ks has the potential to significantly alter the outcomes of soil–structure interaction analyses. For instance, if a surface structure spanning the entire sagging region and a fixed tunnel depth are assumed, the relative soil–structure stiffness given by Giardina et al. (2015) (which is inversely proportional to the cube of the length in sagging/hogging) would vary by a factor of (20·25)3–(21·25)3= 0·13–15·6 in the sagging region – that is, two orders of magnitude. This range can result in the structure ranging from fully flexible to almost rigid.
The implications of these results may also be evaluated by considering the greenfield curvature,χ, of a settlement trough above the centreline of the tunnel. For pipelines buried above
a tunnel, the maximum bending moment induced by the tunnel for greenfield conditions can be calculated as Mmax,gf¼EIχ by assuming the pipeline behaves as a beam and that its deformed profile follows greenfield displace-ments (i.e. neglecting soil–structure interaction), where EI is bending stiffness. The curvature of the fitted modified Gaussian curves was calculated as χmg,sand¼2αuz,max/ni2 (Klaret al., 2015).
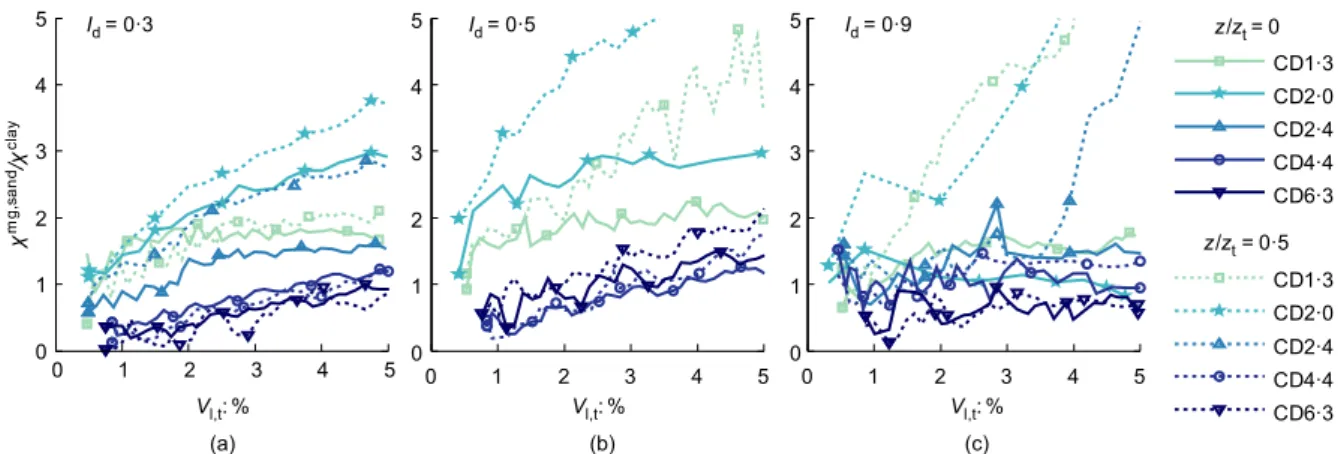
Figure 14 plots the measured values of curvature in a dimensionless form (to allow comparison between tests) usingDχmg,sand, whereDis tunnel diameter. Data shown in Fig. 14 illustrate that changes inC/DandVl,tcan affectχby several orders of magnitude. Following this, it is interesting to compare these data (for sand) to curvatures based on tunnels in clay. To do this, the maximum curvature of the ground above a tunnel in clay,χclay, atz/zt¼0 and 0·5 was evaluated usingVl,t¼Vl,swith equations (1)–(3). The curvature from the sand data was then normalised against the clay data as
χmg,sand/χclay, as shown in Fig. 15.
Figure 15 indicates that the increase in greenfield maximum curvature in sands with respect to clays is significant for shallow tunnels withC/D= 1·3–2·0, whereas
0
0·2
0·4
0·6
0·8 0
0·2
0·4
0·6
0·8
(d)
K
Vl,t = 1·0%
Vl,t = 3·0%
Vl,t = 5·0% 0
0·2
0·4
0·6
0·8
0
0·2
0·4
0·6
0·8 0
0·2
0·4
0·6
0·8
0 0·5 1·0 1·5 2·0 2·5
0 0·5 1·0 1·5 2·0 2·5
(e)
K
0 0·5 1·0 1·5 2·0 2·5
(f)
K
0 0·5 1·0 1·5 2·0 2·5
0
0·2
0·4
0·6
0·8
(a)
0 0·5 1·0 1·5 2·0 2·5
(b)
0 0·5 1·0 1·5 2·0 2·5
(c)
z
/
zt
z
/
zt
C/D = 1·3
Id = 0·3
C/D = 2·5
Id = 0·3
C/D = 6·3
Id = 0·3
C/D = 1·3
Id = 0·9
C/D = 2·4
Id = 0·9
C/D = 6·3
Id = 0·9
Fig. 13. Kagainst depthz/ztforId= 0·3 and 0·9: (a)C/D= 1·3,Id= 0·3; (b)C/D= 2·5,Id= 0·3; (c)C/D= 6·3,Id= 0·3; (d)C/D= 1·3,Id= 0·9; (e)C/D= 2·4,Id= 0·9; (f)C/D= 6·3,Id= 0·9
1 2 3
(a)
4 5
10−5 10−4 10−3 10−2 10−1 100
D
×
2
α
/n
×
uz,m
a
x
/i
2
Vl,t: %
1 2 3
(b)
4 5
Vl,t: %
1 2 3
(c)
4 5
Vl,t: %
CD1·3 CD2·0
CD2·4
CD4·4 CD6·3
z/zt = 0·5 CD1·3 CD2·0
CD2·4 CD4·4
CD6·3
z/zt = 0
Id = 0·3 Id = 0·5 Id = 0·9
the effects of soil density are limited. This latter observation is due to the counteracting effects of the narrowing of the settlement trough and reduction inVl,s/Vl,twithId.
These data can be incorporated into simplified soil– structure interaction analyses which consider the effect of structure stiffness. For example, the greenfield information
χ can be used with the reduction factor based approach proposed by Klaret al. (2005) to estimate maximum bending moment within a pipeline buried above a tunnel. For this method, the tunnelling-induced pipeline bending moment can be evaluated usingMmax¼c Mmax,gf¼c EIχ, wherecis a reduction factor that can be estimated using the rigidity factorR¼EI/i3r0Es, wherer0is the radius of the pipe andEs is the Young’s modulus of the soil.
CONCLUSIONS
Centrifuge modelling of greenfield tunnelling in a uniform cohesionless soil was performed to study displacement and strain mechanisms around tunnels. The effects of key geometrical and tunnelling parameters in loose, medium dense and dense sands were considered, providing new insights into the combined influence of tunnel relative depth and soil density. The following list summarises the key findings presented in the paper.
(a) The variation of ground reaction curves with relative tunnel depth and soil density was in general agreement with trapdoor centrifuge tests reported by Dewoolkar et al. (2007) and Iglesiaet al. (2014). However, in contrast to the trapdoor results, it was shown that the greater the cover-to-diameter ratio (C/D) and/or the looser the soil, the higher the tunnel volume loss corresponding to the minimum tunnel pressure. (b) It was illustrated that vertical and horizontal
displacement patterns are a consequence of the soil’s ability to develop/maintain an arching mechanism. Qualitative soil arching mechanisms were proposed that related toC/Dand soil density.
(c) The new data for loose and medium dense sand showed a similar pattern to previously published data for dense sand (Marshallet al., 2012) in that settlement trough width increases withC/D, whereas it decreases with an increase in tunnel volume loss. Soil density was shown to have a noteworthy effect on settlement trough shape, especially for relatively deep tunnels (C/D.4). It was also demonstrated that the variation of settlement trough shape withC/Dand soil density is non-linear; this was related to soil arching and a transition from relatively shallow to deep tunnels.
(d) For the first time, a set of experimental data for a fine silica sand was provided that allows soil volume loss (Vl,s) to be related to tunnel volume loss (Vl,t) as a function of both soil relative density and normalised depth (z/zt). It was shown that, for a given magnitude ofVl,t, the looser the soil, the greater the value ofVl,s. The variation ofVl,swas shown to be significant and should be accounted for in design.
(e) Charts were provided that summarise normalised maximum settlements, central curvatures and width parameters from the experimental dataset. The implications of these data to the assessment of damage to surface and buried structures were provided. Judgement should be used before applying these outcomes to real cases which differ considerably from the conditions considered in the tests presented here.
ACKNOWLEDGEMENTS
This work was supported by the Engineering and Physical Sciences Research Council (EPSRC) (grant number EP/K023020/1, 1296878, EP/N509620/1). The authors would like to thank Maurizio Tomeo for his help with centrifuge test preparations.
NOTATION
C cover: distance from surface to tunnel crown c reduction factor
D tunnel diameter
Es Young’s modulus of the soil
EI pipe bending stiffness g acceleration due to gravity Id relative density
i distance between the centreline and the inflection point
K trough width parameter
Ks trough width parameter for surface settlements
Mmax maximum tunnelling-induced pipeline bending moment
N centrifuge acceleration
n shape parameter used in modified Gaussian curve R rigidity factor
r0 radius of pipe
V0 area of tunnel cross-section (per m length)
Vl,s volume loss of soil
Vl,t volume loss of tunnel
Vs area of settlement trough (per m length)
ux horizontal movement uz vertical movement uz,max maximum settlement
x horizontal offset distance from tunnel centreline z depth, measured from ground surface
zt depth of tunnel axis
α shape parameter used in modified Gaussian curve
0 1 2 3
(a) (b) (c)
4 5
0 1 2 3 4 5
χ
mg
,s
a
n
d/χ
cl
ay
Vl,t: % Vl,t: % Vl,t: %
0 1 2 3 4 5
0 1 2 3 4 5
0 1 2 3 4 5
CD1·3 CD2·0
CD2·4
CD4·4
CD6·3
z/zt = 0·5
0 1 2 3 4 5
CD1·3 CD2·0
CD2·4 CD4·4
CD6·3
z/zt = 0
Id = 0·3 Id = 0·5 Id = 0·9
Fig. 15. Variation of the ratioχmg,sand/χclayat varyingI
dwithVl,t: (a)Id= 0·3; (b)Id= 0·5; (c)Id= 0·9
γ shear strain
ΔV ground loss at tunnel periphery εv volumetric strain
ρ density of soil
σnorm normalised tunnel pressure at the axis level
σt tunnel pressure at the axis level
σt,0 initial tunnel pressure value
σt,min minimum tunnel pressure value
χ curvature
REFERENCES
Atkinson, J. H. & Potts, D. M. (1977). Stability of a shallow circular tunnel in cohesionless soil.Géotechnique27, No. 2, 203–215, https://doi.org/10.1680/geot.1977.27.2.203.
Dewoolkar, M. M., Santichaianant, K. & Ko, H. Y. (2007). Centrifuge modeling of granular soil response over active cir-cular trapdoors.Soils Found.47, No. 5, 931–945, https://doi.org/ 10.3208/sandf.47.931.
Dyer, M., Hutchinson, M. & Evans, N. (1996). Sudden valley sewer: a case history. In Geotechnical aspects of underground
construction in soft ground(eds R. J. Mair and R. N. Taylor),
pp. 671–676. London, UK: Balkema.
Fargnoli, V., Boldini, D. & Amorosi, A. (2013). TBM
tunnelling-induced settlements in coarse-grained soils: the
case of the new Milan underground line 5. Tunnelling
Underground Space Technol. 38, 336–347, https://doi.org/
10.1016/j.tust.2013.07.015.
Farrell, R., Mair, R., Sciotti, A. & Pigorini, A. (2014). Building response to tunnelling. Soils Found. 54, No. 3, 269–279, https://doi.org/10.1016/j.sandf.2014.04.003.
Franza, A. (2016). Tunnelling and its effects on piles and piled
structures. PhD thesis, University of Nottingham, Nottingham,
UK.
Franza, A. & Marshall, A. M. (2017). A centrifuge modelling study of the response of piled structures to tunnelling. J. Geotech.
Geoenviron. Engng142, No. 2, https://doi.org/10.1061/(ASCE)
GT.1943-5606.0001751.
Giardina, G., DeJong, M. J. & Mair, R. J. (2015). Interaction between surface structures and tunnelling in sand: centrifuge and computational modelling. Tunnelling Underground Space
Technol.50, 465–478, https://doi.org/10.1016/j.tust.2015.07.016.
Grant, R. J. & Taylor, R. N. (2000). Tunnelling-induced ground movements in clay.Proc. Instn Civ. Engrs–Geotech. Engng143, No. 1, 43–55, https://doi.org/10.1680/geng.2000.143.1.43. Iglesia, G. R., Einstein, H. H. & Whitman, R. V. (2014).
Investigation of soil arching with centrifuge tests. J. Geotech.
Geoenviron. Engng 140, No. 2, 04013005, https://doi.org/
10.1061/(ASCE)GT.1943-5606.0000998.
Jones, B. (2010). Low-volume-loss tunnelling for London ring main extension.Proc. Instn Civ. Engrs–Geotech. Engng163, No. 3, 167–185, https://doi.org/10.1680/geng.2010.163.3.167.
Klar, A., Vorster, T. E. B., Soga, K. & Mair, R. J. (2005). Soil–pipe interaction due to tunnelling: comparison between Winkler and elastic continuum solutions.Géotechnique55, No. 6, 461–466, https://doi.org/10.1680/geot.2005.55.6.461.
Klar, A., Vorster, T. E., Soga, K. & Mair, R. J. (2007). Elastoplastic solution for soil–pipe–tunnel interaction.J. Geotech. Geoenviron.
Engng 133, No. 7, 782–792, https://doi.org/10.1061/(ASCE)
1090-0241(2007)133:7(782).
Klar, A., Elkayam, I. & Marshall, A. M. (2015). Design oriented linear-equivalent approach for evaluating the effect of tunneling on pipelines. J. Geotech. Geoenviron. Engng 142, No. 1, 04015062, https://doi.org/10.1061/(ASCE)GT.1943-5606. 0001376.
Loganathan, N. & Poulos, H. G. (1998). Analytical prediction for tunneling-induced ground movements in clays.J. Geotech.
Geoenviron. Engng 124, No. 9, 846–856, https://doi.org/
10.1061/(ASCE)1090-0241(1998)124:9(846).
Mair, R. J. & Taylor, R. N. (1997). Theme lecture: bored tunnelling in the urban environment. InProceedings of 14th international
conference on soil mechanics and foundation engineering,
pp. 2353–2385. Rotterdam, the Netherlands: Balkema. Mair, R. J., Taylor, R. N. & Bracegirdle, A. (1993). Subsurface
settlement profiles above tunnels in clay.Géotechnique43, No. 2, 315–320, https://doi.org/10.1680/geot.1993.43.2.315.
Marshall, A. M. (2009). Tunnelling in sand and its effect on
pipelines and piles. PhD thesis, Cambridge University,
Cambridge, UK.
Marshall, A. M. & Franza, A. (2017). Discussion of“Observation of ground movement with existing pile groups due to tunneling in sand using centrifuge modelling” by Ittichai Boonsiri and Jiro Takemura.Geotech. Geol. Engng35, No. 1, 535–539, https://doi.org/10.1007/s10706-016-0083-x.
Marshall, A. & Mair, R. (2011). Tunneling beneath driven or jacked end-bearing piles in sand. Can. Geotech. J. 48, No. 12, 1757–1771, https://doi.org/10.1139/T11-067.
Marshall, A. M., Farrell, R., Klar, A. & Mair, R. (2012). Tunnels in sands: the effect of size, depth and volume loss on greenfield displacements.Géotechnique62, No. 5, 385–399, https://doi.org/ 10.1680/geot.10.P.047.
Ng, C. W. W., Hong, Y. & Soomro, M. (2015). Effects of piggyback twin tunnelling on a pile group: 3D centrifuge tests and numerical modelling. Géotechnique65, No. 1, 38–51, https:// doi.org/10.1680/geot.14.P.105.
Ritter, S., Giardina, G., DeJong, M. J. & Mair, R. J. (2017). Influence of building characteristics on tunnelling-induced
ground movements. Géotechnique 67, No. 10, 926–937,
https://doi.org/10.1680/jgeot.SIP17.P.138.
Ritter, S., Giardina, G., DeJong, M. J. & Mair, R. J. (2018). Centrifuge modelling of building response to tunnel excavation.Int. J. Phys. Modelling Geotech.18, No. 3, 146–161, https://doi.org/10.1680/jphmg.16.00053.
Rowe, R. & Kack, G. (1983). A theoretical examination of the settlements induced by tunnelling: four case histories. Can.
Geotech. J.20, No. 2, 299–314, https://doi.org/10.1139/t83-033.
Sagaseta, C., Sanchez-Alciturri, J. M., Gonzalez, C., Lopez, A., Gomez, J. & Pina, R. (1999). Soil deformations due to the excavation of two parallel caverns. In Geotechnical
engineering for transportation infrastructure: theory and
practice, planning and design, construction and maintenance (eds F. B. J. Barends, J. Lindenberg, H. J. Luger, A. Verruijt and L. de Quelerij), vol. 3, pp. 2125–2131. Rotterdam, the Netherlands: Balkema.
Sugiyama, T., Hagiwara, T., Nomoto, T., Nomoto, M., Ano, Y., Mair, R., Bolton, M. & Soga, K. (1999). Observations of ground movements during tunnel construction by slurry shield method at the Docklands Light Railway Lewisham Extension–East London.Soils Found.39, No. 3, 99–112.
Vorster, T. E. B., Klar, A., Soga, K. & Mair, R. J. (2005). Estimating the effects of tunneling on existing pipelines. J. Geotech.
Geoenviron. Engng 131, No. 11, 1399–1410, https://doi.org/
10.1061/(ASCE)1090-0241(2005)131:11(1399).
White, D., Take, W. & Bolton, M. (2003). Soil deformation measurement using particle image velocimetry (PIV) and photo-grammetry. Géotechnique53, No. 7, 619–631, https://doi.org/ 10.1680/geot.2003.53.7.619.
Wong, R. C. K. & Kaiser, P. K. (1991). Performance assessment of tunnels in cohesionless soils. J. Geotech. Engng 117, No. 12, 1880–1901.
Zhou, B. (2014).Tunnelling-induced ground displacements in sand. PhD thesis, University of Nottingham, Nottingham, UK. Zhou, B., Marshall, A. M. & Yu, H. S. (2014). Effect of
relative density on settlements above tunnels in sands. In Geo-Shanghai 2014: tunneling and underground construction (eds W. Ding and X. Li), GSP 242, pp. 96–105, https://doi. org/10.1061/9780784413449.010. Reston, VA, USA: American Society of Civil Engineers.